Influence of quenched disorder created by nanosilica network on phase transitions in tetracosane†
M. Vijay
Kumar
and
S. Krishna
Prasad
*
Centre for Soft Matter Research, Jalahalli, Bangalore 560 013, INDIA. E-mail: skpras@gmail.com; Tel: +91-80-28381119
First published on 14th August 2012
Abstract
Calorimetric measurements on composites of a long chain n-alkane, tetracosane, doped with nanosilica aerosil particles decorated with a corona of hydrophobic/hydrophilic nature are described. The weakly perturbing random field created by the addition of the aerosil particles has the general effect of weakening all the transitions to, and between, the three different rotator phases that the pure alkane exhibits. One of highlights of the studies is that the strong first order transitions of the pure alkane, viz., from the isotropic liquid to hexagonal rotator phase (Iso–R2), and tilted monoclinic rotator phase to the crystalline phase (R5–Cr), are accompanied by a much weaker supplementary peak at lower temperatures. In analogy with observations made in aerosil composites of liquid crystalline systems, and additionally with information from preliminary Xray diffraction measurements on the currently studied materials, it is reasoned that the subsidiary peaks are nothing but the transformations between the same phases as the corresponding main peaks due to the bulk of the material, but occurring in the vicinity of the surface of the aerosil particles. The nature of the corona of the aerosil particles also seems to play an important role. For the bulk transitions, the reduction in the transition enthalpy is higher for the composites with the hydrophilic particles, than those with hydrophobic particles; the opposite is true for the surface transitions. The data also suggest that the lowering of the transition temperature of the surface transition with respect to its bulk counterpart is more for the hydrophobic composites than the hydrophilic ones. We provide an explanation for these features based on the surface interactions between the particles and tetracosane molecules, and also the strength of the gel network.
1. Introduction
Despite a simple molecular structure, long chain n-alkanes (CnH2n+2 or Cn for short) exhibit a variety of phases, termed rotator phases, which are less ordered than a crystal (Cr) but more ordered than a melt isotropic liquid (Iso) phase.1–3 These intermediate phases consist of layered structures with three-dimensional crystalline order of the molecular centres, but without long-range orientational order, imparting a plastic nature to the state. They are interesting in their own right owing to the attractive features of surface crystallization, negative thermal compressibility, anomalous high heat capacity and high thermal expansion properties, but also due to uses such as in the petroleum and lubricating industry, and applications as thermohydraulic microactuators.4–6 In bulk alkanes, up to five rotator phases have been identified by using the lattice distortion (D), tilt magnitude (φ) and its direction as the distinguishing parameters.2 For the alkane employed in the present study, three of them, referred to simply as, R2, R1 and R5 phases, are relevant. While the R1 and R2 phases have an upright structure, the R5 phase has a tilted arrangement of the molecules with reference to the layer normal. The R2 phase with the highest symmetry, has a rhombohedral structure with an undistorted hexagonal lattice. In the R1 phase the hexagonal structure is distorted leading to a rectangular lattice. The distortion D may be defined as 1 − A/B, where A and B are the major and minor axis of an ellipse drawn through the six next-nearest neighbours when viewed along the axis of the chains. Thus, D = 0, φ = 0 in the R2, D ≠ 0, φ = 0 in the R1 and D ≠ 0, φ ≠ 0 in the R5 phase. A nicely illustrative diagram of the molecular diagram of the different rotator phases is given in refs 2 and 3. The Landau theory of phase transitions involving these phases has been extensively worked out.7Investigations of alkanes in a geometrically confined environment have attracted significant interest in recent times. Such a restriction has been imposed, for example, by confining the alkane in a prefabricated structure such as Vycor glass,8 embedding microcapsules,9 using a well defined porous matrix such as Anopore10 or an irregular network like PTFE matrix.10 Attempts have also been made to realize the consequent disorder by having the material in an aerosil network created by nano-sized silica spheres.11 The fragile hydrogen bond network caused by the interactions between the silica particles renders the disorder to be created in situ. An important advantage of such a network, well exploited in composites of aerosil–liquid crystal (LC) materials,12,13 is that by simply varying the concentration of the silica particles the resulting random disorder can be controlled and fine tuned.14–21 Further, the LC–aerosil composites exhibit gelation, covering the range of soft to rigid gels, with increasing concentrations of aerosil.22 In this context, it is interesting to note that in recent photopyroelectric calorimetry studies, Zammit et al.11 found that in mixtures of tetracosane (C24) with hydrophilic aerosil particles, an additional peak appears below the isotropic–R2 (Iso–R2) transition, and attributed it to the transition occurring at the surface of the particles. In the work of ref. 11, the results were explained on the basis of an additional interfacial layer created at the particle surface. It must be noted, however, that the alkanes are hydrophobic in nature. Therefore we planned to investigate composites of an alkane and aerosils in which the particle has decorations of the hydrophobic kind, with the idea that the effect of confinement and particle surface influences may get enhanced due to the hydrophobic nature of the alkane. Here we describe the results of calorimetric investigations on the nanocolloidal composites of C24 with aerosil particles of a few-nm size capped with hydrophobic entities. For comparison, data has also been obtained on composites with hydrophilic particles of the same size. The concentration range of the aerosil particles employed puts the system in the soft gel regime as per the classification made22 for the aerosil–LC composites. The results bring out the influence of random field created by the aerosil network on phases exhibiting three-dimensional order, and can be used to compare and contrast the effects by similar networks on the more fluid liquid crystalline materials.
2. Experimental details
The host material for these experiments was the normal alkane n-tetracosane (C24H50 or simply C24) obtained from Sigma. To achieve the required quenched disorder, two types of nanosilica particles (Aerosil®) were employed, both from Degussa corporation (provided as a gift by Mr Vikas Rane of d-hindia Ltd, Mumbai). One of them is hydrophilic (Aerosil A-300) , and the other hydrophobic (Aerosil R812) with the specific surface area being 300 ± 30 and 260 ± 30 m2 g−1, respectively. In both the cases, the primary particle is spherical in shape, with an average diameter of 7 nm. The manufacturing procedure employed produces spherical particles initially, but at the end of the production process the particles fuse into aggregates with branched fractal structures.23The composites of C24 with the aerosil materials were prepared using mechanical mixing as well as solvent mixing procedures, similar to protocols described in an earlier paper.21 Measurements made on a representative composite showed that there are no differences in the behavior of the materials prepared by the two methods. In this study the aerosil mixtures are characterized in terms of the dimensionless ratio ρ = ma/mC24, where ma is the mass of aerosil and mC24 is the mass of tetracosane. Investigations have been carried out on mixtures with ρ = 0.03, 0.06, and 0.10 as well as on pure C24. Differential scanning calorimetric measurements were done with a Perkin Elmer DSC (Diamond DSC), while keeping the sample in an inert (nitrogen) atmosphere.
3. Results and discussion
3.1. Isotropic–R2 transition
Fig. 1 shows the DSC profiles obtained at a rate of 1 °C min−1 in the heating and cooling modes in the vicinity of the Iso–R2 transition for pure C24 and the composites. The pure alkane exhibits a single peak (see Fig. 1a) in both the modes, although with a sizeable hysteresis between the heating and cooling scans, a feature expected for strong first order transitions. In contrast, the aerosil composites, even at the lowest concentration studied here, exhibit an additional, albeit much weaker, thermal anomaly (see Fig. 1b–d) at temperatures just below the main peak, more clearly seen on an expanded scale, as in Fig. 2. For low concentration aerosil composites, the appearance of the second peak in both specific heat and DSC profiles, absent in the pure material, has been known for LC–aerosil composites exhibiting the nematic–isotropic transition [See e.g., refs 18, 21]. This feature has also been recently observed in heat capacity data for hydrophilic aerosil–C24 mixtures.11 However, as we shall see later, the nature of the aerosil particle—hydrophilic/hydrophobic—results in certain important differences in the behavior of the system. We have concentrated on the mixtures formed with hydrophobic particles since (i) the chemical nature of the tips of the decorations (methyl groups) and the host alkane are the same, and thus the phase transitions in the composites can be expected to be significantly influenced, and (ii) some data on the effect of hydrophilic aerosil particles have already been reported.11 It is clear from Fig. 1 that the magnitude of ρ has a larger influence on the weaker low temperature peak (referred to as R2–X) than on the high temperature peak (Iso–R2). The Iso–R2 shows, concomitant with the appearance of R2–X, a slight increase initially in the peak height, but with further increase in ρ, registers a drop. In contrast, the peak height of R2–X increases by a factor of ∼6 for ρ = 0.1, from its negligible strength for ρ = 0.03.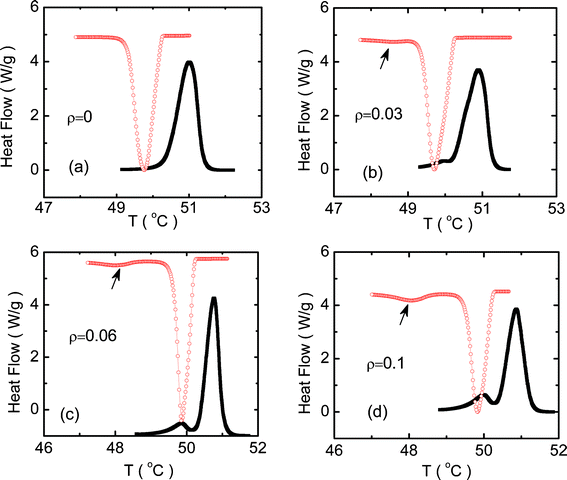 | ||
| Fig. 1 Differential scanning calorimeter (DSC) profiles obtained in the vicinity of the Iso–R2 transition in the heating (filled black squares) and cooling (open red circles) modes at a rate of 1 °C min−1 for the (a) pure C24, and the hydrophobic composites with ρ of (b) 0.03, (c) 0.06 and (d) 0.1. The arrows on the cooling mode data indicate the appearance of an additional peak, which is designated as the R2–X transition. | ||
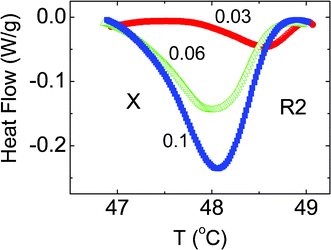 | ||
| Fig. 2 DSC profiles shown on an enlarged scale in the vicinity of the R2–X transition observed for the three hydrophobic composites, the concentrations (ρ) of which are indicated against each curve. Note that the strength of the transition increases as ρ increases. | ||
Fig. 3 and Table 1 present the peak temperatures in both the heating and cooling modes for both Iso–R2 and R2–X transformations. The peak temperature of the Iso–R2 transition hardly changes (within the error of 0.1 °C in the measurement) with concentration for both the modes. It may be recalled here that the LC–aerosil composites do exhibit a clear, albeit weak, concentration dependence of the N–I transition temperature over the range of aerosil density (ρ) studied here [See e.g., ref. 18]. On the other hand, the peak temperature of R2–X is very weakly dependent on ρ in the heating mode, but strongly so in the cooling mode, resulting in an enhanced range of 1.75 °C for the intermediate region, before the R2–X transition sets in. However, even for ρ = 0.1, the ratio of the peak heights of the R2–X to Iso–R2 transitions is only about 0.07, whereas in the LC cases, the two peaks would have comparable height.14 The feature that the magnitude of the hysteresis, which can be taken to be a measure of the first order character of the transition, is hardly affected for the Iso–R2 but increases for the R2–X, should be suggesting that the thermal strength of the transition is influenced similarly. However, the transition enthalpy ΔH (calculated from the area under the peaks) dependence on ρ, as displayed in Fig. 4, and tabulated in Table 1, show that the Iso–R2 transition exhibits a 50% lowering in the value from ρ = 0 to 0.1, whereas the R2–X transition grows by an order of magnitude (see Fig. 2).
![The ρ-dependence of the transition temperature for the Iso–R2 (upper panel) and R2–X (lower panel) transitions in the hydrophobic system. Notice that the scale for the lower panel is a factor of 3 larger than that for the upper panel. Within the error of the measurement, there is hardly any concentration dependence for the Iso–R2 transition, but substantial variation for the R2–X transition. [The error bar for the lower panel data is roughly the same size as that of the symbols.]](/image/article/2012/RA/c2ra21480f/c2ra21480f-f3.gif) | ||
| Fig. 3 The ρ-dependence of the transition temperature for the Iso–R2 (upper panel) and R2–X (lower panel) transitions in the hydrophobic system. Notice that the scale for the lower panel is a factor of 3 larger than that for the upper panel. Within the error of the measurement, there is hardly any concentration dependence for the Iso–R2 transition, but substantial variation for the R2–X transition. [The error bar for the lower panel data is roughly the same size as that of the symbols.] | ||
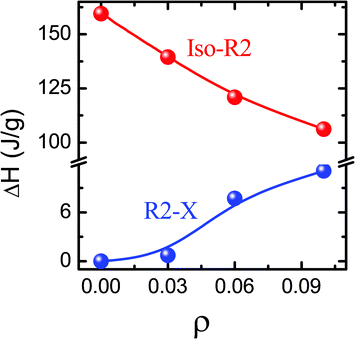 | ||
| Fig. 4 The concentration dependence of the transition enthalpies for the Iso–R2 and R2–X transitions in the hydrophobic system, exhibiting a slight (∼50%) decrease for the former and a large (∼an order of magnitude) increase for the latter set. | ||
| ρ | Iso–R2 | R2–X | ||
|---|---|---|---|---|
| Heating | Cooling | Heating | Cooling | |
| 0 | 51.00 | 49.76 | — | — |
| [157.0] | [159.6] | |||
| 0.03 | 50.90 | 49.72 | 49.97 | 48.61 |
| [132.7] | [139.4] | [0.88] | [0.72] | |
| 0.06 | 50.76 | 49.89 | 49.86 | 48.00 |
| [124.1] | [120.9] | [7.53] | [7.71] | |
| 0.1 | 50.87 | 49.84 | 50.18 | 48.07 |
| [104.8] | [106.2] | [11.4] | [11.09] | |
Before discussing the possible causes for the appearance of R2–X and its ρ-dependence, we shall compare these results with those obtained for composites having hydrophilic aerosil particles. The scans in the vicinity of the transition to the Iso phase are shown in Fig. 5 for the two different composites consisting of the same amount of aerosil (ρ = 0.1), but with hydrophobic and hydrophilic corona. Both the composites exhibit the double peak profile, but the one with hydrophilic particles has considerably weaker transitions. Further, while the Iso–R2 transition temperatures are comparable between the two types, the R2–X transition occurs at a slightly lower temperature for the system with hydrophobic particles. The transition enthalpies are also lower for the hydrophilic case, being as much as a factor of 2 for the R2–X transition.
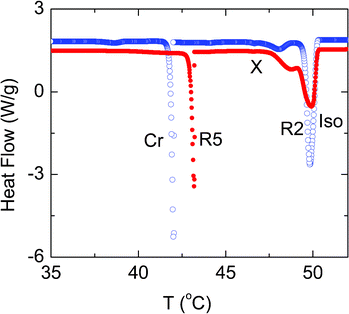 | ||
| Fig. 5 A diagram comparing the DSC scans obtained for the ρ = 0.1 composites with hydrophobic (open circles) and hydrophilic (filled circles) particles. All the transitions are weaker for the hydrophilic material. | ||
In the following we explore the possible reason for the appearance of the two peaks (Iso–R2 and R2–X) in the composites. In analogy with the arguments made for the LC–aerosil composites, the observed double peak profile here can be viewed in terms of a surface transition separated from a bulk transition.11 The bulk transition is caused by molecules which are away from the aerosil surfaces so as not to be influenced by the particles. The second transition, which in the present case as well as for LC materials occurs at a lower temperature than the bulk one, is due to the molecules which are attached to, or in the “catchment” region of the particles. The alkane molecules in the immediate vicinity can bind to a particle with an orientation that is locally perpendicular to the aerosil surface creating a region of disorder in comparison to the ordering that gets developed in the region of bulk molecules. A reduction in the ordering for the surface molecules, would thus lower the transition temperature (In the LC case, when the surface induces a higher order, an increase in transition temperature has been observed, see e.g., ref. 24). If the situation is such that the surface effect is weak, then one expects a mere broadening of the bulk peak. If the aerosil surface effects become strong, then there can be a bifurcation of the temperature at which the bulk and the surface molecules undergo the transition resulting in doubling of the peaks. If this argument is true then with increasing concentration of aerosil particles, the strength of the bulk transition should decrease and that due to the surface particles must increase. This is indeed observed in the experiments. Therefore the R2–X transition is nothing but the Iso–R2 transition happening at the aerosil surface. This view is further corroborated by preliminary Xray studies which show that the scattering profile, and thus the structure, remains the same on either side of the R2–X transition (see ESI – Fig. SI-1†).
Let us recall that the ratio of the peak heights of the surface and bulk transitions is much smaller in the present case as compared to the LC case. This perhaps should be expected since in the LC case, the ordered phase (nematic) is also a fluid. Therefore the surface effects can be expected to extend to regions farther from the surface, increasing the number of molecules which get influenced. In contrast, in the present case, the ordered phase has 3-d positional order which does not favour the surface effect to penetrate deeper resulting in a weaker surface peak.
The data in Fig. 5 bring out the differing influences of the nature of the corona on the bulk and surface transitions. Compared to the pure C24 (see Fig. 1a), the reduction in the strength of the Iso–R2 (bulk) transition is more for the hydrophilic composite. However, the surface induced transition is also weaker for this system. In other words, the effect on the bulk part is more for the hydrophilic case, and the effect due to the surface is stronger for the hydrophobic. Now we discuss the probable cause for such a difference. For this purpose, let us consider the essential difference between the surfaces of the two kinds of particles, by taking into account the information provided in the Technical Bulletin no. 11 of Degussa AG. The continuous flame hydrolysis process results in fumed nanosilica particles which are hydrophilic in nature due to the presence of silanol (Si–OH) groups at the surface. The surface chemistry which is thus dominated by the silanol groups is the main feature of these particles. The presence of such groups gives rise to hydrogen bonding through which a particle can bond (hydrogen or H-bridge) with its neighbor or with another molecule. The probability of finding a suitable neighbor particle for a silanol group for the purpose of forming an H-bridge increases with the fineness of the particle. In other words, as the diameter of the particle decreases the number of free OH groups decreases. For the hydrophilic aerosil studied here (A-300) this density is in the range of 2.5 free OH groups nm−2. The hydrogen bonding, in fact, is responsible for the hydrophilic character as it easily binds with water. The good chemical reacting nature of these silanol groups provides a pathway to convert the surface from hydrophilic to hydrophobic type. To achieve hydrophobic aerosils, the silanol groups of freshly produced hydrophilic silica are made to react with molecules like hexamethyldisiloxane (for R812, the hydrophobic aerosil used here) resulting in the formation of Si–O–Si(CH3)3 units, and consequently the material acquires a hydrophobic character. The chemical treatment substitutes only 70% of the silanol units with the result that 30% of free Si–OH sites remain. From the point of view of the current studies, the presence of these free silanols, as well the large number of methyl units attached to the particle, are important.
An important character of the hydrophilic aerosils is their ability to gelate non-polar liquids, owing to the capability of the particles to H-bond among themselves, creating a fragile network. At low concentration of the aerosil, this network is not so strong and deforms easily under external stress, resulting in soft gels. At higher concentrations, the structure becomes rigid, giving rise to stiff gels. These features manifest to enhance the viscosity of the system by orders of magnitude. In the present study, we could visually observe the enhancement of the viscosity in the isotropic phase of composites of both types of aerosils. This indicates that in the hydrophobic case, even the reduced number of silanol groups is sufficient to create a gel-like situation. In fact, rheological measurements25 show that the composites with either type of particles form gels, showing that even though only a fraction of silanol groups are left over they help in gelation of the hydrophobic system. However, the hydrophilic gel is very strong, having a storage modulus which is 7 orders of magnitude higher than that for the hydrophobic composite. Obviously the strength of the gel alone cannot account for the effect on both the bulk and surface parts seen in the calorimetric data (Fig. 1 and 2).
The nature and strength of anchoring of the C24 molecules on the two different types of silica surfaces is employed in the following to explain the experimental features. The SiO surface is known to disorder the LC molecules which are in its vicinity.26 Owing to the large surface to volume ratio, the aerosils can be expected to amplify this disordering effect. Indeed, in the case of LC, various studies have shown that the presence of aerosils disorders the liquid crystalline phase.14–17,21,27,28 We reported evidence21 of a clear acceleration of the relaxation frequency associated with motion of the molecules about the short molecular axis, in composites of aerosils with a weakly polar molecule, and attributed it to the disorder caused by the particles. It should be mentioned that in these LC systems, the molecules are polar, and in the majority of the cases strongly so, in contrast to the entirely nonpolar C24 molecule. To understand the different behavior of the LC and alkane systems, it should be recalled that unlike in the case of A-300 aerosils, R 812 particles have a short methyl group protruding out of the silica surface. Therefore the C24 molecules find a favourable situation, through van der Waals forces, to lie parallel to these hydrophobic groups, a condition which mimics a stronger anchoring normal to the aerosil surfaces. Owing to the predominantly spherical shape of the aerosil particles, this creates a hedgehog type of arrangement of the C24 molecules around the particle. This situation is schematically shown in Fig. 6. Now, if the system undergoes the transition from the Iso to the R2 phase at the same temperature at the surface as well as in the bulk regions, then the disordering effect of the surface would create a number of defect centres near the aerosil surface, which may be energetically not favourable. A possible escape for the sample is to have a separate surface transition occurring at a different temperature than the bulk one. If the surface enhances the ordering of the system, then the transition would take place at a temperature higher than the bulk.27,29 In contrast, since the aerosil surface causes a disorder in the system, the surface transition occurs at a temperature lower than that of the bulk. The gelation process creates bounding surfaces for the C24 molecules to be enclosed. The dimension ξ of such enclosures could then mimic situations of finite sized systems. The reduction in the strength of the bulk transitions can be expected to be dependent on ξ. The smaller storage modulus for the hydrophobic composite means a weaker gel or a looser network defining a much larger sized enclosure (larger ξ) than in the hydrophilic composite. This explains the stronger influence on the bulk transitions in the hydrophilic case. On the other hand, due to the domination of van der Waals attraction between the methyl groups on the surface and the tetracosane molecules in the vicinity of the particle, the surface forces become stronger for the hydrophobic case, resulting in an enhanced strength of the surface transitions.
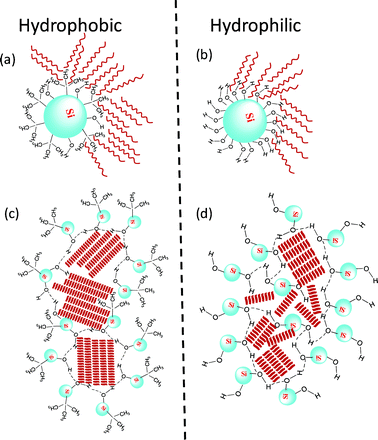 | ||
| Fig. 6 A schematic diagram depicting the chemistry of the surface of the aerosil (Si) particles with (a) hydrophobic and (b) hydrophilic corona. The former with its smaller number of free OH groups forms a much looser network (larger enclosure size) than the latter, as shown in (c) and (d). The red lines represent the C24 molecules. | ||
R2–R1 and R1–R5 transitions
The calorimetric profiles across the R2–R1 (labeled X–R1 for the composites) and R1–R5 transitions are presented in Fig. 7 for pure C24 and the three different hydrophobic composites. Both the transitions, which are quite strong for the pure compound, systematically weaken for the composites. The effect appears to be more on the R1–R5 transition, which appears just as a step-like change for the ρ = 0.1 mixture. Recalling that this transition is first order for pure C24, albeit weakly, the step-like change for the ρ = 0.1 composite indicates a crossover from first order to a second order transformation. As Fig. 8 shows, the effect is more on the hydrophilic composite than on the hydrophobic one. It may be recalled here that the C24 material when confined in an Anopore membrane10 undergoes such a drastic weakening of the R1–R5 transition so as to suggest that the transition is indeed second order and lying in the vicinity of a tricritical point. Our Xray studies also indicate that across the R1–R5 transition, pure C24 exhibits a step-like variation in D, whereas the ρ = 0.1 material shows a continuous variation. It is known that this transition is driven first order due to the coupling between θ and D.7 Thus the continuous variation of D perhaps results in a second order transition for the composite. Owing to the strong temperature dependence of the background signal (especially for the composites) on the low temperature side of the R1–R5 transition, we are unable to unequivocally determine the enthalpy for this transformation. The transition enthalpy data for the R2–R1 transition is, as shown in Table 2, on the lines of what was observed for the Iso–R2 transition, diminishing in magnitude with increasing ρ value. Likewise, the transition temperature is hardly affected by the presence of the aerosil.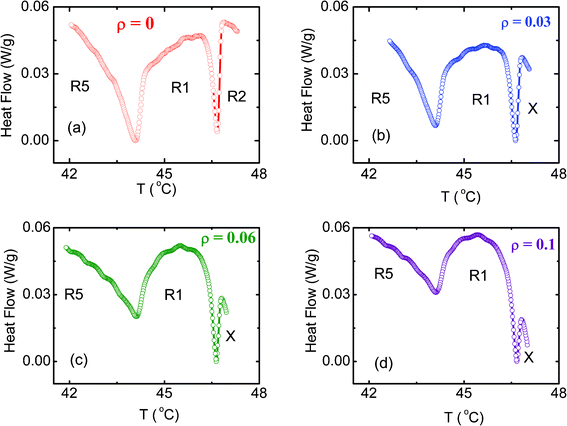 | ||
| Fig. 7 DSC profiles for (a) the pure C24 and (b, c, d) the three hydrophobic composites in the vicinity of the R2–R1 (X–R1 for the composites) and R1–R5 transitions. The significant weakening of both the transitions with increasing ρ is clearly seen. | ||
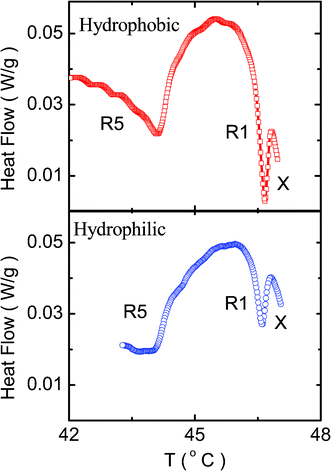 | ||
| Fig. 8 A comparison of the profiles obtained for the ρ = 0.1 concentration composites with hydrophobic (top panel) and hydrophilic (bottom panel) particles. The system with latter type of particles exhibits much weaker transitions. | ||
| ρ | R2–R1/X–R1 | R1–R5 | R5–Cr | Cr–X2 |
|---|---|---|---|---|
| a Owing to the weakness of the transition, as well as the strong temperature dependence of the background, enthalpy values are not given. | ||||
| 0 | 46.65 | 44.05 | 41.96 | — |
| [0.67] | [0.86] | [92.4] | ||
| 0.03 | 46.62 | 44.05a | 42.49 | 38.28 |
| [0.41] | [66.3] | [0.09] | ||
| 0.06 | 46.64 | 44.09a | 41.8 | 38.41 |
| [0.40] | [61.5] | [1.27] | ||
| 0.1 | 46.67 | 44.09a | 41.98 | 38.63 |
| [0.30] | [58.5] | [2.10] | ||
R5–Crystal transition
Finally we describe the features observed for the transition involving the true crystallization of the sample, viz., from the R5 to the crystal (Cr) phase. The DSC profiles obtained in the vicinity of the R5–Cr transition are shown in Fig. 9a for the pure sample and the composites. There is a slight weakening of the peak with increasing ρ. More interestingly, while a single peak is seen for the pure compound, the composites exhibit an additional peak at a lower temperature (see Fig. 9b), whose strength increases as the concentration of aerosil increases, a feature reminiscent of the behavior near the Iso–R2 transition. We label this second feature the Cr–X2 transition. Just as in the R2–X case, Xray measurements show no difference in the diffraction patterns taken at temperatures above and below this transition, providing a strong indication that this second peak must be the R5–Cr transition occurring in the vicinity of the aerosil particles, a surprising feature considering the fact that the transformation is between three dimensionally positional ordered phases. In fact, this appears to be the first observation of such a transformation. Again, the hydrophilic system has a weaker Cr–X2 signature than the corresponding hydrophobic composite.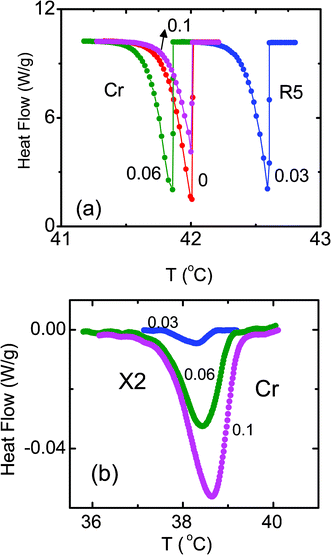 | ||
| Fig. 9 (a) DSC profiles across the R5–Cr transition for the pure compound and the three composites with concentrations indicated against each profile. The secondary peak seen at a lower temperature for the composites is displayed in panel (b). | ||
Two general observations concerning the results described above can be made. Firstly, the peak doubling is seen only for the strong first order transformations, perhaps indicating a correlation with the presence of orders/disorders of different magnitudes coexisting in the surface and bulk regions. This point should be viewed with a caveat. Enthalpy-wise the secondary peaks, present only in the composites, are much weaker than those associated with the bulk: for example, in the case of the highest aerosil concentration composite, the R2–X transition has a transition enthalpy which is only ∼7% as that of the Iso–R2 transition. If such secondary peaks do exist for the R2–R1 and R1–R5 transitions, the already low enthalpy of the bulk transitions would preclude the feature from being seen. Secondly, preliminary Xray diffraction measurements do not show any peak broadening in the rotator phases, a feature that was observed for the Anopore confined sample reported earlier.10 Further, the aerosil composites of even the highest concentration studied have only a slight lowering in the magnitude of the decrease in the layer spacing seen across the R1–R5 transition. In contrast, the Anopore confined sample exhibited a substantial smearing of the transition. Thus the DSC data and Xray observations are in mutual agreement and also fall in line with the features seen for the Anopore-confined sample. It may be mentioned that (i) in the Anopore-confined case, the Xray peak broadening, determined using Debye–Scherrer expression, corresponded to a correlation length of 190 nm (comparable to the diameter of the Anopore), and (ii) the resolution of the Xray apparatus used for these purposes is in the range of 400–500 nm. Thus the non-broadening of the peaks in the aerosil cases suggests that the diameter of the pore (created by the aerosil network, in which C24 molecules get confined) may not be less than about 500 nm. This value is higher than what has been reported for the isotropic–smectic A phase transition of LC–aerosil composites.30 It is possible that three dimensional positional ordering of the rotator phases studied here, as against the one-dimensional ordering in the case of the smectic A phase, is responsible for this difference. It is also possible that the 2-d fluid nature of the smectic A phase, which increases the intensity contribution to the wings of the profile forcing the usage of a slightly different expression for the calculation of the correlation length, is the influencing factor. However, the main point that we would like to emphasize is that the aerosil composites provide a continuously variable tool—the concentration of the particles—to control the nature of the R1–R5 transition, a detailed inspection of which is a problem for the future.
4. Summary
We have carried out differential scanning calorimetric measurements on composites of nanosilica aerosil particles with tetracosane, an n-alkane exhibiting different types of rotator phases. The presence of the aerosil particles has the general effect of weakening all the transitions observed in the system. Both the strong first order transitions of the pure alkane, viz., Iso–R2 and R5–Cr, are accompanied by a subsidiary peak, although much weaker. In analogy with observations made in similar composites of liquid crystalline systems, and also with the knowledge of the preliminary Xray diffraction measurements on the currently studied materials, it is argued that the subsidiary peaks are nothing but the transformations between the same phases as the corresponding main peaks, but occurring in the vicinity of the aerosil particles. The nature of the corona of the aerosil particles also turns out to have an important influence. For all the transitions seen in the pure material, the reduction in the strength—in terms of transition enthalpy—is higher for the composites with the hydrophilic particles, than those with hydrophobic particles. In contrast, the transitions occurring at the surface are stronger for the hydrophobic systems. Further, the downward temperature shift in the transition temperature of the surface transition with respect to its bulk counterpart is more for the hydrophobic composites than the hydrophilic ones. Detailed Xray studies, being planned, are expected to shed more light on these fine tunable surface-driven phase transformation events.References
- A. Craievich, J. Doucet and I. Denicolo, Phys. Rev. B, 1985, 32, 4164–4168 CrossRef CAS.
- (a) E. B. Sirota, H. E. King, D. M. Singer and H. H. Shao, J. Chem. Phys., 1993, 98, 5809–5824 CrossRef CAS; (b) E. B. Sirota, D. M. Singer and H. E. King, J. Chem. Phys., 1994, 100, 1542–1551 CrossRef CAS; (c) E. B. Sirota, Langmuir, 1997, 13, 3849–3859 CrossRef CAS.
- N. Wentzel and S. T. Milner, J. Chem. Phys., 2010, 132, 044901–1-10 CrossRef.
- U. Zammit, M. Marinelli, F. Mercuri and S. Paoloni, J. Phys. Chem. B, 2010, 114, 8134–8139 CrossRef CAS.
- M. Lehto, J. Schweitz and G. Thornell, J. Microelectromech. Syst., 2007, 16, 728–733 CrossRef.
- E. B. Sirota and H. E. King Jr., Science, 1998, 281, 143a CrossRef.
- See e.g., P. K. Mukherjee, J. Phys. Chem. B, 2012, 116, 1517–1523 CrossRef CAS and references therein.
- P. Huber, D. Wallacher, J. Albers and K. Knorr, Europhys. Lett., 2004, 65, 351–357 CrossRef CAS.
- D. Fu, Y. Su, B. Xie, H. Zhu, F. Liu and D. Wang, Phys. Chem. Chem. Phys., 2011, 13, 2021–2026 RSC.
- M. Vijay Kumar, S. Krishna Prasad and D. S. Shankar Rao, Langmuir, 2010, 26, 18362–18368 CrossRef CAS.
- U. Zammit, M. Marinelli, F. Mercuri, S. Paoloni and F. Scudieri, J. Phys. Chem. B, 2011, 115, 2331–2337 CrossRef CAS.
- G. S. Iannacchione, Fluid Phase Equilib., 2004, 222–223, 177–187 CrossRef CAS.
- V. Popa-Nita, I. Gerlic and S. Kralj, Int. J. Mol. Sci., 2009, 10, 3971–4008 CrossRef CAS.
- G. S. Iannacchione, C. W. Garland, J. T Mang and T. P. Rieker, Phys. Rev. E: Stat. Phys., Plasmas, Fluids, Relat. Interdiscip. Top., 1998, 58, 5966–5981 CrossRef CAS.
- N. Prasad Bapat, D. S. Shankar Rao and S. Krishna Prasad, Thermochim. Acta, 2009, 495, 115–119 CrossRef.
- M. Marinelli, A. K. Ghosh and F. Mercuri, Phys. Rev. E: Stat. Phys., Plasmas, Fluids, Relat. Interdiscip. Top., 2001, 63, 061713–1-9 CrossRef CAS.
- (a) Z. Kutnjak, S. Kralj and S. Zumer, Phys. Rev. E, 2002, 66, 041702-1-8 CrossRef; (b) A. V. Zakharov and J. Thoen, Phys. Rev. E: Stat., Nonlinear, Soft Matter Phys., 2004, 69, 011704–1-5 CrossRef CAS.
- A. Roshi, G. S. Iannacchione, P. S. Clegg and R.J. Birgeneau, Phys. Rev. E: Stat., Nonlinear, Soft Matter Phys., 2004, 69, 031703–1-11 CrossRef CAS.
- T. Bellini, N. A. Clark, V. Degiorgio, F. Mantegazza and G. Natale, Phys. Rev. E: Stat. Phys., Plasmas, Fluids, Relat. Interdiscip. Top., 2000, 57, 2996–3006 CrossRef.
- T. Jin and D. Finotello, Phys. Rev. Lett., 2001, 86, 818–821 CrossRef CAS.
- (a) C. V. Lobo, S. K. Prasad and C. V. Yelamaggad, J. Phys.: Condens. Matter, 2006, 18, 767–776 CrossRef CAS; (b) V. Jayalakshmi, G. Geetha Nair and S. K. Prasad, J. Phys.: Condens. Matter, 2007, 19, 226213–1-12 CrossRef.
- R. Bandyopadhyay, D. Liang, R. H. Colby, J. L. Harden and R. L. Leheny, Phys. Rev. Lett., 2005, 94, 107801–1-4 CrossRef.
- F. J. Galindo-Rosales, F. J.Rubio-Hernández and J. F. Velázquez-Navarro, Rheol. Acta, 2009, 48, 699–708 CrossRef CAS.
- P. Sheng, Phys. Rev. Lett., 1976, 37, 1059–1062 CrossRef CAS.
- M. Vijay Kumar, R. Bhargavi, G. G. Nair and S. Krishna Prasad, Manuscript in preparation. Search PubMed.
- See e.g., H. Yokoyama, S. Kobayashi and H. Kamei, Mol. Cryst. Liq. Cryst., 1983, 99, 39–52 CrossRef CAS.
- A. Arcioni, C. Bacchiocchi, I. Vecchi, G. Venditti and C. Zannoni, Chem. Phys. Lett., 2004, 396, 433–441 CrossRef CAS.
- G. Sinha, J. Leys, C. Glorieux and J. Thoen, Phys. Rev. E: Stat., Nonlinear, Soft Matter Phys., 2005, 72, 051710–1-10 CrossRef CAS.
- See e.g., S. Aya, Y. Sasaki, F. Araoka, K. Ema, K. Ishikawa, A. V. Emelyanenko and H. Takezoe, Phys. Rev. Lett., 2011, 106, 117801–1-4 CrossRef.
- M. K. Ramazanoglu, P. S. Clegg, R. J. Birgeneau, C. W. Garland, M. E. Neubert and J. M. Kim, Phys. Rev. E: Stat., Nonlinear, Soft Matter Phys., 2004, 69, 061706–1-8 CrossRef CAS.
Footnote |
| † Electronic supplementary information (ESI) available. See DOI: 10.1039/c2ra21480f |
| This journal is © The Royal Society of Chemistry 2012 |
