Can ionization induce an enhancement of hydrogen storage in Ti2–C2H4 complexes?
Nitin
Wadnerkar
a,
Vijayanand
Kalamse
a and
Ajay
Chaudhari
*b
aSchool of Physical Sciences, Swami Ramanand Teerth Marathwada University, Nanded–431606 (MS), India
bDepartment of Physics, The Institute of Science, FORT, Mumbai 400032 (MS), India. E-mail: ajaychau5@yahoo.com
First published on 26th July 2012
Abstract
We predicted here gravimetric hydrogen storage capacity of Ti2–C2H4 and Ti2–C2H4+ complexes using density functional theory (DFT) method. The number of adsorbed H2 on Ti2–C2H4 is limited to ten. It has been seen that controlling the charge-state of this complex enhances its gravimetric hydrogen uptake and the metal bond strength. The resulting cationized complex then adsorbs two additional H2 molecules than the neutral complex. In addition, we elucidated the effect of exchange and correlation functionals in DFT on H2 adsorption energy of these complexes. Molecular dynamics simulations were also carried out to confirm whether the complex adsorbs H2 molecules at a finite temperature. The H2 uptake capacity of a complex from simulations is the same as that from the geometry optimization only if the H2 adsorption was energetically favourable i.e. with the positive Gibbs free corrected H2 adsorption energy.
Introduction
Hydrogen storage is one of the important issues for the advancement of hydrogen and fuel cell power technologies in transportation, stationary, and portable applications. There are different ways of storing hydrogen such as physisorption in carbon nanotubes, storage in metal hydrides, storage in high pressure cylinders, storage as liquid hydrogen etc; each with positive and negative sides. Various ways are being adopted to discover novel materials, satisfying all the US Department of Energy (DOE) targets.1 The suggestion and study of theoretical models which predict the maximum hydrogen capacity, is one of over-arching research and development for all advanced materials. An increase in computational power in recent years has opened up new possibilities for theoretical studies of hydrogen storage.Carbon nanostructures such as carbon nanotubes2–5 and buckyballs6–9 are among the most widely investigated materials for hydrogen storage. Binding energies of hydrogen molecules to naked carbon structures are lower, and lie in the physisorption range. These theoretical binding energies have to be increased. The usual approach to overcome this problem is doping nanomaterials with metals, making sure the selection of metal gives a light weight material and captures as much hydrogen as possible. The interaction between the hydrogen molecules and metal atoms deposited on a surface of substrate can be electrostatic, chemisorption or of Kubas type.10–13 Recently, it has been seen that there is an excellent agreement between experiments and theoretical calculations for hydrogen storage and other properties for this type of metal decorated organic compounds.14–16
It is desirable that adsorption and desorption of H2 molecules should occur at or somewhat above room temperature. As H2 is the simplest light weight diatomic molecule, careful calculations of H2 containing systems is required. Thermochemistry calculations can help us to judge the accurate evaluation of Gibbs corrected H2 adsorption energy of such systems containing H2 molecules, as there is a considerable energy contribution due to translational and rotational motion of H2 in gas phase.
In this paper, we explain the hydrogen storage enhancement capability of a Ti2–C2H4 material by means of controlling its charge-state. Gibbs corrected adsorption energy helps to determine whether a complex is energetically favourable or not over a selected temperature range. We have performed ab initio molecular dynamics simulations to verify hydrogen uptake capacity of neutral as well as charged Ti2–C2H4 organometallic material at different temperatures from geometry optimizationm.
Computational details
The geometry optimization of hydrogen adsorbed Ti2–C2H4 and its cation complex is carried out with the Gaussian 03 suite of programs.17 The valence double-ζ and polarization functions (6–31G(d,p)) is used as a basis set of Ti, C, and H atoms. The thermostatic ab initio molecular dynamic (MD) simulations are carried out using atom-centred density matrix propagation (ADMP)18–22 starting with optimized geometry using exchange and correlation functionals viz. Perdew–Burke–Ernzerhof (PBEPBE).23 The time step of ADMP-MD is set at 0.2 fs. The desired temperature of a (neutral as well as charged) molecule is obtained by repeated scaling of nuclear velocities during entire MD simulations time of 1 ps. Maximum allowed deviation from nuclear velocities is of 1 K from desired temperature during MD simulations.Results and discussion
In the first step, we optimized geometry of a Ti2–C2H4 complex and found that a maximum of ten hydrogen molecules (five on each Ti atom site) can be adsorbed on it (Fig. 1(a)), giving it a hydrogen uptake of ∼14 wt% using PBEPBE level of theory. We then considered H2 adsorption on Ti2–C2H4+ complex. In an induced ionization process, the number of electrons gets reduced in a complex. The vacant d-orbital of Ti in Ti2–C2H4+ complex is responsible for the adsorption of an additional two H2 molecules (a H2 molecule on each Ti). Thus, a maximum of twelve hydrogen molecules can be bound to Ti2–C2H4+ complex by means of controlling its charged-state as shown in Fig. 1(b). This indicates that the ionic process enhances its hydrogen uptake capacity by about 2 wt%. The dynamic stability of these geometries is confirmed by frequency calculations, and it was found that there is no imaginary frequency. We also performed calculations at higher spin-state (triplet for neutral and quartet for charged) for these complexes, and found that geometries have imaginary frequencies. This means that optimized geometries at higher spin-state were not the local minimum of the potential energy surface.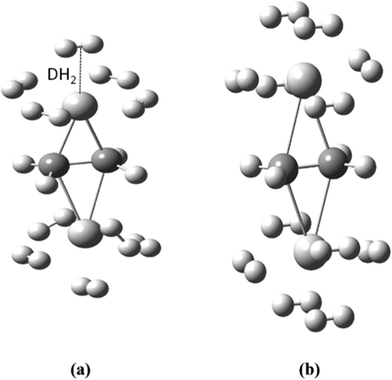 | ||
| Fig. 1 Optimized geometries of (a) Ti2–C2H4–10H2 and (b) Ti2–C2H4+–12H2 complexes using PBEPBE/6-31G(d,p) level of theory. | ||
We first investigated the H2 adsorption energy for H2 adsorbed Ti2–C2H4 and Ti2–C2H4+ complexes. The averaged adsorption energy (ΔEa) for maximum ‘n’ number of H2 adsorbed Ti2–C2H4 complexes is calculated as,
| ΔEa = {E[X] + nE[H2] − E[X(H2)n]}/n |
| ΔGa = {G[X] + nG[H2] − G[X(H2)n]}/n |
Here, E[X] is the total energy of a complex X, G[X] stands for the total energy of a complex X with Gibbs free energy correction. The G[X] and Gibbs free energy correction Gcorr[X] are given as,
| G[X] = E[X] + Gcorr[X] |
| Gcorr[X] = Ezpe[X] + Ethm[X] +kBT − TS[X] |
Here, Ezpe[X] is the zero-point energy, Ethm[X] is the energy due to sum of translational, rotational and vibrational motion of X, kB is the Boltzmann's constant, and S[X] is the sum of entropy for translational, rotational and vibrational motion of X. Similarly, ΔEa+ and ΔGa+ can be calculated for Ti2–C2H4+ complex. The averaged H2 adsorption energy without (with) Gibbs free energy correction at room temperature is 0.64 (0.20) and 0.46 (−0.01) eV/H2 in Ti2–C2H4–10H2 and Ti2–C2H4+–12H2 complex, respectively, at PBEPBE/6–31G(d,p) level of theory. The negative and positive values of ΔG and ΔH, respectively, indicate that the adsorption process is spontaneous and endothermic in nature. We calculated H2 adsorption energy at different temperatures which provides the temperature range for which H2 adsorption on a complex is energetically favourable, and is shown in Fig. 2.
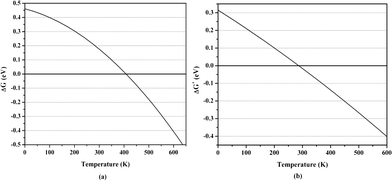 | ||
| Fig. 2 Calculated averaged H2 adsorption energy for (a) Ti2–C2H4–10H2 and (b) Ti2–C2H4+–12H2 complex including Gibbs free energy correction at PBEPBE/6–31G(d,p) level as a function of temperature at pressure = 1 bar. | ||
We also carried out calculations using different methods in addition to PBEPBE method. Table 1 gives the averaged adsorption energy for Ti2–C2H4–10H2 and Ti2–C2H4+–12H2 complex, obtained using MP2 and DFT with different exchange and correlation functionals such as Generalized Gradient Approximation (PBEPBE23 and BLYP24,25), two hybrid-functionals (B3LYP26 and PBE1PBE27). The BLYP and B3LYP exchange and correlation functionals give energy of a system that includes Hartree-Fock (HF) exchange contribution. Okamato suggested that the more HF contribution, the lower the averaged adsorption energy.28 This is also true in the case of PBEPBE and PBE1PBE. Table 1 shows that averaged adsorption energy depends on the method used. The energy trend for the H2 adsorption on organometallic complex is in good agreement with that observed earlier.28–31 It is worthy to note that Van der Waal interaction is included in MP2, and not to be expected in the DFT method. Table 1 indicates that Van der Waal interaction does not play much of a role in the adsorption of H2 on both Ti2–C2H4 and Ti2–C2H4+ complex which is the same when compared to that observed in previous work.28 However, it is quite different from H2 adsorption on nanocarbon fragment.29
Next, we performed Mulliken charge analysis and natural population analysis. A plot of Mulliken charge on Ti atom versus averaged Gibbs corrected H2 adsorption energy is shown in Fig. 3(a) and 3(b) for Ti2–C2H4–10H2 and Ti2–C2H4+–12H2 complex, respectively, using four different exchange and correlation functionals viz. BLYP, B3LYP, PBEPBE and PBE1PBE in DFT and MP2. There is a linear relation between them as can be seen in Fig. 3(a) and 3(b). The Mulliken charge on Ti atom obtained using PBEPBE and PBE1PBE methods indicates that negative charge is transferred from C atoms to Ti atoms in the Ti2–C2H4+–12H2 complex. Thus, increasing the electron density of Ti atom contributes attractive interactions between H2 molecules and Ti-atom in a complex. This relationship is in agreement with the earlier results.28–31 Natural population analysis shows that the total of about one electron is transferred from each Ti atom to the C2H4 substrate in Ti2–C2H4 complex whereas total of about two electrons from each Ti atom to C2H4+ template in Ti2–C2H4+ complex, using PBEPBE level of theory. Thus, enhancement in H2 uptake of Ti2–C2H4 complex upon ionization can be observed due to more valence electron transfer from Ti atoms to charged substrate and increase in the metal bond strength.
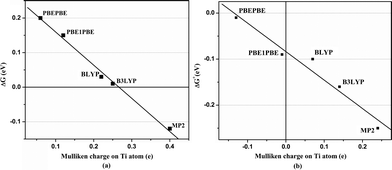 | ||
| Fig. 3 Mulliken atomic charge on Ti atom versus Gibbs corrected averaged H2 adsorption energy for (a) Ti2–C2H4–10H2 and (b) Ti2–C2H4+–12H2 complexes. | ||
Furthermore, we performed ADMP-MD simulations to verify the hydrogen uptake capacity of Ti2–C2H4 and Ti2–C2H4+ complexes at different temperatures. The distance between the centre of mass of H2 molecule and Ti atom is denoted by DH2 as shown in Fig. 1(a). We obtained the DH2 trajectories with evolution of time, in both Ti2–C2H4–10H2 and Ti2–C2H4+–12H2 complex. ADMP-MD is carried out using PBEPBE method, since using this method, the H2 adsorption is energetically favourable for a wider range of temperatures than other methods used for calculations.28 The ADMP-MD simulations are started from the optimized geometry using the same method. Fig. 4 shows time evolution of DH2 at T = 300 K in Ti2–C2H4–10H2 complex. It can be seen that all ten H2 molecules in initial geometry do remain adsorbed on the complex within 1 ps of simulations. The DH2 of these H2 molecules oscillate around 1.9 Å. We also performed ADMP-MD simulations at T = 400 K where H2 adsorption in a complex is energetically unfavourable as per Fig. 2. A snapshot at 0.4 ps (Fig. 5) reveals that out of ten H2 adsorbed molecules in initial geometry, seven remain adsorbed on the distorted geometry of Ti2–C2H4 complex, some of them adsorbed dissociatively, and remaining desorbed from the complex. This shows the successive desorption of H2 molecules. Thus, desorption of H2 molecules can be made by means of the raise in temperature.
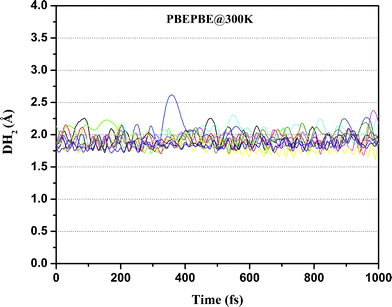 | ||
| Fig. 4 Trajectories of DH2 in Ti2–C2H4–10H2 complex at T = 300 K obtained using ADMP-MD simulations with PBEPBE method. | ||
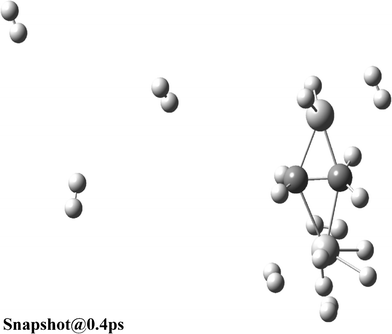 | ||
| Fig. 5 Snapshot of Ti2–C2H4–10H2 complex at 0.4 ps and T = 400 K obtained using ADMP-MD simulations with PBEPBE method. | ||
We then performed ADMP-MD simulations to confirm whether ionization enhances H2 uptake capacity of Ti2–C2H4 complex as predicted by geometry optimization. We examined the DH2 trajectories in Ti2–C2H4+–12H2 complex at T = 300 K with evolution of time. Fig. 2 shows that H2 adsorption in Ti2–C2H4+–12H2 complex is not energetically favourable at room temperature. Snapshot of Ti2–C2H4+–12H2 complex has been taken at 0.6 ps during simulations, using PBEPBE level of theory as shown in Fig. 6. From Fig. 6, it can be seen that out of twelve H2 molecules in initial geometry, eight H2 molecules remain bound to Ti2–C2H4+ complex. Fig. 2 shows that H2 adsorption on Ti2–C2H4+ complex is energetically favourable below ∼T = 270 K, using PBEPBE level of theory. To confirm this, we carried out ADMP-MD simulations by lowering temperature where H2 adsorption on Ti2–C2H4+ is energetically favourable. In Fig. 7, ADMP-MD simulations at T = 200 K reveal that all the twelve H2 molecules remain adsorbed on a complex, and oscillate at distance of around 1.8 Å from Ti atom within 1 ps as can be seen from Fig. 7. Thus, simulations reveal that not a single H2 molecule desorbed from the metal decorated complex during molecular dynamics simulations of 1 ps.
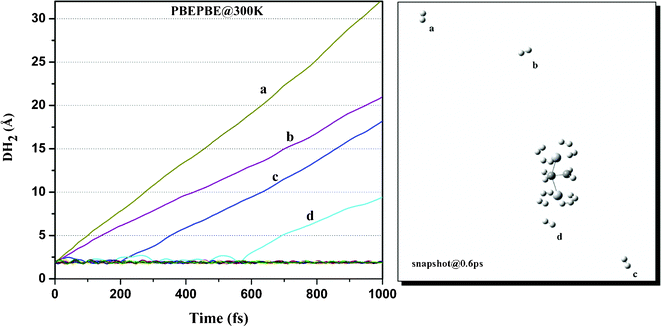 | ||
| Fig. 6 Trajectories of DH2 in Ti2–C2H4+–12H2 complex at T = 300 K obtained using ADMP-MD simulations with PBEPBE method. | ||
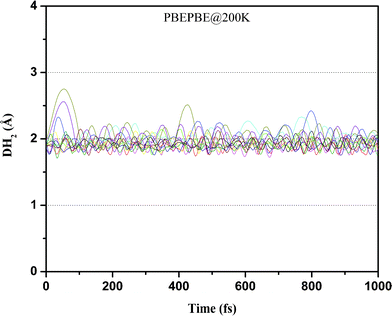 | ||
| Fig. 7 Trajectories of DH2 in Ti2–C2H4+–12H2 complex at T = 200 K obtained using ADMP-MD simulations with PBEPBE method. | ||
Conclusions
First-principle calculations show that a maximum of ten H2 molecules can be adsorbed on Ti2–C2H4 complex. H2 uptake capacity is found to be enhanced by means of controlling its charge-state. We have shown that Ti2–C2H4+ can store up to 16 wt% of hydrogen. This enhancement in H2 uptake of Ti2–C2H4 complex upon ionization is observed due to more valence electron transfer from Ti atom to charged substrate. Adsorption energy is remarkably affected by the exchange and correlation functionals employed in DFT. During ADMP-MD simulations with PBE functional, all the adsorbed H2 molecules in initial geometry, remain bound to the complex over the temperature range for which H2 adsorption is found to be energetically favourable, in both Ti2–C2H4–10H2 and Ti2–C2H4+–12H2 complex. On the other hand, H2 molecules are found to be desorbed if H2 adsorption is not energetically favourable. Aspects of controlling charge-state on such systems with complex clustering may lead to findings that its different aggregation behaviour can enhance hydrogen uptake more than the neutral system. It would be interesting to consider the effect of metal atom clustering on hydrogen uptake capacity in such systems. The work towards this direction is in progress in our laboratory.Acknowledgements
The financial support from CSIR, New Delhi (Grant No. 03(1115)/08/EMR-II) is gratefully acknowledged. We thank C-DAC, Pune, (Maharashtra) India for providing the high performance computing facility. We also thank to Swami Ramanand Teerth Marthwada University, Nanded. Vijayanand Kalamse is supported by University sponsored research fellowship.References
- http://www.eere.energy.gov/hydrogenandfuelcells/mypp/ .
- P. Chen, X. Wu, J. Lin and K. L. Tan, Science, 1999, 285, 91 CrossRef CAS.
- C. Liu, Y. Y. Fan, M. Liu, H. T. Cong, H. M. Cheng and M. S. Dresselhaus, Science, 1999, 286, 1127 CrossRef CAS.
- R. Yang, Carbon, 2000, 38, 623 CrossRef CAS.
- E. Lee, Y. Kim, Y. Jin and K. Chang, Phys. Rev. B, 2002, 66, 73415 CrossRef.
- Y. H. Kim, Y. Zhao, A. Williamson, M. J. Heben and S. B. Zhang, Phys. Rev. Lett., 2006, 96, 16102 CrossRef.
- Q. Sun, P. Jena, Q. Wang and M. Marquez, J. Am. Chem. Soc., 2006, 128, 9741 CrossRef CAS.
- K. R. S. Chandrakumar and S. K. Ghosh, Nano Lett., 2008, 8, 13 CrossRef CAS.
- Q. Sun, Q. Wang and P. Jena, Appl. Phys. Lett., 2009, 94, 013111 CrossRef.
- J. Niu, B. K. Rao and P. Jena, Phys. Rev. Lett., 1992, 68, 2277 CrossRef CAS.
- L. Gagliardi and P. Pykko, J. Am. Chem. Soc., 2004, 126, 15014 CrossRef CAS.
- R. C.Lochan and M. Head-Gordon, Phys. Chem. Chem. Phys., 2006, 8, 1357 RSC.
- E. Durgun, S. Ciraci, W. Zhou and T. Yildirim, Phys. Rev. Lett., 2006, 97, 226102 CrossRef CAS.
- N. Wadnerkar, V. Kalamse and A. Chaudhari, Theo. Chem. Acc., 2010, 127, 285 CrossRef CAS.
- N. Wadnerkar, V. Kalamse, A. B. Phillips, B. S. Shivaram and A. Chaudhari, Int. J. Hydrogen Energy, 2011, 36, 9727 CrossRef CAS.
- C. S. Liu and Z. Zeng, Phys. Rev. B., 2009, 79, 245419 CrossRef.
- M. J. Frisch, G. W. Trucks, H. B. Schlegel, G. E. Scuseria, M. A. Robb, J. R. Cheeseman, J. A. Montgomery, Jr.,T. Vreven, K. N. Kudin, J. C. Burant, J. M. Millam, S. S. Iyengar, J. Tomasi, V. Barone, B. Mennucci, M. Cossi, G. Scalmani, N. Rega, G. A. Petersson, H. Nakatsuji, M. Hada, M. Ehara, K. Toyota, R. Fukuda, J. Hasegawa, M. Ishida, T. Nakajima, Y. Honda, O. Kitao, H. Nakai, M. Klene, X. Li, J. E. Knox, H. P. Hratchian, J. B. Cross, V. Bakken, C. Adamo, J. Jaramillo, R. Gomperts, R. E. Stratmann, O. Yazyev, A. J. Austin, R. Cammi, C. Pomelli, J. W. Ochterski, P. Y. Ayala, K. Morokuma, G. A. Voth, P. Salvador, J. J. Dannenberg, V. G. Zakrzewski, S. Dapprich, A. D. Daniels, M. C. Strain, O. Farkas, D. K. Malick, A. D. Rabuck, K. Raghavachari, J. B. Foresman, J. V. Ortiz, Q. Cui, A. G. Baboul, S. Clifford, J. Cioslowski, B. B. Stefanov, G. Liu, A. Liashenko, P. Piskorz, I. Komaromi, R. L. Martin, D. J. Fox, T. Keith, M. A. Al-Laham, C. Y. Peng, A. Nanayakkara, M. Challacombe, P. M. W. Gill, B. Johnson, W. Chen, M. W. Wong, C. Gonzalez and J. A. Pople, Gaussian 03, Revision D.01, Gaussian, Inc., Wallingford CT, 2004 Search PubMed.
- H. B. Schlegel, J. M. Millam, S. S. Iyengar, G. A. Voth, A. D. Daniels, G. E. Scuseria and M. J. Frisch, J. Chem. Phys., 2001, 114, 9758 CrossRef CAS.
- S. S. Iyengar, H. B. Schlegel, J. M. Millam, G. A. Voth, G. E. Scuseria and M. J. Frisch, J. Chem. Phys., 2001, 115, 10291 CrossRef CAS.
- H. B. Schlegel, S. S. Iyengar, X. Li, J. M. Millam, G. A. Voth, G. E. Scuseria and M. J. Frisch, J. Chem. Phys., 2002, 117, 8694 CrossRef CAS.
- S. S. Iyengar, H. B. Schlegel, J. M. Millam, G. A. Voth, G. E. Scuseria and M. J. Frisch, Israel J. Chem., 2002, 7, 191 CrossRef.
- S. S. Iyengar and M. J. Frisch, J. Chem. Phys., 2004, 121, 5061 CrossRef CAS.
- J. P. Perdew, K. Burke and M. Ernzerhof, Phys. Rev. Lett., 1996, 77, 3865 CrossRef CAS.
- A. D. Becke, Phys. Rev. A, 1988, 38, 3098 CrossRef CAS.
- C. Lee, W. Yang and R. G. Parr, Phys. Rev., 1988, B 37, 785 Search PubMed.
- A. D. Becke, J. Chem. Phys., 1993, 98, 5648 CrossRef CAS.
- J. P. Perdew, K. Burke and M. Ernzerhof, Phys. Rev. Lett., 1997, 78, 1396 CrossRef CAS.
- Y. Okamoto, J. Phys. Chem. C, 2008, 112, 17721 CAS.
- Y. Okamoto and Y. Miyamoto, J. Phys. Chem. B, 2001, 105, 3470 CrossRef CAS.
- N. Wadnerkar, V. Kalamse and A. Chaudhari, Int. J. Hydrogen Energy, 2011, 36, 664 CrossRef CAS.
- N. Wadnerkar, V. Kalamse and A. Chaudhari, J. Comp. Chem., 2011, 33, 170 CrossRef.
| This journal is © The Royal Society of Chemistry 2012 |
