One-step synthesis of SnO2–reduced graphene oxide–carbon nanotube composites via microwave assistance for lithium ion batteries
Taiqiang
Chen
,
Likun
Pan
*,
Xinjiuan
Liu
,
Kai
Yu
and
Zhuo
Sun
Engineering Research Center for Nanophotonics & Advanced Instrument, Ministry of Education, Department of Physics, East China Normal University, Shanghai, 200062, China. E-mail: lkpan@phy.ecnu.edu.cn; Fax: +86 21 62234321; Tel: +86 21 62234132
First published on 3rd October 2012
Abstract
A facile one-step microwave-assisted method was developed to fabricate SnO2–reduced graphene oxide (RGO)–carbon nanotube (CNT) composites. The as-prepared composites were applied as anode materials for lithium ion batteries and it is found that RGO and CNTs play an important role in the enhancement of the electrochemical performance due to a synergistic effect of SnO2, RGO and CNTs, in which RGO sheets support SnO2 nanoparticles and CNTs act as wires conductively connecting the large RGO sheets together. A SnO2–RGO–CNT composite with 60 wt.% SnO2 achieves a maximum capacity of 502 mA h g−1 after 50 cycles at 100 mA g−1 and even at a high current density of 1000 mA g−1, a capacity of 344 mA h g−1 is maintained.
1. Introduction
Lithium ion batteries (LIBs) have attracted considerable attention and represent a key class of battery architecture that has emerged as a promising candidate for energy storage devices due to their high energy capacity and long cycle lifetime.1–4 In LIBs, the energy capacity strongly depends on the properties of the electrode materials. Owing to its high theoretical specific capacity of 782 mA h g−1, SnO2 has attracted intensive research interest as a promising alternative anode material for LIBs.5–7 However, the practical application of SnO2 is hindered by the severe capacity fading upon repeated charge–discharge cycles stemming from huge volume changes (over 200%) during the Li insertion and extraction processes, which leads to pulverization of the electrode and electrical disconnection of the active materials. Currently a particularly attractive option is to design and develop composite materials based on SnO2 to solve this problem.Carbon based materials, such as carbon nanofibers8,9 and carbon nanotubes (CNTs),10,11 have been reported as hybrid components to be incorporated into SnO2 due to their low cost, superior chemical stability, and good conductivity. These carbon materials possess the properties of both flexibility and electrical conductivity, which enable them to not only act as a buffer to accommodate volume changes but also improve the electrical conductivity, and thus they can enhance the electrochemical performance of SnO2. Recently, graphene, a rising star in the carbon family, has been proposed as an ideal matrix for various composites used in LIBs because of its excellent electronic properties, superior chemical stability and high specific surface area.12–14 Many studies have been reported to employ SnO2–graphene composites as electrodes of LIBs.15–17 In a typical fabricating process, SnO2 nanoparticles are grown on graphene oxide (GO) sheets and in the meantime GO is chemically reduced to obtain graphene (normally called reduced graphene oxide (RGO)). This method takes advantage of the functional groups on the surface of GO, which could anchor the SnO2 particles to achieve a uniform deposition and a better adhesion.14 However, it should be noted that in this method, incomplete chemical reduction of GO is frequently observed,18–21 which causes poor electrical conductivity of graphene.
Current attempts to combine highly conductive CNTs and chemically reduced graphene have been reported in efforts to obtain a hybrid with superior electrochemical, electrical, mechanical or catalytic properties.22–26 Such a significant property enhancement is ascribed to the existence of CNTs, which serve as an electrical conducting network, increase the basal spacing between the graphene sheets and facilitate ionic transportation.27–30 Therefore, the incorporation of CNTs into SnO2–graphene composites to form ternary hybrid materials should be a promising method to design advanced anode materials for LIBs. Recently, Zhang et al. incorporated CNTs into SnO2–graphene to prepare a SnO2–graphene–CNT composite based on an in situ chemical method, which reduced the charge transfer resistance of the anode and delivered a remarkable capacity of 635 mA h g−1 at 250 mA g−1.31 A similar effect of CNT incorporation has also been demonstrated in TiO2–graphene–CNT composites.32 Despite the above progress to date, as promising hybrid materials for LIBs, the exploration of SnO2–RGO–CNT composites is far from complete. Despite being an inexpensive, quick and versatile technique, microwave-assisted reactions are seldom employed to fabricate SnO2–RGO–CNT hybrid composite materials for LIBs, although such a method has been successfully used to synthesize RGO or RGO–metal oxide composites.33–37
In this work, a one-step synthesis of SnO2–RGO–CNT (SGC) composites was carried out through a microwave-assisted reduction of GO dispersion in stannic chloride solution with a CNT suspension using a microwave system. Microwave irradiation can uniformly heat the reactant to a high temperature in a short time by transferring energy selectively to microwave absorbing polar solvents. Thus it can facilitate mass production in a short time with little energy cost38–40 and form an intimate contact between SnO2, RGO and CNTs,41,42 which is crucial for the formation of electronic interaction and interelectron transfer at the interface.26,43 Compared with conventional methods,31 this microwave assisted synthesis is time- and energy-saving and involves no toxic chemicals for the reduction of GO. The as-synthesized SGC composites exhibit an enhanced performance as anode materials for LIBs, as compared with pure SnO2 and SnO2–RGO composites.
2. Experimental
GO was prepared using the method reported in our previous work.44,45 Multi-walled CNTs were purchased from Nanotech Port Co., Ltd. (Shenzhen, China) with detailed specifications as follows: length (5–15 μm), diameter (20–40 nm) and purity (≥98%). In order to enhance the solubility, multi-walled CNTs were refluxed in a mixture of concentrated nitric acid and concentrated sulfuric acid (volume ratio 3![[thin space (1/6-em)]](https://www.rsc.org/images/entities/char_2009.gif) :
:![[thin space (1/6-em)]](https://www.rsc.org/images/entities/char_2009.gif) 1) to activate the surface with oxygen functionalities. 0.4 g GO, 0.1 g CNTs and a certain amount of SnCl4·5H2O were dispersed in 250 ml aqueous solution using magnetic stirring and ultrasonic treatment to form a homogeneous mixture. Subsequently, 20 ml of the mixture was sealed in a 35 ml microwave tube and heated at 150 °C with a microwave irradiation power of 100 W for 10 min using a microwave system (Explorer48, CEM Co.). The resultant precipitate was filtered, washed with deionized water and finally dried in a vacuum oven at 80 °C for 24 h. In this work, SGC composites with 40, 60 and 80 wt.% SnO2 were prepared, respectively. Pure SnO2, RGO–CNTs (GC, the same GO
1) to activate the surface with oxygen functionalities. 0.4 g GO, 0.1 g CNTs and a certain amount of SnCl4·5H2O were dispersed in 250 ml aqueous solution using magnetic stirring and ultrasonic treatment to form a homogeneous mixture. Subsequently, 20 ml of the mixture was sealed in a 35 ml microwave tube and heated at 150 °C with a microwave irradiation power of 100 W for 10 min using a microwave system (Explorer48, CEM Co.). The resultant precipitate was filtered, washed with deionized water and finally dried in a vacuum oven at 80 °C for 24 h. In this work, SGC composites with 40, 60 and 80 wt.% SnO2 were prepared, respectively. Pure SnO2, RGO–CNTs (GC, the same GO![[thin space (1/6-em)]](https://www.rsc.org/images/entities/char_2009.gif) :
:![[thin space (1/6-em)]](https://www.rsc.org/images/entities/char_2009.gif) CNTs weight ratio of 4
CNTs weight ratio of 4![[thin space (1/6-em)]](https://www.rsc.org/images/entities/char_2009.gif) :
:![[thin space (1/6-em)]](https://www.rsc.org/images/entities/char_2009.gif) 1 during preparation as that for SGC), and SnO2–RGO (SG) with 60 wt.% SnO2 were also synthesized by a direct microwave assisted reaction for comparison. As described in our previous work, most of the GO can be reduced to RGO under microwave irradiation and the obtained RGO has a C/O ratio of ∼9.12, which is close to the value (∼10) of that achieved by the hydrazine reduction method.46
1 during preparation as that for SGC), and SnO2–RGO (SG) with 60 wt.% SnO2 were also synthesized by a direct microwave assisted reaction for comparison. As described in our previous work, most of the GO can be reduced to RGO under microwave irradiation and the obtained RGO has a C/O ratio of ∼9.12, which is close to the value (∼10) of that achieved by the hydrazine reduction method.46
The structure and morphology of the as synthesized composites were characterized by X-ray diffraction (XRD, Holland Panalytical PRO PW3040/60) with Cu-Kα radiation (V = 30 kV, I = 25 mA), field-emission scanning electron microscopy (FESEM, Hitachi S-4800), and high-resolution transmission electron microscopy (HRTEM, JEOL-2010), respectively.
For electrochemical testing, the as synthesized composites, Super-P carbon black and polyvinyldifluoride (PVDF), with a weight ratio of 80![[thin space (1/6-em)]](https://www.rsc.org/images/entities/char_2009.gif) :
:![[thin space (1/6-em)]](https://www.rsc.org/images/entities/char_2009.gif) 10
10![[thin space (1/6-em)]](https://www.rsc.org/images/entities/char_2009.gif) :
:![[thin space (1/6-em)]](https://www.rsc.org/images/entities/char_2009.gif) 10, were homogenously mixed in N-methylpyrrolidone (NMP) solvent to produce a slurry. Then, the resultant slurries were coated on a copper foil using a doctor blading method. Finally, these electrodes were dried at 120 °C under vacuum for 12 h and pressed under a pressure of ∼1 MPa. Coin-type cells (CR2032) were assembled in a glove box (MB-10-compact, MBRAUN) under an argon atmosphere with oxygen and water of less than 0.5 ppm, using lithium metal foil as the counter and reference electrode. A Celgard 2320 membrane and 1 M LiPF6 electrolyte solution dissolved in a mixture of ethylene carbonate, dimethyl carbonate and ethyl methyl carbonate (1
10, were homogenously mixed in N-methylpyrrolidone (NMP) solvent to produce a slurry. Then, the resultant slurries were coated on a copper foil using a doctor blading method. Finally, these electrodes were dried at 120 °C under vacuum for 12 h and pressed under a pressure of ∼1 MPa. Coin-type cells (CR2032) were assembled in a glove box (MB-10-compact, MBRAUN) under an argon atmosphere with oxygen and water of less than 0.5 ppm, using lithium metal foil as the counter and reference electrode. A Celgard 2320 membrane and 1 M LiPF6 electrolyte solution dissolved in a mixture of ethylene carbonate, dimethyl carbonate and ethyl methyl carbonate (1![[thin space (1/6-em)]](https://www.rsc.org/images/entities/char_2009.gif) :
:![[thin space (1/6-em)]](https://www.rsc.org/images/entities/char_2009.gif) 1
1![[thin space (1/6-em)]](https://www.rsc.org/images/entities/char_2009.gif) :
:![[thin space (1/6-em)]](https://www.rsc.org/images/entities/char_2009.gif) 1 w/w) were used as separator and electrolyte, respectively. Galvanostatic charge–discharge cycles were performed using a LAND2001A battery test system in the voltage range 0.005–3 V. Cyclic voltammetry (CV) was performed using an electrochemical workstation (AUTOLAB PGSTAT302N) between the voltage range 0.005–3 V at a scan rate of 0.5 mV s−1. After 50 galvanostatic charge–discharge cycles, electrochemical impedance spectroscopy (EIS) measurements were performed on the same electrochemical workstation in the frequency range 0.1 Hz–100 kHz, and the applied bias voltage and a.c. amplitude were set at an open-circuit voltage of the cells and 10 mV between the counter electrode and the working electrode, respectively.
1 w/w) were used as separator and electrolyte, respectively. Galvanostatic charge–discharge cycles were performed using a LAND2001A battery test system in the voltage range 0.005–3 V. Cyclic voltammetry (CV) was performed using an electrochemical workstation (AUTOLAB PGSTAT302N) between the voltage range 0.005–3 V at a scan rate of 0.5 mV s−1. After 50 galvanostatic charge–discharge cycles, electrochemical impedance spectroscopy (EIS) measurements were performed on the same electrochemical workstation in the frequency range 0.1 Hz–100 kHz, and the applied bias voltage and a.c. amplitude were set at an open-circuit voltage of the cells and 10 mV between the counter electrode and the working electrode, respectively.
3. Results and discussion
The XRD patterns of the as-prepared SnO2 and the SGC composite with 60 wt.% SnO2 are shown in Fig. 1. All the peaks in the SnO2 pattern are assigned to the cassiterite tetragonal crystalline phase (JCPDS 41-1445). In the pattern of the SGC composite, a new weak peak at ∼42.5° is detected, which is attributed to C(100) of graphitic carbon, indicating the existence of CNTs or RGO.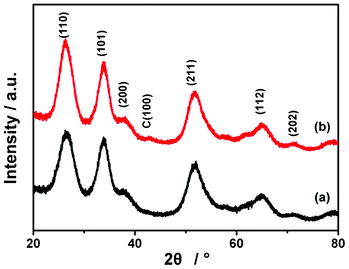 | ||
| Fig. 1 XRD patterns of (a) SnO2 and (b) SGC composite with 60 wt.% SnO2. | ||
The FESEM images of pure SnO2, SG and SGC with 60 wt.% SnO2 are shown in Fig. 2(a)–(c). It is clearly observed from Fig. 2(a) that small SnO2 nanoparticles aggregate into large particles. However, when RGO is introduced, SnO2 nanoparticles are uniformly anchored on wrinkled and folded RGO sheets in the SG composite, as shown in Fig. 2(b). From Fig. 2(c), it can be seen that in the SGC composite, CNTs are scattered on the surfaces of the RGO sheets decorated by SnO2 nanoparticles.
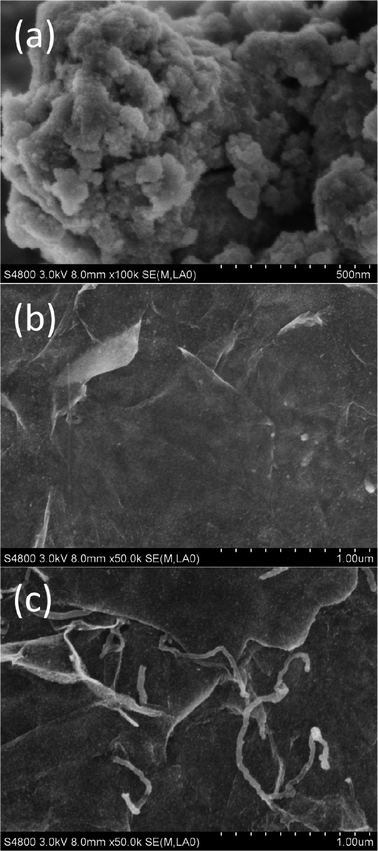 | ||
| Fig. 2 FESEM images of (a) pure SnO2, (b) SG and (c) SGC with 60 wt.% SnO2. | ||
Fig. 3(a)–(c) show the low-magnification and high-magnification HRTEM images of the SGC composite with 60 wt.% SnO2. It can be observed that RGO sheets retain the two-dimensional sheet structure with wrinkles and SnO2 nanoparticles with diameters of 3–5 nm are densely attached to the RGO sheets. The long CNT wires with outer diameters of 20–40 nm weave between RGO and SnO2 nanoparticles and bridge the gaps between different RGO sheets to build a network. It can be indicated that a good contact between SnO2, RGO and CNTs is formed by the microwave-assisted reaction, which favors electron transfer between them.26
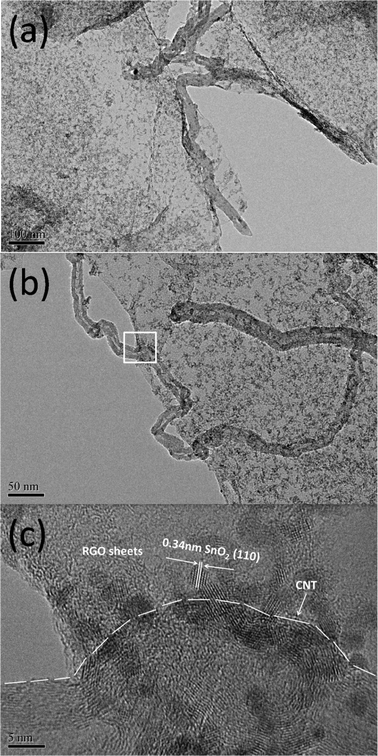 | ||
| Fig. 3 (a) and (b) Low-magnification HRTEM images of the SGC composite with 60 wt.% SnO2; (c) high-magnification image of the white pane area in (b). | ||
Tap densities of SGC composites with different SnO2 contents were determined referring to China National Standard GB/T 21354-2008/ISO 3953: 1993 (Powders-Determination of tap density) to evaluate the packing of the composites and the results are displayed in Fig. 4. It is found that the tap density of the SGC composite increases as the SnO2 content increases. A tap density of 0.83 g cm−3 is tested for the SGC composite with 60 wt.% SnO2, which is close to the value for commercially used graphite (∼1.0 g cm−3).
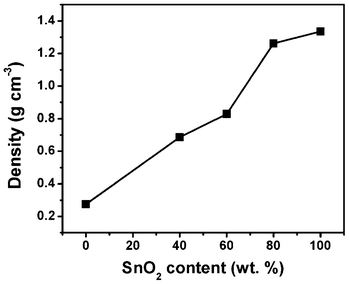 | ||
| Fig. 4 Tap density of SGC composites with different SnO2 contents. | ||
The electrochemical behavior of the as-prepared composites was evaluated by cyclic voltammetry analysis. Fig. 5(a) shows the CV curves of SG and SGC with 60 wt.% SnO2 in the 3rd scanning cycle. Two characteristic redox pairs are identified at a potential of (0.01, 0.6 V) and (1.0, 1.3 V), which are generally consistent with that reported previously.47,48 In SnO2 based LIBs, two electrochemical processes occur as described in eqn (1) and (2). The first redox pair at (0.01, 0.6 V) can be attributed to the highly reversible alloying–dealloying processes (eqn (2)). The reduction peak at 1.0 V may be ascribed to the formation of the solid electrolyte interphase (SEI), and the reduction of SnO2 to Sn and Li2O nanocomposite.49,50 The oxidation peak around 1.3 V is most likely due to the partly reversible reaction of eqn (1).17,50 As compared with the SG composite, the current density of the SGC composite is higher, implying that the introduction of CNTs enhances the activity of the composite. The first and second charge–discharge curves of the SGC composite with 60 wt.% SnO2 are demonstrated in Fig. 5(b). Two plateaus at 0.6 and 1.3 V are observed in the charging process, matching well with CV analysis. The first discharge capacity and initial reversible capacity are 1043 and 587 mA h g−1, respectively.
| SnO2 + 4Li+ + 4e− → Sn + 2Li2O | (1) |
| Sn + xLi+ + xe− ↔ LixSn (0 ≤ x ≤ 4.4) | (2) |
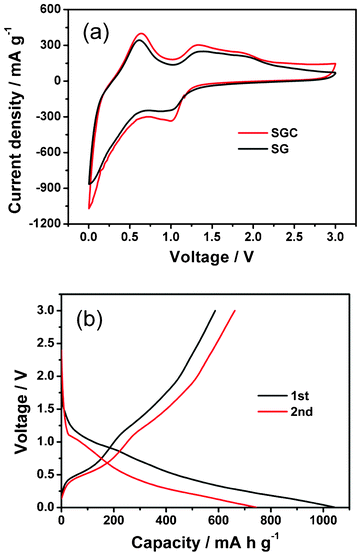 | ||
| Fig. 5 (a) CV curves of SG and SGC with 60 wt.% SnO2 and (b) first and second charge–discharge curves of SGC with 60 wt.% SnO2 at a galvanostatic charge–discharge current density of 100 mA g−1. | ||
Fig. 6 shows a comparison of charge–discharge cycle performances for the GC composite, pure SnO2 and SGC composites with different SnO2 contents. The pure SnO2 exhibits an initial discharge capacity as high as 1005 mA h g−1, but the value rapidly declines to about 100 mA h g−1 after 30 cycles, showing poor cycle stability of pure SnO2. In contrast, the GC composite with a relatively low capacity shows quite good cycle stability except for pronounced capacity fading in the initial several cycles. When pure SnO2 and GC are combined together, the generated SGC composite exhibits improved capacity and cycle performance. It is found that the electrochemical performance of the SGC composite is highly related to the SnO2 content in the composite. With the increase of carbon (RGO and CNT) content, the SGC composite shows improved cycle performance. When the SnO2 content is 60 wt.%, the SGC composite attains its best performance in terms of cyclic stability and capacity retention. The SGC composite with 60 wt.% SnO2 preserves a capacity of 502 mA h g−1 after 50 cycles, which is an 85.5% retention of the initial reversible capacity.
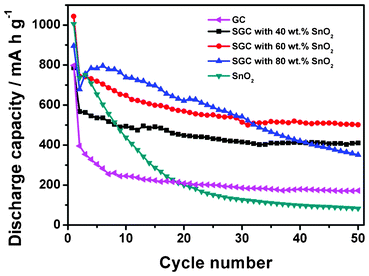 | ||
| Fig. 6 Cycle performances for the GC composite, pure SnO2 and SGC composites with different SnO2 contents. The galvanostatic charge–discharge current density is 100 mA g−1. | ||
To understand the effect of CNTs on the performance of the SGC composite, the SG composite with 60 wt.% SnO2 is tested for comparison as illustrated in Fig. 7. The SG composite exhibits a capacity as high as the SGC composite in the initial 30 cycles. However, the capacity swiftly decreases to 402 mA h g−1 after 50 cycles, which indicates that RGO contributes to the capacity of the composite but not so much to the cycle stability. If RGO and CNTs are combined together into SnO2 to form a ternary composite, an excellent anode material with high capacity and good cycle stability can be obtained. Meanwhile, the introduction of CNTs into the SG composite improves C-rate performance of the composite as displayed in Fig. 8. Even at a high current density of 1000 mA g−1, the SGC composite still preserves a capacity of 344 mA h g−1, while the SG composite only maintains a capacity of 248 mA h g−1. It should be noted that, at 1000 mA g−1, a gradual capacity increase is detected for the SGC composite. A similar phenomenon is also observed in the literature,51 which is possibly related to the electrochemical activation of the SnO2 nanoparticles deeply buried in the three dimensional SGC network structure at a high current density.51
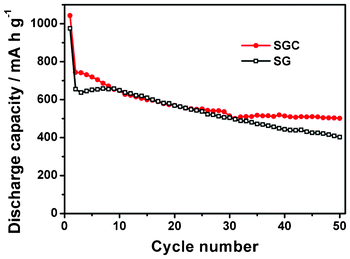 | ||
| Fig. 7 Cycle performance for SG and SGC with 60 wt.% SnO2. The galvanostatic charge–discharge current density is 100 mA g−1. | ||
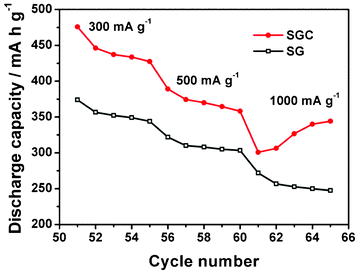 | ||
| Fig. 8 C-Rate performance of SG and SGC composite with 60 wt.% SnO2. The test was conducted after 50 galvanostatic charge–discharge cycles at a current density of 100 mA g−1. | ||
The improved performance of the SGC composite should be attributed to the synergistic effect of SnO2, RGO and CNTs. (i) In the composite, RGO sheets act as a conductive support, on which SnO2 nanoparticles are uniformly anchored. This ensures the electrochemical activity of the SnO2 nanoparticles because of good electron transfer. (ii) CNTs serve as wires conductively connecting the SnO2 nanoparticle decorated RGO sheets, forming a 3D conductive network, in which CNTs can compensate for the poor electrical conductivity of RGO resulting from incomplete chemical reduction and simultaneously provide nanochannels, facilitating the fast and easy transfer of lithium ions.27Fig. 9 displays the Nyquist plots of SG and SGC with 60 wt.% SnO2. The Nyquist plots are fitted and interpreted based on the equivalent electric circuit,52,53 as shown in the inset of Fig. 9. Charge transfer resistance (Rct) represents the kinetic resistance of charge transfer at the electrode–electrolyte interface or the intrinsic charge transfer resistance of porous electrodes.31 The Rct is 22.6 Ω for the SGC composite, lower than 31.0 Ω for the SG composite. This fact confirms that the introduction of CNTs into the SG composite enhances rapid electron transport during the electrochemical reaction, resulting in significant improvement in the electrochemical performances. (iii) Because of the soft and plastic properties54 of the lithiated SnO2 products, the large 2D RGO sheets can easily restrict them in the electrode and the pores formed between RGO and CNTs could buffer the huge volume change of SnO2 during the charge–discharge process. As a result, the integrity of the electrode during the reaction can be maintained. Fig. 10 shows a cross section SEM image of the SGC electrode with 60 wt.% SnO2 after 50 galvanostatic charge–discharge cycles. A thin layer covered on the electrode is the SEI film formed during the electrochemical processes. It can be clearly seen that the SGC electrode tolerates the repeated electrochemical processes and preserves its structure.
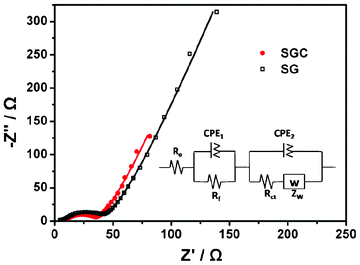 | ||
| Fig. 9 Nyquist plots of SG and SGC composite electrodes with 60 wt.% SnO2. The symbols stand for the experimental data and the corresponding lines are the fitted curves. The inset shows the corresponding equivalent circuit model. Re, Rf, Rct, ZW and CPE denote internal resistance of the test battery, the resistance of the SEI film, charge transfer resistance, Warburg impedance and constant phase element, respectively. | ||
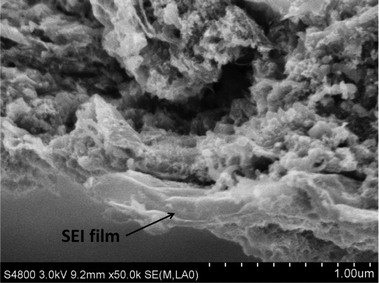 | ||
| Fig. 10 Cross section FESEM image of the SGC electrode with 60 wt.% SnO2 after 50 galvanostatic charge–discharge cycles. | ||
4. Conclusions
In summary, SGC composites were prepared through a facile one-step microwave-assisted method. The performances of the composites with different SnO2 contents were investigated as anode materials in LIBs. The results show that by optimizing the SnO2 content, the SGC composite anode exhibits a high capacity, good cycle stability and excellent C-rate performance due to a synergistic effect of SnO2, RGO and CNTs in which RGO sheets support SnO2 nanoparticles and CNTs act as wires conductively connecting the large RGO sheets. A maximum capacity of 502 mA h g−1 at 100 mA g−1 after 50 cycles has been achieved for the SGC composite with 60 wt.% SnO2. Even at a high current density of 1000 mA g−1, a capacity of 344 mA h g−1 is maintained. The present synthetic strategy should be a promising fabrication technique for the low-cost production of anode materials with high capacity and good cycle stability for LIBs.Acknowledgements
This work was supported by Special Project for Nanotechnology of Shanghai (No. 11 nm0501200).References
- E. J. Yoo, J. Kim, E. Hosono, H. S. Zhou, T. Kudo and I. Honma, Nano Lett., 2008, 8, 2277 CrossRef CAS.
- Z. S. Wu, W. C. Ren, L. Xu, F. Li and H. M. Cheng, ACS Nano, 2011, 5, 5463 CrossRef CAS.
- D. Zhao, Y. Wang and Y. Zhang, Nano-Micro Lett., 2011, 3, 62 CAS.
- J. H. Zhou, H. H. Song, L. L. Ma and X. H. Chen, RSC Adv., 2011, 1, 782 RSC.
- S. M. Paek, E. J. Yoo and I. Honma, Nano Lett., 2008, 9, 72 CrossRef.
- Y. Zhao, J. X. Li, Y. H. Ding and L. H. Guan, RSC Adv., 2011, 1, 852 RSC.
- Z. Yang, G. Du, Q. Meng, Z. Guo, X. Yu, Z. Chen, T. Guo and R. Zeng, RSC Adv., 2011, 1, 1834 RSC.
- L. Ji, Z. Lin, M. Alcoutlabi, O. Toprakci, Y. Yao, G. Xu, S. Li and X. Zhang, RSC Adv., 2012, 2, 192 RSC.
- H.-R. Jung and W.-J. Lee, J. Electroanal. Chem., 2011, 662, 334 CrossRef CAS.
- H. Zhang, H. Song, X. Chen, J. Zhou and H. Zhang, Electrochim. Acta, 2012, 59, 160 CrossRef CAS.
- S. Yang, H. Song, H. Yi, W. Liu, H. Zhang and X. Chen, Electrochim. Acta, 2009, 55, 521 CrossRef CAS.
- M. H. Liang and L. J. Zhi, J. Mater. Chem., 2009, 19, 5871 RSC.
- L. Ji, Z. Lin, M. Alcoutlabi and X. Zhang, Energy Environ. Sci., 2011, 4, 2682 CAS.
- L. S. Zhang, L. Y. Jiang, H. J. Yan, W. D. Wang, W. Wang, W. G. Song, Y. G. Guo and L. J. Wan, J. Mater. Chem., 2010, 20, 5462 RSC.
- J. Liang, W. Wei, D. Zhong, L. Q. Yang, L. D. Li and L. Guo, ACS Appl. Mater. Interfaces, 2012, 4, 454 CAS.
- C. Zhong, J. Z. Wang, Z. Chen and H. K. Liu, J. Phys. Chem. C, 2011, 115, 25115 CAS.
- P. Lian, X. Zhu, S. Liang, Z. Li, W. Yang and H. Wang, Electrochim. Acta, 2011, 56, 4532 CrossRef CAS.
- V. C. Tung, L. M. Chen, M. J. Allen, J. K. Wassei, K. Nelson, R. B. Kaner and Y. Yang, Nano Lett., 2009, 9, 1949 CrossRef CAS.
- D. R. Dreyer, S. Park, C. W. Bielawski and R. S. Ruoff, Chem. Soc. Rev., 2010, 39, 228 RSC.
- W. Cai, R. D. Piner, F. J. Stadermann, S. Park, M. A. Shaibat, Y. Ishii, D. Yang, A. Velamakanni, S. J. An, M. Stoller, J. An, D. Chen and R. S. Ruoff, Science, 2008, 321, 1815 CrossRef CAS.
- T. K. Hong, D. W. Lee, H. J. Choi, H. S. Shin and B. S. Kim, ACS Nano, 2010, 4, 3861 CrossRef CAS.
- D. Y. Cai, M. Song and C. X. Xu, Adv. Mater., 2008, 20, 1706 CrossRef CAS.
- U. Khan, I. O'Connor, Y. K. Gun'ko and J. N. Coleman, Carbon, 2010, 48, 2825 CrossRef CAS.
- T. Lu, L. K. Pan, H. B. Li, C. Y. Nie, M. F. Zhu and Z. Sun, J. Electroanal. Chem., 2011, 661, 270 CrossRef CAS.
- Y. Zou and Y. Wang, ACS Nano, 2011, 5, 8108 CrossRef CAS.
- G. Zhu, L. K. Pan, T. Lu, T. Xu and Z. Sun, J. Mater. Chem., 2011, 21, 14869 RSC.
- Z. J. Fan, J. Yan, T. Wei, G. Q. Ning, L. J. Zhi, J. C. Liu, D. X. Cao, G. L. Wang and F. Wei, ACS Nano, 2011, 5, 2787 CrossRef CAS.
- X. Lu, H. Dou, B. Gao, C. Yuan, S. Yang, L. Hao, L. Shen and X. Zhang, Electrochim. Acta, 2011, 56, 5115 CrossRef CAS.
- Q. Su, Y. Liang, X. Feng and K. Mullen, Chem. Commun., 2010, 46, 8279 RSC.
- S. Q. Chen, P. Chen and Y. Wang, Nanoscale, 2011, 3, 4323 RSC.
- B. Zhang, Q. B. Zheng, Z. D. Huang, S. W. Oh and J. K. Kim, Carbon, 2011, 49, 4524 CrossRef CAS.
- L. Shen, X. Zhang, H. Li, C. Yuan and G. Cao, J. Phys. Chem. Lett., 2011, 2, 3096 CrossRef CAS.
- M. Zhang, D. N. Lei, X. M. Yin, L. B. Chen, Q. H. Li, Y. G. Wang and T. H. Wang, J. Mater. Chem., 2010, 20, 5538 RSC.
- Z. Li, Y. Yao, Z. Lin, K. S. Moon, W. Lin and C. Wong, J. Mater. Chem., 2010, 20, 4781 RSC.
- A. V. Murugan, T. Muraliganth and A. Manthiram, Chem. Mater., 2009, 21, 5004 CrossRef CAS.
- J. Yan, T. Wei, W. Qiao, B. Shao, Q. Zhao, L. Zhang and Z. Fan, Electrochim. Acta, 2010, 55, 6973 CrossRef CAS.
- S. Baek, S. H. Yu, S. K. Park, A. Pucci, C. Marichy, D. C. Lee, Y. E. Sung, Y. Piao and N. Pinna, RSC Adv., 2011, 1, 1687 RSC.
- J. A. Gerbec, D. Magana, A. Washington and G. F. Strouse, J. Am. Chem. Soc., 2005, 127, 15791 CrossRef CAS.
- A. V. Murugan, T. Muraliganth and A. Manthiram, J. Phys. Chem. C, 2008, 112, 14665 CAS.
- Y. Zhu, S. Murali, M. D. Stoller, A. Velamakanni, R. D. Piner and R. S. Ruoff, Carbon, 2010, 48, 2118 CrossRef CAS.
- G. Zhu, L. K. Pan, T. Xu and Z. Sun, ACS Appl. Mater. Interfaces, 2011, 3, 1472 CAS.
- X. J. Liu, L. K. Pan, T. Lv, G. Zhu, Z. Sun and C. Q. Sun, Chem. Commun., 2011, 47, 11984 RSC.
- T. G. Xu, L. W. Zhang, H. Y. Cheng and Y. F. Zhu, Appl. Catal., B, 2011, 101, 382 CrossRef CAS.
- T. Lu, Y. P. Zhang, H. B. Li, L. K. Pan, Y. Li and Z. Sun, Electrochim. Acta, 2010, 55, 4170 CrossRef CAS.
- G. Zhu, T. Xu, T. Lv, L. K. Pan, Q. F. Zhao and Z. Sun, J. Electroanal. Chem., 2011, 650, 248 CrossRef CAS.
- T. Lu, L. Pan, C. Nie, Z. Zhao and Z. Sun, Phys. Status Solidi A, 2011, 208, 2325 CrossRef CAS.
- S. Ding, D. Luan, F. Y. C. Boey, J. S. Chen and X. W. Lou, Chem. Commun., 2011, 47, 7155 RSC.
- M. Zhang, D. Lei, Z. Du, X. Yin, L. Chen, Q. Li, Y. Wang and T. Wang, J. Mater. Chem., 2011, 21, 1673 RSC.
- X. Wang, X. Zhou, K. Yao, J. Zhang and Z. Liu, Carbon, 2011, 49, 133 CrossRef CAS.
- R. Demir Cakan, Y. S. Hu, M. Antonietti, J. Maier and M. M. Titirici, Chem. Mater., 2008, 20, 1227 CrossRef CAS.
- F. Han, W. C. Li, M. R. Li and A. H. Lu, J. Mater. Chem., 2012, 22, 9645 RSC.
- K. Chang and W. X. Chen, ACS Nano, 2011, 5, 4720 CrossRef CAS.
- S. Yang, H. Song and X. Chen, Electrochem. Commun., 2006, 8, 137 CrossRef CAS.
- L. Q. Zhang, X. H. Liu, Y. Liu, S. Huang, T. Zhu, L. Gui, S. X. Mao, Z. Z. Ye, C. M. Wang, J. P. Sullivan and J. Y. Huang, ACS Nano, 2011, 5, 4800 CrossRef CAS.
| This journal is © The Royal Society of Chemistry 2012 |
