Polarity and surface structural evolution of iron oxide films
Shuming
Liu
,
Shuai
Wang
,
Jiandong
Guo
and
Qinlin
Guo
*
Beijing National Laboratory for Condensed Matter Physics, Institute of Physics, Chinese Academy of Sciences, P.O. Box 603, Beijing, 100190, P. R. China. E-mail: qlguo@iphy.ac.cn; Fax: 86 10-82649228; Tel: 86 10-82649435
First published on 24th August 2012
Abstract
Various ordered Fe oxide films were prepared in an ultrahigh vacuum system, and their surface and electronic structure were studied in situ by low-energy electron diffraction and photoelectron spectroscopy. We obtain Fe2O3(0001) films with oxygen termination (O–Fe2O3(0001)), a polar surface, via FeO(111) films. The O–Fe2O3(0001) films can be transformed to a non-polar surface of iron-terminated Fe2O3(0001) (Fe–Fe2O3(0001)) films. Fe3O4(111) films are formed after annealing O–Fe2O3(0001) films. A co-existed phase of Fe–Fe2O3(0001) and Fe3O4(111) is observed via annealing Fe–Fe2O3(0001) films. These Fe oxide films with different surface structures and properties can be designedly used as model plates for further studies in surface physics and chemistry.
Introduction
Iron oxides are used in a wide range of technological, industrial and environmental applications as catalysts, oxidizing agents, electrodes, pigments, and gas sensors.1–6 Commonly obtained Fe oxides are FeO, Fe3O4 and α-Fe2O3 with cubic sodium-chloride structure, cubic inverse-spinel structure and corundum structure, respectively.7–10 Determined by experimental conditions, the surfaces of Fe oxides could be terminated by an O or Fe layer, e.g. O–Fe2O3(0001) (oxygen-terminated surface) or Fe–Fe2O3(0001) (iron-terminated surface).11–13 Those surfaces with different surface and electronic structure significantly affect their chemical and physical properties. For instance, previous experimental studies have showed that water is not dissociated on O–FeO(111) films but dissociated on Fe–Fe3O4(111) films.14 Theoretical calculations have suggested that O–Fe2O3(0001) is the most stabilized surface after water adsorption, while Fe–Fe2O3(0001) surface is unstable at higher water coverage.15 Recent theoretical studies have also shown that on O–Fe2O3(0001), Au donates electrons to the support, while on Fe–Fe2O3(0001), Au gains electrons from the support.13Apparently, in iron oxide supported adsorbate systems, the chemical state and surface structure of the support play important roles in the interaction between adsorbate and oxide. Considering the diversity with various chemical states and surface structures in Fe oxides, the different interactions between molecules/atoms and these surfaces are expected. However, the studies of Fe oxide surfaces with different properties are few because those surfaces are very hard to obtain, especially for α-Fe2O3(0001). In the present study, various ordered Fe oxide films including FeO(111), O– and Fe–Fe2O3(0001), Fe3O4(111) as well as co-existence of Fe–Fe2O3(0001) and Fe3O4(111) films are synthesized and their surface evolutions are investigated.
Experimental section
All experiments were conducted in an ultrahigh vacuum system (VG ESCALAB-5) equipped with low-energy electron diffraction (LEED), X-ray photoelectron spectroscopy (XPS), and ultraviolet photoelectron spectroscopy (UPS).A single crystal of Mo(110) was used as the substrate to grow Fe oxide films. The temperature of the substrate was monitored by a C-type thermocouple (W-5%Re/W-26%Re) spot welded to the substrate. Before growing Fe oxide films, the substrate was cleaned by heating in ∼10−7 mbar O2 at ∼1200 K and flashed to ∼1600 K without O2. The procedure was repeated until no contaminations (mainly C) were detected except a small amount of residual oxygen, which has no influence on the growth of Fe oxide films.16
The Fe source consists of high purity Fe wire wrapped around a resistively heated tungsten wire. The deposition rate of Fe is about 0.4–0.5 Å min−1, monitored by a quartz crystal oscillator. Various Fe oxide films with about 40–70 Å thickness were prepared on the Mo substrate by co-deposition of Fe and O2 and followed annealing at certain temperatures with O2 (10−5–10−7 mbar) or without O2.
XPS measurements were carried out using Al Kα X-ray line (hv = 1486.6 eV). To avoid any surface change of the films induced by X-ray under a long time irradiation, a pass energy of 50 eV was used to shorten spectra acquisition time, yet the resolution of the spectra is good enough to distinguish Fe chemical states between Fe2+ and Fe3+. The binding energy (BE) of the XP spectrometer was calibrated with respect to the pure Au (4f7/2 = 84.0 eV) and Cu (2p3/2 = 932.7 eV). In data treatment, the BE of 530.1 eV from O 1s was used as an internal reference for any possible charging.9,17–20 UPS measurements were performed using the He(I) line (hv = 21.2 eV) and a pass energy of 5 eV. The spectra are referenced to the Fermi level (EF) calibrated by using the Mo substrate, as EF = 0 eV. All data were collected at room temperature.
Results and discussion
Curve (1) in Fig. 1 presents the XP spectrum of Fe 2p for Fe oxide films which were prepared by depositing Fe on the substrate in ∼10−7 mbar O2 at ∼600 K and subsequent annealing at ∼600 K. It is reported that the BEs of Fe 2p3/2 lines of Fe2+ and Fe3+ states are at 710.0 and 711.0 eV with their satellite lines at 715.5 and 719.0 eV, respectively.7,9,17–19,21–23 The BEs of Fe 2p3/2 line and its satellite peak of the as grown films are 709.8 and 715.5 eV, which are in a good agreement with the literature values of Fe2+,7,9,17,18,21,23 indicating a formation of FeO films. The LEED pattern of the FeO films is shown in Fig. 1(a), which exhibits a (1 × 1) pattern with hexagonal symmetry. Based on Mo(110) surface unit cell,24 a two dimensional (2D) lattice constant of ∼3 Å is deduced. Combined with XPS results, we confirm that the FeO films we prepared are FeO(111).7–10,25 FeO(111) films with similar thickness have been also prepared on Pt(111) recently.26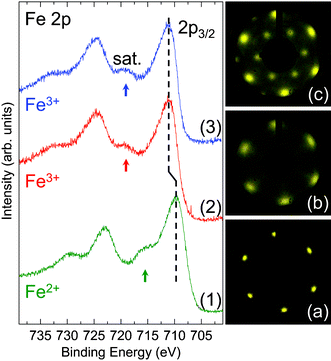 | ||
| Fig. 1 Fe 2p XP spectra of the as grown Fe oxide films (Curve 1), after oxidizing in ∼10−5 mbar O2 at ∼600 K (Curve 2) and further annealing in ∼10−5 mbar O2 at ∼650 K (Curve 3). The shift of the Fe 2p3/2 peak is indicated by the vertical dash lines. The Fe 2p3/2 satellite lines of Fe2+ and Fe3+ are indicated by arrows. (a–c) LEED patterns of the films corresponding to Curve 1–3, respectively. Primary energy is 55 eV for all LEED. | ||
After oxidizing the FeO(111) films in ∼10−5 mbar O2 at ∼600 K, the Fe 2p3/2 line and its satellite peak shift to 711.1 and 719.0 eV, respectively (Curve (2) in Fig. 1). These values are consistent with literature data of Fe3+,7,9,17–19,21–23 which suggests that Fe2+ cations are oxidized to Fe3+. This clearly indicates a transformation from FeO to Fe2O3 films. The LEED pattern of the Fe2O3 films also shows a hexagonal symmetry (Fig. 1(b)). This LEED pattern being similar to that of the FeO(111) films taken with the same incident beam energy infers a 2D lattice constant of ∼3 Å, too. However, the broader spots and the higher background in LEED indicate that the Fe2O3 films are rougher than the FeO(111) films.
The BE of the Fe 2p3/2 peak is almost unchanged after further annealing in ∼10−5 mbar O2 at ∼650 K (Curve (3) in Fig. 1). However, the intensity ratio of Fe to O is slightly higher than that at ∼600 K. The corresponding LEED pattern is shown in Fig. 1(c), revealing a hexagonal symmetry but with a different surface structure comparing to Fig. 1(b). On this surface, its 2D unit cell is ∼5 Å by comparing with the LEED pattern of FeO(111) films. The broader spots and higher background in the LEED pattern also indicate a defected surface.
Interestingly, in our experiments, the corresponding LEED pattern of Fe2O3 films show two different patterns with the same primary beam energy. Structurally, Fe2O3 has four polymorphs with α-Fe2O3, β-Fe2O3, γ-Fe2O3 and ε-Fe2O3.27 The α-Fe2O3 has corundum structure with lattice parameters a0 = 5.036 Å, c0 = 13.749 Å. The β-Fe2O3 and γ-Fe2O3 have body-centered cubic “bixbyite” and inverse-spinel structures with lattice parameter a0 = 9.404 and 8.351 Å, respectively. ε-Fe2O3 crystallizes in an orthorhombic structure with lattice parameters a0 = 5.095 Å, b0 = 8.789 Å and c0 = 9.437 Å. Based on those structures, ε-Fe2O3 cannot give hexagonal LEED patterns, but α-Fe2O3(0001), β-Fe2O3(111) or γ-Fe2O3(111) can. However, the 2D lattice constant of β-Fe2O3(111) is 13.299 Å, which is much larger than that we observed. For γ-Fe2O3, it is metastable and can be converted to Fe3O4 in vacuum at 473 K or transformed into the stable α-Fe2O3 in O2 above 573 K.28 Therefore, the Fe2O3 films we prepared are most likely the α-form.
Based on the bulk structure of α-Fe2O3, the (0001) face is of hexagonal structure with 2D unit cell of 5.036 Å. This face could be terminated by either an iron or oxygen layer, as shown in Fig. 2(a) and 2(b). It should be noted that the oxygen–oxygen distance in the O layer from bulk structure is different.12,29 This causes the 2D lattice constant of the O layer to be ∼5 Å, which is the same as the lattice constant of the Fe layer. Previous studies indicated that the surface with the (1 × 1) LEED pattern could be terminated by either Fe or O.12,29 However, experimental results indicated that surface O atoms are relaxed on the oxygen-terminated surface, which results in a uniform oxygen–oxygen distance of ∼3 Å,21,30 as shown in Fig. 2(c). Thus, a 2D lattice constant of ∼3 Å should be observed on the oxygen-terminated surface. In the case of the iron-terminated surface, the structure of the O layer is very close to the bulk one11,12 and the 2D lattice constant remains ∼5 Å. In the present work, the LEED pattern shown in Fig. 1(c), with a 2D lattice constant of ∼5 Å, corresponds to the (1 × 1) structure of α-Fe2O3(0001). The LEED pattern with a 2D lattice constant of ∼3 Å in Fig. 1(b) is a  structure with respect to the (1 × 1) structure. The films with the
 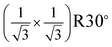 LEED pattern should be related to the O termination, because only the oxygen-terminated surface could provide a 2D lattice constant of ∼3 Å.
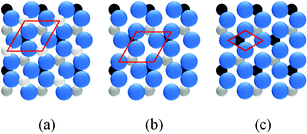 | ||
| Fig. 2 Top view of (a) Fe–Fe2O3(0001) face in bulk structure, (b) O–Fe2O3(0001) face in bulk structure and (c) O–Fe2O3(0001) surface after taking surface relaxation into account. The Fe cations are indicated by small balls and the O anions by big balls. The unit cells of the topmost layers are indicated. | ||
The same LEED pattern with  surface structure has been also observed from low coverage α-Fe2O3 films prepared on α-Al2O3(0001) at 523 K.18 By combining real time reflection high-energy electron diffraction (RHEED) and LEED techniques, the authors suggested that corundum phase in the films is not ordered enough to coherently contribute to the LEED pattern.18 Generally, the surface of corundum films prepared at lower temperature is rougher and contains defects, but it gets smoother and less defects at higher temperature. For instance, the studies by scanning tunneling microscopy (STM) showed that the α-Fe2O3(0001) films prepared at 700 K consist of patches and are covered with defects, while at 1000 K the films are smoother and nearly defect-free.21,30,31 Therefore surface defects are important to the formation of the
  LEED pattern, because other 2D periodicities on the surface could be identified without imaging the underlying corundum phase. Recently, a 2D lattice constant of ∼3 Å from oxygen-terminated Fe2O3 films prepared on Au(111) was observed by STM.21,30 In addition, the same growth mode was found on different substrates.18,21 This indicates that the equilibrium structure of the films may be independent of the substrate nature.18 We conclude that the
  LEED pattern shown in Fig. 1(b) corresponds to defected O–Fe2O3(0001) films.
To further confirm the origin of our LEED patterns, we conducted Fourier transform on real space models by taking defects into account. This was performed by using the Fourier transform section of scanning probe imaging processor (SPIP) brand software. The surfaces are built by choosing the ionic radii of Fe3+ and O2− with 0.64 and 1.32 Å, respectively.29 Based on a previous study, the α-Fe2O3 films contain surface defects as depression with an area of about 30–50 Å2.21 For oxide films the surface defect extent is generally thought to be in a range from ∼10% to ∼20%. Taking these factors into account, the defects are built by removing Fe and O atoms from the top layers as stoichiometric ratios of Fe2O3. Fig. 3(a) and (b) reveal the schematic defected structure for the oxygen- and iron-terminated surface, respectively. Fig. 3(c) and (d) show the details of the defects indicated in (a) and (b), respectively. Fig. 3(e) and (f) give the Fourier transform results for O– and Fe–Fe2O3(0001) surfaces with ∼10% defects, respectively. Both Fig. 3(e) and 3(f) show high background intensity and broader spots and Fig. 3(e) reveals a  structure compared with Fig. 3(f). These results suggest that the films as shown in Fig. 1(b) and 1(c) correspond with defected O–Fe2O3(0001)16 and Fe–Fe2O3(0001) films, respectively. The Fourier transform results for the surfaces with ∼15% and ∼20% defects are similar to that of ∼10%, but only the background noise is increased. The above assignment of termination is further supported by the following studies of valence band structure.
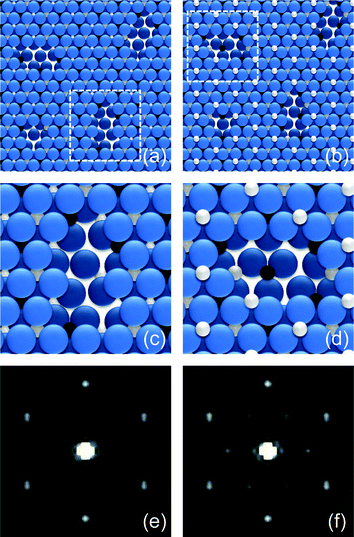 | ||
| Fig. 3 (a), (b) Schematic structures of the O– and Fe–Fe2O3(0001) surfaces with ∼10% defects, respectively. (c), (d) Detailed structures of the defects as indicated in (a) and (b), respectively. The O anions are indicated by big balls and the Fe cations by small balls. (e), (f) Fourier transform results of O– and Fe–Fe2O3(0001) surfaces with ∼10% defects, respectively. | ||
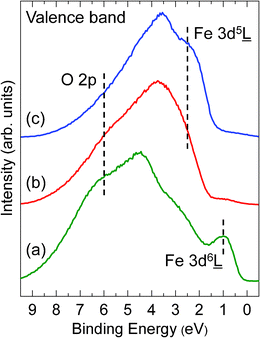
Fig. 4 shows UP spectra of the Fe oxide films from 0 and 9 eV. The spectra mainly consist of overlapping and hybridizing of O 2p and Fe 3dn![[L with combining low line]](https://www.rsc.org/images/entities/char_004c_0332.gif) ( denotes a ligand hole) final states.23,32–34 For FeO(111) films, the spectrum (Curve (a) in Fig. 4) shows a peak at ∼1 eV which originates from Fe 3d6 final states, corresponding to Fe2+.32 This peak disappears after oxidizing in ∼10−5 mbar O2 at ∼600 K (Curve (b) in Fig. 4), implying an oxidation of Fe2+ to Fe3+. The weak signals around 0–1.5 eV in the Curve (b) may originate from residual Fe2+ ions or from surface defect states. After further annealing in ∼10−5 mbar O2 at ∼650 K, the intensity of the peak at ∼6 eV is decreased and the intensity of the peak at ∼2.5 eV is increased (Curve (c) in Fig. 4). The emission at ∼6 eV is mainly from O 2p states,32–34 and the emission at ∼2.5 eV is related to Fe 3d5 final states, corresponding to Fe3+.32,34
( denotes a ligand hole) final states.23,32–34 For FeO(111) films, the spectrum (Curve (a) in Fig. 4) shows a peak at ∼1 eV which originates from Fe 3d6 final states, corresponding to Fe2+.32 This peak disappears after oxidizing in ∼10−5 mbar O2 at ∼600 K (Curve (b) in Fig. 4), implying an oxidation of Fe2+ to Fe3+. The weak signals around 0–1.5 eV in the Curve (b) may originate from residual Fe2+ ions or from surface defect states. After further annealing in ∼10−5 mbar O2 at ∼650 K, the intensity of the peak at ∼6 eV is decreased and the intensity of the peak at ∼2.5 eV is increased (Curve (c) in Fig. 4). The emission at ∼6 eV is mainly from O 2p states,32–34 and the emission at ∼2.5 eV is related to Fe 3d5 final states, corresponding to Fe3+.32,34
 | ||
| Fig. 4 UP spectra of the as grown films (a), after annealing in ∼10−5 mbar O2 at ∼600 K (b) and further annealing in ∼10−5 mbar O2 at ∼650 K (c). The positions related to O 2p, Fe 3d5 and Fe 3d6 are indicated. | ||
Even though the analytical depth in UPS is higher than that in XPS, the both analytical techniques are surface sensitive and the top atomic layers should contribute to the intensity of the signal most. Therefore, for the oxygen-terminated surface, it should give a higher O 2p intensity and a lower Fe 3d intensity, and it reverses for the iron-terminated surface. In our experiments, the high intensity around 6 eV in the UP spectrum of FeO(111) films (Curve (a) in Fig. 4) is indicative of O termination. The oxygen-terminated FeO(111) films prepared on Pt(111) in ∼10−6 mbar O2 has been verified by X-ray photoelectron diffraction measurements.35 For α-Fe2O3(0001) films, the higher O 2p intensity and the lower Fe 3d intensity in the Curve (b) in Fig. 4 indicate that the films are of O termination. In contrast, the lower O 2p intensity and the higher Fe 3d intensity in the Curve (c) suggest the films are of Fe termination. These results are consistent with the LEED conclusions.
One may argue that hydroxyl adsorbed on the oxide films can affect the surface structure. Fig. 5 shows the O 1s XP spectra of various Fe oxide films. The symmetric peaks of O 1s exclude the possibility of hydroxyl existing on the surfaces.36,37
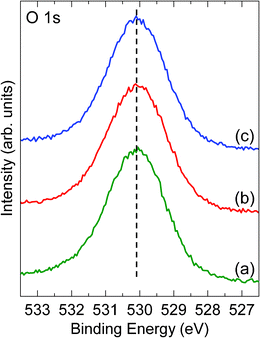 | ||
| Fig. 5 XP spectra of O 1s from the as grown films (a), after annealing in ∼10−5 mbar O2 at ∼600 K (b) and further annealing in ∼10−5 mbar O2 at ∼650 K (c). The dash line indicates a BE value of 530.1 eV. | ||
The surfaces of any ionic or partly ionic material can be classified into three types as shown in Fig. 6.38 In type 1 (Fig. 6(a)), each plane consisting of equal anions and cations is electrically neutral and no dipole moment exists perpendicular to the surface (pz = 0); in type 2 (Fig. 6(b)), each plane is charged but the total dipole moment of the repeat unit vanishes (pz = 0); and in type 3 (Fig. 6(c)), each plane is also charged and the repeat unit bears a non-zero dipole moment (pz ≠ 0). For FeO(111) films, along the [111] direction FeO presents a sequence of alternating and equally spaced cation and anion planes, i.e. its (111) surface is of polarity. Note that for a type 3 surface, the electrostatic energy is proportional to the films thickness.39 Therefore, thick FeO(111) films should bear a large electrostatic energy and be unstable. It is known that a significant number of vacancies in Fe sites exist in FeO mineral and the fraction of vacant Fe sites ranges from approximately 5% to 15%.8,17 In our FeO(111) films, the contained vacancies in Fe sites may reduce the electrostatic energy and stabilize the surface. Normally, the lone electrons at sites surrounding the vacancies will be polarized and these polarized electrons do not occupy the allowed states in the valence band and below, but they introduce defect states in the vicinity of EF.40,41 The defect states could be detected by UPS. For FeO, however, it is hard to identify the introduced states because a higher intensity of Fe 3d6 emission located around EF. To study the defect states in detail, more techniques such as scanning probe microscopy are needed.
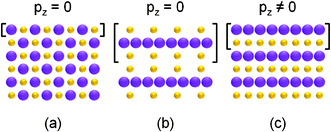 | ||
| Fig. 6 Schematic representation of stacking sequence in ionic crystal. (a) With equal anions and cations on each plane and no dipole moment perpendicular to surface. (b) With charged planes but no dipole moment normal to surface. (c) With charged planes and a dipole moment vertical to the surface. pz is the dipole moment perpendicular to surface. The big and small balls denote anions and cations, respectively. Square brackets indicate the repeat units. | ||
For O–Fe2O3(0001) surface, the repeat unit in the [0001] direction is O3–Fe2–, being of a type 3 surface,39 which should bear a large electrostatic energy, causing instability. However, the electrostatic energy can be lowered by surface charge modifications.39 The surface of O–Fe2O3(0001) films can be modified by defects, impurities and ferryl groups with Fe in the Fe5+ oxidation state formed on the surface.42,43 Unfortunately, the latter two factors can not be detected due to limitation of our instrument precision. It is most likely that the polar O–Fe2O3(0001) films in our experiments are stabilized by surface defects, which is in evidence from broad spots in the LEED pattern and possible defect states around 0–1.5 eV in the UP spectrum.
For Fe–Fe2O3(0001) surface, the repeat unit in the [0001] direction is Fe–O3–Fe–, i.e. a non-polar surface with a type 2 surface. The transformation from O–Fe2O3(0001) to Fe–Fe2O3(0001) films we observed suggests that the surface energy of the Fe termination is smaller than that of the O termination. Theoretically, the surface energy of thin oxide films is a function of the chemical potential of O. At thermodynamic equilibrium of the solid–gas interface, the chemical potential of O is given by its value in the molecular gas and written as
 | (1) |
For FeO(111) films, a previous theory showed O termination is more stable than Fe termination when the corresponding chemical potential of O is above −4.35 eV.45 Under our experimental conditions (P is ∼7 × 10⁻⁷ mbar), the corresponding chemical potential of O is −1.15 eV. This suggests the prepared FeO(111) films are oxygen-terminated, which is consistent with the UPS results. In an oxidizing process, the oxidation should take place under thermodynamic non-equilibrium conditions. Therefore, O–Fe2O3(0001) films are obtained under a lower chemical potential of O in our experiments. However, with annealing, the films approach the thermodynamic equilibrium, i.e. transformation from O–Fe2O3(0001) to Fe–Fe2O3(0001).
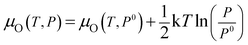
The thermal stability of the α-Fe2O3(0001) films with different terminations was studied by annealing without O2. The results show that the oxygen-terminated surface is stable at temperature <600 K. Fe2+ signals can be detected at ∼650 K, and the intensity of Fe2+ signals becomes more obvious with increasing temperature. Fig. 7(a) shows the XP spectrum of Fe 2p lines after annealing O–Fe2O3(0001) films at ∼700 K. The Fe 2p3/2 peak shifts to 710.6 eV and no satellite line is observed, which are the typical characteristics of Fe3O4.17,18Fig. 7(b) gives the valence band spectrum. The appearance of the peak at ∼1 eV features Fe2+. Fig. 7(c) shows the corresponding LEED pattern, which gives a 2D lattice constant of ∼6 Å as compared with the LEED pattern of FeO(111) films, being consistent with the value of Fe3O4(111) (5.92 Å).7,10,25 These results suggest that O–Fe2O3(0001) films are completely reduced to Fe3O4(111) films after the annealing.
 | ||
| Fig. 7 (a) Fe 2p XP spectrum after annealing O–Fe2O3(0001) films at ∼700 K, the position of Fe 2p2/3 is indicated by the dashed line. (b) UP spectrum. The position of Fe2+ is indicated by the arrow. (c) LEED pattern with primary beam energy of 55 eV. | ||
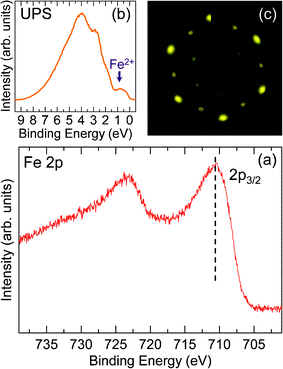
The Fe–Fe2O3(0001) is also thermally stable at temperature <600 K. At ∼650 K, it is slightly changed. At ∼700 K, compared with the Fe–Fe2O3(0001) without annealing, its Fe 2p lines become slightly broader and the intensity of Fe3+ satellite peak is less visible, as seen in Fig. 8(a). Its valence band spectrum clearly shows a new peak at ∼1 eV (inset of Fig. 8(a)). Those results indicate the part reduction of the Fe3+ to Fe2+. Fig. 8(b) and (c) show the LEED pattern of the films and the corresponding schematic drawing, respectively. The spots in the LEED pattern are separated into two groups, as indicated by the big and small dots in the schematic drawing, respectively. Both of them are of hexagonal symmetry but with 30° rotation to each other. The corresponding reciprocal lattice lengths of these two set of spots are different, which implies two different structures. In fact, one set of the spots (big dots in the schematic drawing) located at the same positions as that in the LEED pattern of Fe–Fe2O3(0001) films and the other set of the spots (small dots in the schematic drawing) located at the same positions of that of Fe3O4(111) films, under the same beam energy. Thus it clearly shows that Fe–Fe2O3(0001) and Fe3O4(111) are co-existing on surface. This result is consistent with the XPS and UPS results that after the annealing, Fe–Fe2O3 is not completely reduced to Fe3O4, being different from O–Fe2O3. Thus, it is confirmed that the non-polar Fe–Fe2O3(0001) film is more stable than the polar O–Fe2O3(0001) films. In addition, the co-existing surface is different from previous reported biphase surfaces consisting of α-Fe2O3(0001) and FeO(111) or Fe3O4(111) and FeO(111).10,25 The co-existed surface may have novel properties, which need more designed experiments to explore.
 | ||
| Fig. 8 (a) XP spectrum of Fe 2p after annealing Fe–Fe2O3(0001) films at ∼700 K, the positions of Fe 2p3/2 and satellite lines for Fe2+ and Fe3+ are indicated, respectively. The inset of (a) is the UP spectrum and the position of Fe2+ is indicated by the arrow. (b) LEED pattern with primary energy of 35 eV, and (c) schematic drawing of (b), the big and small dots are separated into two groups and both are of hexagonal symmetry but with 30° rotation. The thick and thin solid lines represent the reciprocal lattice lengths. | ||
Conclusions
We have prepared and studied in situ ordered Fe oxide films including FeO(111), O–Fe2O3(0001), Fe–Fe2O3(0001) and Fe3O4(111) films by LEED, XPS and UPS. The O–Fe2O3(0001) and Fe–Fe2O3(0001) films can be obtained by annealing FeO(111) films in ∼10−5 mbar O2. Fe–Fe2O3(0001) films are more thermally stable than O–Fe2O3(0001) films. A co-existence of Fe–Fe2O3(0001) and Fe3O4(111) films is observed. The present study is helpful to understand surface structural evolution in iron oxides. The Fe oxide films we have provided can be used as model surfaces for investigations into various chemical reactions.Acknowledgements
We gratefully acknowledge the financial support of this work from the Knowledge Innovation Program of the Chinese Academy of Sciences (KJCX2-EW-W09) and the 973 program of China (2012CB921700).References
- A. A. Herzing, C. J. Kiely, A. F. Carley, P. Landon and G. J. Hutchings, Science, 2008, 321, 1331–1335 CrossRef CAS.
- M. Haruta, T. Kobayashi, H. Sano and N. Yamada, Chem. Lett., 1987, 16, 405–408 CrossRef.
- B. V. Reddy and S. N. Khanna, Phys. Rev. Lett., 2004, 93, 068301 CrossRef CAS.
- J. S. Chen, T. Zhu, X. H. Yang, H. G. Yang and X. W. Lou, J. Am. Chem. Soc., 2010, 132, 13162–13164 CrossRef CAS.
- N. Pailhé, A. Wattiaux, M. Gaudon and A. Demourgues, J. Solid State Chem., 2008, 181, 2697–2704 CrossRef.
- Y. Wang, S. R. Wang, Y. Q. Zhao, B. L. Zhu, F. H. Kong, D. Wang, S. H. Wu, W. P. Huang and S. M. Zhang, Sens. Actuators B, 2007, 125, 79–84 CrossRef.
- W. Weiβ, Surf. Sci., 1997, 377–379, 943–947 Search PubMed.
- G. Ketteler, W. Weiss, W. Ranke and R. Schlögl, Phys. Chem. Chem. Phys., 2001, 3, 1114–1122 RSC.
- A. Barbieri, W. Weiss, M. A. Van Hove and G. A. Somorjai, Surf. Sci., 1994, 302, 259–279 CrossRef CAS.
- N. G. Condon, F. M. Leibsle, T. Parker, A. R. Lennie, D. J. Vaughan and G. Thornton, Phys. Rev. B: Condens. Matter, 1997, 55, 15885–15894 CrossRef CAS.
- X.-G. Wang, W. Weiss, S. K. Shaikhutdinov, M. Ritter, M. Petersen, F. Wagner, R. Schlögl and M. Scheffler, Phys. Rev. Lett., 1998, 81, 1038–1041 CrossRef CAS.
- M. Lübbe and W. Moritz, J. Phys.: Condens. Matter, 2009, 21, 134010 CrossRef.
- A. Kiejna and T. Pabisiak, J. Phys.: Condens. Matter, 2012, 24, 095003 CrossRef.
- Y. Joseph, W. Ranke and W. Weiss, J. Phys. Chem. B, 2000, 104, 3224–3236 CrossRef CAS.
- F. Jones, A. L. Rohl, J. B. Farrow and W. van Bronswijk, Phys. Chem. Chem. Phys., 2000, 2, 3209–3216 RSC.
- M. S. Xue, S. Wang, K. H. Wu, J. D. Guo and Q. L. Guo, Langmuir, 2011, 27, 11–14 CrossRef CAS.
- T. Yamashita and P. Hayes, Appl. Surf. Sci., 2008, 254, 2441–2449 CrossRef CAS.
- S. Gota, E. Guiot, M. Henriot and M. Gautier-Soyer, Phys. Rev. B: Condens. Matter, 1999, 60, 14387–14395 CrossRef CAS.
- T. Fujii, F. M. F. de Groot, G. A. Sawatzky, F. C. Voogt, T. Hibma and K. Okada, Phys. Rev. B: Condens. Matter, 1999, 59, 3195–3202 CrossRef CAS.
- T. Fujii, D. Alders, F. C. Voogt, T. Hibma, B. T. Thole and G. A. Sawatzky, Surf. Sci., 1996, 366, 579–586 CrossRef CAS.
- X. Y. Deng and C. Matranga, J. Phys. Chem. C, 2009, 113, 11104–11109 CAS.
- A. Barbier, R. Belkhou, P. Ohresser, M. Gautier-Soyer, O. Bezencenet, M. Mulazzi, M.-J. Guittet and J.-B. Moussy, Phys. Rev. B: Condens. Matter Mater. Phys., 2005, 72, 245423 CrossRef.
- T. Schedel-Niedrig, W. Weiss and R. Schlögl, Phys. Rev. B: Condens. Matter, 1995, 52, 17449–17460 CrossRef CAS.
- D. H. Guo, M. S. Xue, Q. L. Guo, K. H. Wu, J. D. Guo and E. G. Wang, Appl. Surf. Sci., 2009, 255, 9015–9019 CrossRef CAS.
- N. G. Condon, F. M. Leibsle, A. R. Lennie, P. W. Murray, D. J. Vaughan and G. Thornton, Phys. Rev. Lett., 1995, 75, 1961–1964 CrossRef CAS.
- N. Spiridis, D. Wilgocka-Ślęzak, K. Freindl, B. Figarska, T. Giela, E. Młyńczak, B. Strzelczyk, M. Zając and J. Korecki, Phys. Rev. B: Condens. Matter Mater. Phys., 2012, 85, 075436 CrossRef.
- R. Zboril, M. Mashlan and D. Petridis, Chem. Mater., 2002, 14, 969–982 CrossRef CAS.
- N. Wiberg, A. F. Holleman, E. Wiberg, Holleman-Wiberg's Inorganic Chemistry, Academic Press, San Diego, 2001 Search PubMed.
- G. Ketteler, W. Weiss and W. Ranke, Surf. Rev. Lett., 2001, 8, 661–683 CAS.
- X. Y. Deng, J. Lee, C. J. Wang, C. Matranga, F. Aksoy and Z. Liu, J. Phys. Chem. C, 2010, 114, 22619–22623 CAS.
- W. Weiss and W. Ranke, Prog. Surf. Sci., 2002, 70, 1–151 CrossRef CAS.
- A. Fujimori, N. Kimizuka, M. Taniguchi and S. Suga, Phys. Rev. B, 1987, 36, 6691–6694 CrossRef CAS.
- R. J. Lad and V. E. Henrich, Phys. Rev. B, 1989, 39, 13478–13485 CrossRef CAS.
- A. Fujimori, M. Saeki, N. Kimizuka, M. Taniguchi and S. Suga, Phys. Rev. B, 1986, 34, 7318–7328 CrossRef CAS.
- Y. J. Kim, C. Westphal, R. X. Ynzunza, H. C. Galloway, M. Salmeron, M. A. Van Hove and C. S. Fadley, Phys. Rev. B: Condens. Matter, 1997, 55, R13448–R13451 CrossRef CAS.
- M. A. Brown, E. Carrasco, M. Sterrer and H.-J. Freund, J. Am. Chem. Soc., 2010, 132, 4064–4065 CrossRef CAS.
- I. Platzman, R. Brener, H. Haick and R. Tannenbaum, J. Phys. Chem. C, 2008, 112, 1101–1108 CAS.
- P. W. Tasker, J. Phys. C: Solid State Phys., 1979, 12, 4977–4984 CrossRef CAS.
- C. Noguera, Physics and Chemistry at Oxide Surfaces, Cambridge University Press, Cambridge, 1996 Search PubMed.
- C. Q. Sun, Y. G. Nie, J. S. Pan, X. Zhang, S. Z. Ma, Y. Wang and W. T. Zheng, RSC Adv., 2012, 2, 2377–2383 RSC.
- C. Q. Sun, Nanoscale, 2010, 2, 1930–1961 RSC.
- W. Bergermayer, H. Schweiger and E. Wimmer, Phys. Rev. B: Condens. Matter Mater. Phys., 2004, 69, 195409 CrossRef.
- C. Lemire, S. Bertarione, A. Zecchina, D. Scarano, A. Chaka, S. Shaikhutdinov and H.-J. Freund, Phys. Rev. Lett., 2005, 94, 166101 CrossRef CAS.
- D. R. Stull and H. Prophet, JANAF Thermochemical Tables, U.S. National Bureau of Standards,Washington DC, 2nd edn, 1971 Search PubMed.
- Y. L. Li, K. L. Yao, Z. L. Liu and G. Y. Gao, Phys. Rev. B: Condens. Matter Mater. Phys., 2005, 72, 155446 CrossRef.
| This journal is © The Royal Society of Chemistry 2012 |