DOI:
10.1039/C2RA20663C
(Paper)
RSC Adv., 2012,
2, 9944-9951
Effective inhibition of mild steel corrosion in 1 M hydrochloric acid using substituted triazines: an experimental and theoretical study
Received
12th April 2012
, Accepted 15th August 2012
First published on 10th September 2012
Abstract
Inhibition of mild steel corrosion in 1 M hydrochloric acid with three different 1,2,4-triazine precursors were investigated by polarization (Tafel), electrochemical impedance (EIS), adsorption and computational calculations at room temperature. Polarization studies showed that these molecules act as mixed-type inhibitors. As the electron density around the inhibitor molecule increases the inhibition efficiency also increases. Obvious correlation were found between corrosion inhibition efficiency and some quantum chemical parameters such as highest occupied molecular orbital (HOMO) and lowest unoccupied molecular orbital (LUMO), HOMO–LUMO gap energy and electron density. Calculated results indicated that the difference in inhibition efficiencies between the compounds can be clearly explained in terms of frontier molecular orbital theory. The inhibition efficiency depends mainly on the type of functional group (CH2Ph, But or Me) substituted on the triazine ring. The order of efficiency is ABTDT (CH2Ph) > ATTDT (But) > AMTDT (Me).
1. Introduction
Acid solutions generally, and hydrochloric acid in particular, are used for the removal of rust and scale in industrial processes. Inhibitors are used in these processes to control metal dissolution. Most of the well known inhibitors are organic compounds containing N, S and or O atoms. Organic compounds containing functional electronegative groups and π electrons in triple or conjugated double bonds are also used as good inhibitors. The study of corrosion processes and their inhibition by organic compounds is an active field of contemporary research.1–5 Recently, computational quantum chemical calculations and molecular simulation studies have also been used to explain the mechanism of corrosion inhibition.6–12 The geometry of the inhibitor molecule in its ground state and the nature of their molecular orbitals (HOMO; highest occupied molecular orbital and LUMO; lowest unoccupied molecular orbital) are directly involved in the inhibitive properties of these molecules. This paper describes the corrosion inhibition behavior of 1.2.4-triazine derivatives 4-amino-6-methyl-3-thioxo-3,4-dihydro-1,2,4-triazine-5(2H)-one (AMTDT), 4-amino-6-(tert-butyl)-3-thioxo-3,4-dihydro-1,2,4-triazine-5(2H)-one (ATTDT) and 4-amino-6-benzyl-3-thioxo-3,4-dihydro-1,2,4-triazine-5(2H)-one (ABTDT) on mild steel in 1 M HCl solution using electroanalytical and computational methods.
2. Experimental method
2.1. Inhibitor
About 170 ml of water was taken in a beaker and heated to boiling and then 23 g of thiocabohydrazide added. Afterwards 14 g of pyruvic/substituted pyruvic acid was added and the light yellow crystals formed were recrystalized from ethanol. The geometries of the inhibitor molecules are shown in Fig. 1.
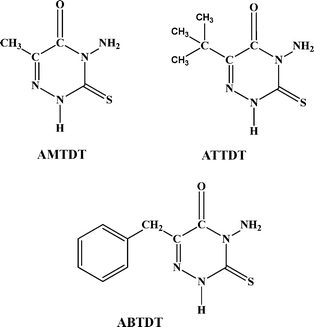 |
| | Fig. 1 Structure of inhibitor molecules: 4-amino-6-methyl-3-thioxo-3,4-dihydro-1,2,4-triazin-5(2H)-one (AMTDT), 4-amino-6-(tert-butyl)-3-thioxo-3,4-dihydro-1,2,4-triazin-5(2H)one (ATTDT) and 4-amino-6-benzyl-3-thioxo-3,4-dihydro-1,2,4-triazin-5(2H)-one (ABTDT) | |
2.2. Medium
The medium for the study was prepared from reagent grade HCl (E. Merck) using double distilled water. All tests were performed in aerated medium at room temperature (300 K) and atmospheric pressure.
2.3. Materials
The mild steel samples were of the following compositions (wt%), C ≈ 0.2%; Mn ≈ 1%; P ≈ 0.03%; S ≈ 0.02%; Fe ≈ 98.75% as determined by EDAX spectral method. For electrochemical studies mild steel specimens of 4.8 × 1.9 cm2 coupons were used but only 1 cm2 area is exposed during each measurements. The samples were polished using different grades of Emery papers (600–1200 grade) followed by washing with ethanol, acetone and finally with distilled water before each measurement, as recommended by ASTM.
2.4. Electrochemical measurements
Polarization and electrochemical impedance spectroscopy (EIS) measurements were carried out using a Gill AC computer controlled electrochemical workstation (ACM, UK, model no: 1475). Electrochemical data were analyzed using Gill AC software. The excitation AC signal had amplitude 10 mV (RMS) in a frequency domain from 0.1 Hz to 10 kHz. The EIS were recorded after reading the steady-state open-circuit potential. The potentiodynamic polarization studies were done in the potential range from −250 to +250 mV with a sweep rate of 1 mV s−1. The scanning was carried out at a rate of 1 mV s−1 with respect to saturated calomel electrode (SCE). Prior to the potential sweep, the electrode was left under open circuit in the respective solution for approximately 1 h until a steady free corrosion potential was recorded. Corrosion current density, Icorr, which is equivalent to corrosion rate is given by the intersection of the Tafel line extrapolation. On the contrary, the current corresponding to the extrapolation at the corrosion potential of the first pseudo-linear part of the polarization curve coincides with Icorr only when the contribution of other currents in this region is negligible.
2.5. Computational studies
The use of quantum chemical calculations has become popular for screening new potential corrosion inhibitors.13 In most cases, such screening consists of calculating several electronic structural parameters of isolated molecules either in gas (G) or in aqueous (A) phase (the solvent is usually treated by some variant of polarized continuum mode (PCM)).14–16 The most popular parameters which play a prominent role are involved in the hard–soft acid–base (HSAB) theory of chemical reactivity. These involve the eigenvalues of the HOMO and LUMO, the HOMO–LUMO gap (ΔE), chemical hardness/softness, electronegativity and the number of electrons transferred from the inhibitor molecule to the metal surface.17 Molecular dipole moments and Fukui functions are also frequently used in corrosion inhibition studies.
3. Results and discussion
3.1. Potentiodynamic polarization studies
Polarization measurements were carried out to get information regarding the kinetics of anodic and cathodic reactions. The potentiodynamic polarization curves for mild steel in 1 M HCl solution in the absence and presence of different concentrations of the inhibitor molecules are shown in Fig. 2a–c. The values of electrochemical kinetic parameters such as corrosion potential (Ecorr), corrosion current density (Icorr) and Tafel slopes (βa and βc), determined from these by extrapolation method, are listed in Table 1. The corrosion inhibition efficiency was calculated using the relation:| |  | (1) |
where Icorr* and Icorr are uninhibited and inhibited corrosion current density, respectively, determined by extrapolation of Tafel lines in the corrosion potential. The inhibitor molecule first adsorbs on the mild steel surface and blocks the available reaction sites.18 As concentration of the inhibitor increases the Linear Polarization Resistance (LPR) increases and Corrosion Rate (CR) decreases. The surface coverage increases with the inhibitor concentration and the formation of inhibitor film on the mild steel surface reduces the active surface area available for the attack of the corrosive medium and delays hydrogen evolution and metal dissolution.19,20
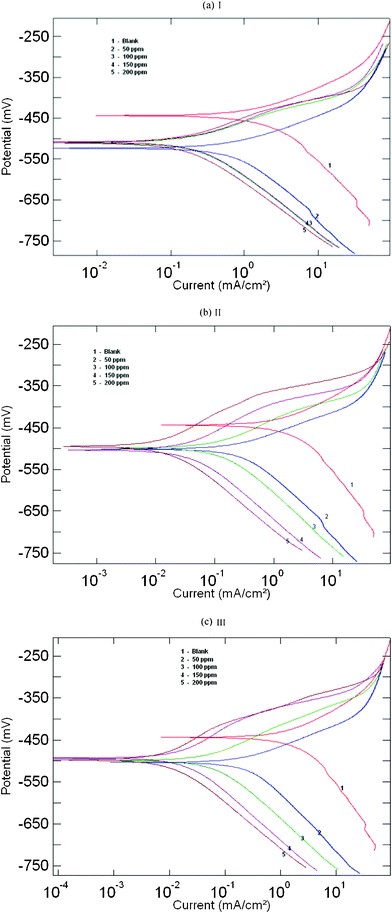 |
| | Fig. 2 Anodic and cathodic Tafel lines for mild steel in uninhibited 1 M HCl and with different concentrations of inhibitors: (a) AMTDT, (b) ATTDT and (c) ABTDT. | |
Table 1 Polarization parameter and inhibition efficiency for the corrosion of mild steel at different concentrations of triazine derivatives
| Inhibitor |
Conc./ppm |
E
corr/mV |
LPR/Ω cm2 |
β
a/mV dec−1 |
β
c/mV dec−1 |
I
corr/mA cm−2 |
CR/mm yr−1 |
IE (%) |
| None |
— |
−445.36 |
4.3107 |
111 |
197 |
3.001 |
34.781 |
— |
| |
| AMTDT |
50 |
−523.89 |
5.1665 |
89 |
195 |
1.3635 |
15.803 |
54.56 |
| |
100 |
−509.07 |
5.1244 |
69 |
157 |
0.4174 |
4.8382 |
86.09 |
| |
150 |
−507.92 |
5.5578 |
66 |
150 |
0.3176 |
3.6811 |
89.41 |
| |
200 |
−509.92 |
6.6214 |
56 |
129 |
0.1716 |
1.9891 |
94.28 |
| |
| ATTDT |
50 |
−501.35 |
5.6957 |
64 |
149 |
0.4504 |
5.2902 |
84.99 |
| |
100 |
−499.02 |
5.8664 |
59 |
127 |
0.1451 |
1.6816 |
95.16 |
| |
150 |
−503.89 |
7.1034 |
54 |
101 |
0.0326 |
0.3782 |
98.91 |
| |
200 |
−495.01 |
8.6501 |
53 |
89 |
0.0138 |
0.1603 |
99.54 |
| |
| ABTDT |
50 |
−504.77 |
5.8916 |
63 |
150 |
0.3863 |
4.4771 |
87.12 |
| |
100 |
−499.66 |
6.5642 |
58 |
105 |
0.0563 |
0.6523 |
98.12 |
| |
150 |
−493.64 |
10.901 |
76 |
74 |
0.0117 |
0.1356 |
99.61 |
| |
200 |
−498.32 |
11.254 |
38 |
35 |
0.0029 |
0.0346 |
99.90 |
3.2. Electrochemical impedance spectroscopy
Impedance measurements were performed under potentiostatic conditions after 1 h of immersion. Nyquist plots of uninhibited and inhibited solutions containing different concentrations of inhibitor molecules were performed over the frequency range from 1 to 10![[thin space (1/6-em)]](https://www.rsc.org/images/entities/char_2009.gif) 000 Hz and are shown in Fig. 3. The similarity in the shapes of these graphs throughout the experiment indicates that the addition of inhibitor molecules does not cause any noticeable change in the corrosion mechanism.21 The Nyquist diagrams show one capacitive loop at high frequencies and the corresponding Bode phase plot shows one capacitive time constant as shown in Fig. 3a–c and Fig. 4a–c.
000 Hz and are shown in Fig. 3. The similarity in the shapes of these graphs throughout the experiment indicates that the addition of inhibitor molecules does not cause any noticeable change in the corrosion mechanism.21 The Nyquist diagrams show one capacitive loop at high frequencies and the corresponding Bode phase plot shows one capacitive time constant as shown in Fig. 3a–c and Fig. 4a–c.
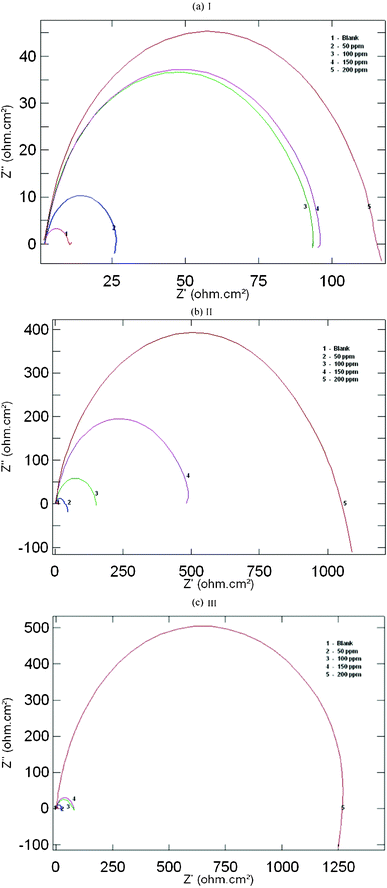 |
| | Fig. 3 Nyquist plots for mild steel in 1 M HCl containing different concentrations of (a) AMTDT (b) ATTDT and (c) ABTDT. | |
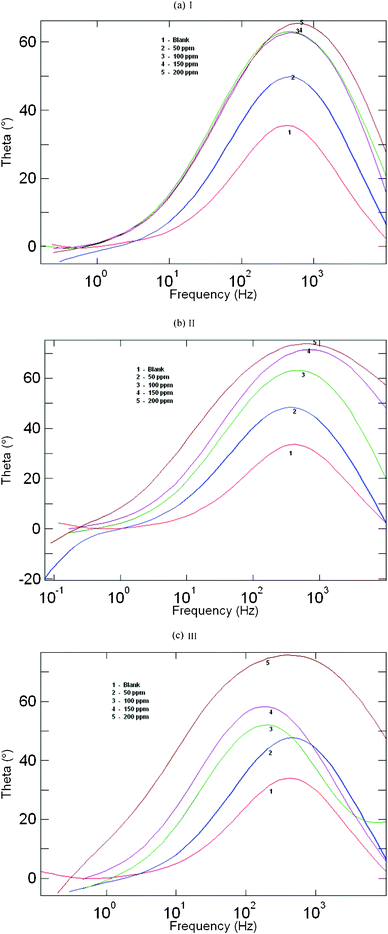 |
| | Fig. 4 Bode plots for mild steel in 1 M HCl containing different concentrations of (a) AMTDT (b) ATTDT and (c) ABTDT. | |
The capacitive loop at high frequencies represents the phenomenon associated with the electrical double layer. The above impedance diagrams (Nyquist) contain depressed semicircles with the centre under the real axis. Such behavior is characteristic of solid electrodes and often referred to frequency dispersion, attributed to different physical phenomena such as roughness, inhomogeneities of the solid surfaces, impurities, grain boundaries, and distribution of surface active sites. The ideal capacitive behavior is not seen in this case and hence a constant phase element CPE is introduced in the circuit to give a more accurate fit.22–24 The mechanism of corrosion remains unaffected during the addition of inhibitor molecules. The simplest fitting is represented by Randle's equivalent circuit (Fig. 5), which is a parallel combination of the charge-transfer resistance (Rct) and the constant phase element (CPE), both in series with the solution resistance (Rs). The impedance function of a CPE can be represented as:
where
A is the CPE constant (in Ω
−1 S
n cm
−2),
j2 = −1,
ω is the angular frequency (
ω = 2π
f where
f is the angular frequency) and
n is the CPE component which gives details about the degree of surface inhomogenity.
25,26
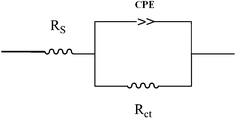 |
| | Fig. 5 Equivalent circuits used to fit for the EIS data of mild steel in 1 M HCl. | |
Evaluation of Table 2 shows that the values of Rct and Cdl have opposite trend at the whole concentration range and may be due to the formation of a protective layer on the surface of the electrode. The double layer between the charged metal surface and the solution is considered as an electrical double capacitor. The adsorption of inhibitor molecules on the mild steel surface decreases its electrical capacity through the displacement of water molecules and other ions originally adsorbed on the metal surface.27 The increase in the thickness of the protective layer and decrease in the value of Cdl with increase in inhibitor concentration shows the inhibitor molecules electrostatically adsorb on the electrode surface. This trend is in accordance with Helmholtz model given by eqn (3):
| |  | (3) |
where
d is the thickness of the protective layer,
ε is the dielectric constant of the medium,
ε0 is the vacuum permittivity and
A is the surface area of the electrode. The charge transfer resistance is increased from 8.05 for
inhibitor free solution to 113.43, 1021.01 and 1299.07 μF cm
−2 upon addition of 200 ppm of AMTDT, ATTDT and ABTDT resulting in 92.90, 99.21 and 99.38% inhibition efficiency. The increase in
Rct value is attributed to the formation of an insulating protective film at the metal/solution interface.
28,29 The double layer capacitance decreases from 562.60 to 66.08, 26.47 and 23.50 Ω cm
2 in the presence of 200 ppm of AMTDT, ATTDT and ABTDT. The initial decrease in
Cdl value from blank solution to electrolyte containing
inhibitor may be due to a decrease in the local dielectric constant, while further decrease in
Cdl with increasing concentrations of the
inhibitor is due to increase in the thickness of the electrical double layer.
30 The equation used for calculating the percentage inhibition efficiency is:
| |  | (4) |
where
Rct* and
Rct are values of the charge transfer resistance observed in the presence and absence of
inhibitor molecules. Impedance parameters are summarized in
Table 2.
Table 2 Impedance parameters and inhibition efficiency for of mild steel in 1 M HCl with different concentrations of triazine derivatives
| Inhibitor |
Conc./ppm |
R
ct/Ω cm−2 |
CPE/μF cm2 |
I
corr/mA cm−2 |
CR/mm yr−1 |
n
|
IE (%) |
| — |
— |
8.05 |
562.60 |
3.2042 |
37.5540 |
0.80 |
— |
| AMTDT |
50 |
25.20 |
152.10 |
1.0351 |
11.9971 |
0.88 |
68.05 |
| |
100 |
93.07 |
96.49 |
0.2803 |
3.2486 |
0.85 |
91.34 |
| |
150 |
95.71 |
95.05 |
0.2723 |
3.1563 |
0.84 |
91.58 |
| |
200 |
113.43 |
66.08 |
0.2300 |
2.6662 |
0.86 |
92.90 |
| |
| ATTDT |
50 |
32.73 |
181.70 |
0.7970 |
9.2376 |
0.86 |
75.40 |
| |
100 |
149.60 |
60.56 |
0.1744 |
2.0211 |
0.87 |
94.62 |
| |
150 |
496.91 |
24.49 |
0.0525 |
0.6084 |
0.86 |
98.37 |
| |
200 |
1021.01 |
26.47 |
0.0255 |
0.2961 |
0.84 |
99.21 |
| |
| ABTDT |
50 |
48.09 |
112.17 |
0.5424 |
6.2871 |
0.88 |
83.25 |
| |
100 |
68.68 |
183.43 |
0.3798 |
4.4022 |
0.85 |
88.27 |
| |
150 |
77.10 |
177.21 |
0.3835 |
3.9215 |
0.88 |
89.55 |
| |
200 |
1299.07 |
23.50 |
0.0200 |
0.2327 |
0.84 |
99.38 |
3.3. Quantum chemical calculations
The molecular sketches of the inhibitors were drawn using Gauss View 3.0. All the quantum chemical calculations were performed with complete geometry optimization using a standard Gaussian 03 software package. Geometry optimization and quantum chemical calculations performed using density functional theory (DFT). The Becke three-parameter hybrid functional was combined with the Lee, Yang and Parr (LYP) correlation functional and denoted as B3LYP and was employed in the DFT calculations using 6-31G(d,p) basis set. Molecular orbitals are designated with respect either to the HOMO or LUMO orbital.31–34 HOMO−n correspond to the nth orbital below the HOMO and LUMO orbitals and are shown in Fig. 6.
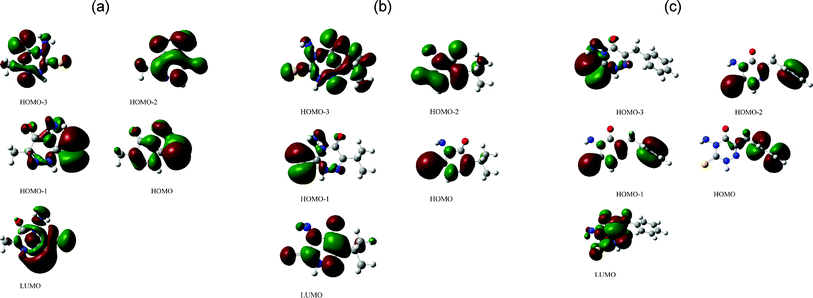 |
| | Fig. 6 Frontier molecular orbitals of (a) AMTDT (b) ATTDT and (c) ABTDT, in particular HOMO−3, HOMO−2, HOMO−1, HOMO and LUMO are plotted; isosurface = ±0.04 (e bohr−3)1/2. | |
There are two different definitions used for the chemical hardness, η that differ by a factor of two.35 This affects all other electronic parameters that depend on η. We use the definition based on the following two equations:
| |  | (5) |
where
E is the total energy of the system,
N is the number of electrons, and
μ is the electronic chemical potential. The other definition drops the factor ½ from the definition of
η. The HSAB parameters can be derived by
eqn (5) by using finite difference approximation for the first and second eigenvalues of HOMO and LUMO, –
EHOMO and –
ELUMO, for the ionization potential and electron affinity.
36,37 The electronegativity,
χ, is the negative of chemical potential and hence given by:
| χ = −μ ≈ −1/2(EHOMO + ELUMO) |
while chemical hardness,
η is approximated by:
The work function Φ of the metal surface is taken as electronegativity; whereas chemical hardness is neglected, because η of the bulk metal is inverse of their density state at the Fermi level which is an exceedingly small number. The number of electrons transferred from the molecule to metal ΔN, will be given by eqn (6):
| |  | (6) |
where Fe is considered as a Lewis acid according to the HSAB concept.
38 The difference in electronegativity drives the electron transfer, and the sum of the hardness parameters act as a resistance. In order to calculate the fraction of electrons transferred, a theoretical value for the electronegativity of bulk iron was used
χFe ≈ 7 eV, and a global hardness of
ηFe ≈ 0, by assuming that for a metallic bulk
I =
A (where
I is the ionization energy and
A is the electron affinity)
39,40 because they are softer than the neutral metallic atoms. From
Table 4 it is evident that the fraction of electrons transferred Δ
N, will be higher for ATTDT than ABTDT and AMTDT. Some of the calculated electronic parameters such as the highest occupied (
EHOMO) and lowest unoccupied (
ELUMO) molecular orbital energies, the energy gap (Δ
E =
ELUMO −
EHOMO), and the dipole moment are presented in
Table 3.
EHOMO is often associated with the electron donating ability of
inhibitor molecules to the unoccupied d orbital of a metal. Thus, the less negative values of
EHOMO and, similarly, the lower value of the gap energy should both increase the effectiveness of inhibition. The low value of dipole moment has often been associated with good inhibition properties.
41,42 The dipole moment calculated for AMTDT, ATTDT and ABTDT are quite close, the direction of their dipoles are similar and they are projected to the molecular plane. The direction of the dipole can be understood by considering the electrostatic potential (middle and right panels of
Fig. 7), which discerns electron density rich regions centred on the triazine ring, indicating the preferred zone for nucleophilic attack. Dipole moments are substantially enhanced for both
inhibitors on going from the gaseous (G) to the aqueous (A) phase, indicating an increase in the stability of the
inhibitors due to the interaction with
water.
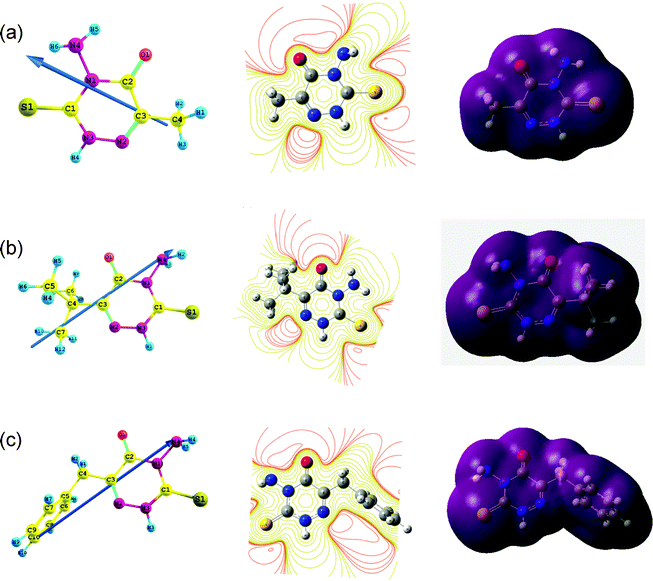 |
| | Fig. 7 Electrostatic properties of (a) AMTDT (b) ATTDT and (c) ABTDT: side views of the dipole are displayed on the left while the middle and right panels show the contour and isosurface representation of electrostatic potential respectively. | |
Table 3 Orbital energies for HOMO, LUMO, HOMO–LUMO gap energy (ΔE) and dipole moments (μ) of AMTDT, ATTDT and ABTDT in the gaseous (G) and aqueous (A) phases
| Species |
Phase |
E
HOMO/eV |
E
LUMO/eV |
ΔE/eV |
Dipole moment (D) |
| AMTDT |
G |
−2.3578 |
−6.4997 |
4.1419 |
1.9863 |
| |
A |
−2.2093 |
−6.4850 |
4.2487 |
3.8326 |
| |
| ATTDT |
G |
−2.2806 |
−6.3402 |
4.0596 |
2.3866 |
| |
A |
−2.2046 |
−6.4891 |
4.2845 |
3.1713 |
| |
| ABTDT |
G |
−2.3205 |
−6.4882 |
4.1677 |
2.1850 |
| |
A |
−2.1981 |
−6.5035 |
4.3054 |
3.1457 |
Table 4 Electronegativity (χ), global hardness (η) and proportion of electrons transferred (ΔN) of AMTDT, ATTDT and ABTDT
| Species |
Phase |
χ
|
η
|
ΔN |
| AMTDT |
G |
4.4287 |
2.0709 |
0.6207 |
| |
A |
4.3471 |
2.1378 |
0.6204 |
| |
| ATTDT |
G |
4.3104 |
2.0298 |
0.6625 |
| |
A |
4.3468 |
2.1422 |
0.6192 |
| |
| ABTDT |
G |
4.4043 |
2.0838 |
0.6228 |
| |
A |
4.3508 |
2.1527 |
0.6153 |
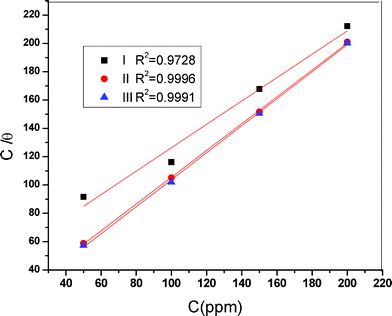
The selection of these inhibitor molecules are based on their mechanism of action, for example their ability to donate electrons.43 Corrosion inhibition features of several substances are directly associated with adsorption phenomena, which can follow different types of adsorption isotherms such as Temkin, Langmuir, Freundlich and Frumkin that have been employed to measure adsorption phenomena over steel electrodes. The surface coverage θ was calculated from eqn (7):
The adsorption of inhibitor at an electrode/electrolyte interface may take place through displacement of adsorbed water molecules at the inner Helmholtz plane of the electrode, likely in agreement with the following reaction scheme:
| Orgaq + xH2Oads ↔ Orgads + xH2Oaq |
where
x is the number of
water molecules displaced by one molecule of organic
inhibitor molecule.
44 Adsorption phenomenon also provides information about the interaction among the adsorbed molecules themselves as well as their interaction with the electrode surface. By far the best fit is obtained with the Langmuir isotherm (
C vs. C/
θ) and is shown in
Fig. 8.
4. Conclusions
1. The inhibitor molecules show very good inhibitive efficiency for mild steel in 1 M HCl
2. The polarization plots indicated that the compounds inhibit both anodic metal dissolution and cathodic hydrogen evolution reaction and act as mixed type inhibitors.
3. EIS plots indicated that the inhibitor increases the charge transfer resistance and the inhibitive performance depended on the adsorption of the triazine derivatives on the metal surface.
4. This adsorption process obeyed the Langmuir isotherm.
5. The fraction of electrons transferred, ΔN, can not be taken as a direct theoretical measurement of the inhibition efficiency. Hence change in the geometry of the molecule during adsorption is also considered theoretically and these values agree reasonably well with experimental results.
Acknowledgements
One of the authors (S. J.) is grateful to CSIR New Delhi for providing a senior research fellowship.
References
- S. John, B. Joseph, K. K. Aravindakshan and A. Joseph, Mater. Chem. Phys., 2010, 122, 374–379 CrossRef CAS.
- S. John, B. Joseph, K. V. Balakrishnan, K. K. Aravindakshan and A. Joseph, Mater. Chem. Phys., 2010, 123, 218–224 CrossRef CAS.
- A. Fiala, A. Chibani, A. Darchen, A. Boulkamh and K. Djebbar, Appl. Surf. Sci., 2007, 253, 9347–9356 CrossRef CAS.
- F. Zucchi, G. Trabanelli and C. Monticelli, Corros. Sci., 1996, 38, 147–154 CrossRef CAS (Notoya and Poling 1976).
- J. P. Chopart, J. Douglade, P. Fricoteaux and A. Olivier, Electrochim. Acta, 1991, 36, 459–463 CrossRef CAS.
- M. D. Pritzker and T. Z. Fahidy, Electrochim. Acta, 1992, 37, 103–112 CrossRef CAS.
- S. Magiano, Electrochim. Acta, 1997, 42, 377–382 CrossRef.
- S. Krzewska, Electrochim. Acta, 1997, 42, 3531–3540 CrossRef CAS.
- C. H. Pyun and Su-M. Park, J. Electrochem. Soc., 1986, 133, 2024–2030 CrossRef CAS.
- E. E. Oguize, Y. Li, S. G. Wang and F. Wang, RSC Adv., 2011, 1, 866–873 RSC.
- J. M. Bastidas, J. D. Damborenea and A. J. Vazquez, J. Appl. Electrochem., 1997, 27, 345–349 CrossRef CAS.
- A. M. Fekry and M. A. Ameer, Int. J. Hydrogen Energy, 2011, 36, 11207–11215 CrossRef CAS.
- A. Kokalj, Electrochim. Acta, 2010, 56, 745–755 CrossRef CAS.
- A. D. Becke, J. Chem. Phys., 1993, 98, 1371–1377 Search PubMed.
- E. Cances, B. Mennucci and J. Tomasi, J. Chem. Phys., 1997, 107, 3032–3041 CrossRef CAS.
- B. Mennucci and J. Tomasi, J. Phys. Chem. B., 2004, 70, 205212–205221 Search PubMed.
- J. Tomasi, B. Mennucci and R. Cammi, Chem. Rev., 2005, 105, 2999–3094 CrossRef CAS.
- E. E. Ebenso, T. Arslan, F. Kandemirli, N. Caner and I. Love, Int. J. Quantum Chem., 2009, 110, 1003–1018 CrossRef.
- R. Solmaz, G. Kardas, M. Culha, B. Yazici and M. Erbil, Electrochim. Acta, 2008, 53, 5941–5952 CrossRef CAS.
- R. Fuchs-Godec, Colloids Surf., A, 2006, 280, 130–139 CrossRef CAS.
- A. Chetouani, B. Hammouti, T. Benhadda and M. Daoudi, Appl. Surf. Sci., 2005, 249, 375–385 CrossRef CAS.
- N. Labjar, M. Lebrini, F. Bentiss, N. E. Chihib, S. E. Hajjaji and C. Jama, Mater. Chem. Phys., 2010, 119, 330–336 CrossRef CAS.
- M. A. Amin, S. S. AbedEl-Rehim, E. E. F.El-Sherbini and R. S. Bayyomi, Electrochim. Acta, 2007, 52, 3588–3600 CrossRef CAS.
- M. A.Veloz and I. Gonzalez, Electrochim. Acta, 2002, 48, 135–144 CrossRef.
- E. M. Sherif and S. M. Park, Electrochim. Acta, 2006, 51, 1313–1321 CrossRef CAS.
-
R. Macdonald and D. R. Franceshetti, Impedance Spectroscopy, Wiley, New York, 1987 Search PubMed.
- M. Outirite, M. Lagrenee, M. Lebrini, M. Traisnel, C. Jama, H. Vezin and F. bentiss, Electrochim. Acta, 2010, 55, 1670–1681 CrossRef CAS.
- D. A. Lopez, S. N. Simison and S. R. de Sanchez, Electrochim. Acta, 2003, 48, 845–854 CrossRef CAS.
- K. F. Khaled and M. M. Al-Qahtani, Mater. Chem. Phys., 2009, 113, 150–158 CrossRef CAS.
- M. R. Saleh and A. M. Shams El Din, Corros. Sci., 1972, 12, 689–697 CrossRef.
- M. K. Awad, R. M. Issa and F. M. Atlam, Mater. Corros., 2009, 60, 813–819 CrossRef CAS.
- W. Li, X. Zhao, F. Liu, J. Deng and B. Hou, Mater. Corros., 2009, 60, 287–293 CrossRef CAS.
- R. Hasanov, M. Sadikoglu and S. Bilgic, Appl. Surf. Sci., 2007, 253, 3913–3921 CrossRef CAS.
- M. A. Amin, K. F. Khaled and S. A. Fadl-Allah, Corros. Sci., 2010, 52, 140–151 CrossRef CAS.
- M. Finsgar, A. Lesar, A. Kokalj and I. Milosev, Electrochim. Acta, 2008, 53, 8287–8929 CrossRef CAS.
- R. G. Pearson, Inorg. Chem., 1988, 27, 734–740 CrossRef CAS.
- R. G. Pearson, J. Am. Chem. Soc., 1963, 85, 3533–3539 CrossRef CAS.
- K. F. Khaled and M. A. Amin, Corros. Sci., 2009, 51, 1964–1975 CrossRef CAS.
- K. Babic-Samardzija, C. Lupu, N. Hackerman and A. R.Barron, J. Mater. Chem., 2005, 15, 1908–1916 RSC.
- P. Zhao, Q. Liang and Y. Li, Appl. Surf. Sci., 2005, 252, 1596–1607 CrossRef CAS.
- H. L. Wang, H. B. Fan and J. S. Zheng, Mater. Chem. Phys., 2003, 77, 655–661 CrossRef CAS.
- A. K. Singh and M. A. Quraishi, J. Appl. Electrochem., 2010, 40, 1293–1306 CrossRef CAS.
- M. A. Ameer and A. M. Fekry, Int. J. Hydrogen Energy, 2010, 35, 11387–11396 CrossRef CAS.
- A. A. El-Meligi, Int. J. Hydrogen Energy, 2011, 36, 10600–10607 CrossRef CAS.
|
| This journal is © The Royal Society of Chemistry 2012 |
Click here to see how this site uses Cookies. View our privacy policy here. 


![[thin space (1/6-em)]](https://www.rsc.org/images/entities/char_2009.gif) 000 Hz and are shown in Fig. 3. The similarity in the shapes of these graphs throughout the experiment indicates that the addition of inhibitor molecules does not cause any noticeable change in the corrosion mechanism.21 The Nyquist diagrams show one capacitive loop at high frequencies and the corresponding Bode phase plot shows one capacitive time constant as shown in Fig. 3a–c and Fig. 4a–c.
000 Hz and are shown in Fig. 3. The similarity in the shapes of these graphs throughout the experiment indicates that the addition of inhibitor molecules does not cause any noticeable change in the corrosion mechanism.21 The Nyquist diagrams show one capacitive loop at high frequencies and the corresponding Bode phase plot shows one capacitive time constant as shown in Fig. 3a–c and Fig. 4a–c.


