Different catalytic behavior of amorphous and crystalline cobalt tungstate for electrochemical water oxidation†‡
Hongfei
Jia
*a,
Jason
Stark
a,
Li Qin
Zhou
a,
Chen
Ling
a,
Takeshi
Sekito
b and
Zachary
Markin
a
aMaterials Research Department, Toyota Research Institute of North America, 1555 Woodridge Ave., Ann Arbor, MI 48105, USA. E-mail: hongfei.jia@tema.toyota.com; Tel: +1-734-995-0183; Fax: +1-734-995-2549
bAdvanced Material Engineering Division, Toyota Motor Corporation 1200, Mishuku, Susono, Shizuoka, 410-1193, Japan
First published on 10th September 2012
Abstract
Amorphous and crystalline cobalt tungstate (CoWO4) particles, synthesized by solution co-precipitation and subsequent heat treatment, were examined on rotating disk electrodes as water oxidation catalysts. In close to neutral electrolyte (0.2 M Na2WO4, pH 8.0), amorphous CoWO4 exhibited much higher catalytic activity than its crystalline counterpart over an overpotential range of 0.25 to 0.45 V. Calculated Tafel slopes are ∼60 mV per decade for amorphous and ∼110 mV per decade for crystalline electrodes, while the exchange current density of crystalline catalysts is two orders of magnitude higher than that of amorphous. Elemental analysis did not identify substantial composition changes in either amorphous or crystalline films on indium tin oxide (ITO) electrodes, after being used for multiple cyclic voltammetry and bulk electrolysis tests. However, X-ray photoelectron spectroscopy (XPS) revealed that the oxidation state of the surface Co atoms on amorphous catalyst film changed from +2 to +3, although no difference was found in crystalline CoWO4 . The characteristics of the amorphous catalyst closely resemble the well known self-repairing cobalt phosphate catalytic film (Co–Pi), in which the cooperative interaction of adsorbants on neighboring Co sites plays an important role in its high activity. In the case of crystalline CoWO4, density functional theory (DFT) calculations showed that its most stable surface should be along the (010) plane, featuring Co atoms located at least 4.69 Å apart, which is significantly larger than the reported 2.82 Å in the cubane structure of Co–Pi. We believe this longer interatomic span hinders the adsorbant interaction and thus results in a different mechanism for oxygen evolution on the surface of crystalline CoWO4.
Introduction
Efficient co-catalysts are of great importance to artificial photosynthesis, photochemical and photoelectrochemical water splitting in the synthesis of solar fuels.1 It has been demonstrated extensively that catalysts such as RuO2, NiO and Pt can efficiently catalyze H2 and O2 evolution on photocatalysts for water splitting.2 Very often the role of co-catalysts is so critical that they actually enable the function of photocatalysts or photoelectrodes. Indeed, even in the first report of overall water splitting using TiO2 photoelectrodes,3 Pt was used as a cathode catalyst because the conduction band edge of TiO2 could not provide enough overpotential to drive hydrogen evolution. More recently, Meada et al. reported that overall water splitting on a solid solution of GaN and ZnO was only observed in the presence of rhodium/chromium oxide as co-catalysts.4–6 A similar enabling effect was also found in the photoreduction of CO2 to formate on N-Ta2O5, GaP and InP, with the help of Ru complex electrocatalysts.7Although a wide variety of fabrication methods have been utilized to couple co-catalysts with photocatalysts and photoelectrodes, most previously reported systems adapted hetero-structures composed of catalyst islands or films on the photo-active materials. Improvements in the dispersion of the co-catalysts has been suggested as a reasonable path to further enhance performance.8 The extreme of this strategy would be a homogeneous structure with catalytic sites evenly distributed within the light-absorbing matrix. Although a few attempts have been made,9–11 the effectiveness of such a conceptual design remains largely unclear. To further explore the feasibility of this configuration, cobalt tungstate (CoWO4) was chosen as the model compound for our initial investigation.
Crystalline CoWO4 belongs to the mineral group of wolframite, with a structure consisting of hexagonal close packed oxygen atoms with octahedral sites orderly filled by Co2+ and W6+ cations.12,13 Compared to tungsten oxide, CoWO4 has a slightly narrower direct band gap (2.7 eV) and a much smaller indirect band gap (below 2 eV).14,15 Recently CoWO4 thin films were spray-deposited on fluorine doped tin oxide electrodes and used as the photoanode in a photovoltaic electrochemical cell.14 The electrodes appeared to be stable in an acidic electrolyte of 0.1 M HClO4. In a different study by Montini et al.,15 the photocatalytic activity of CoWO4 for decomposing methylene blue was examined along with several other metal tungstates. Although there has been no previous report of using CoWO4 as a photoanode for water oxidation, its potential in photoactive materials has been demonstrated.
In addition to its optical and photocatalytic properties, CoWO4 also attracted our attention because cobalt-based catalysts have recently been center stage in the development of low-cost water oxidation catalysts.16–18 Since the report of self-repairing cobalt phosphate catalytic films (Co–Pi),19 many new advances have been made, including Co3O4 nanoclusters which display an extremely high turnover rate,20 a robust molecular catalyst based on cobalt-cored polyoxometalate,21 and more recently a perovskite oxide (Ba0.5Sr0.5Co0.8Fe0.2O3) which has one order of magnitude higher intrinsic activity than IrO2 in alkaline electrolyte.22 The mechanism of water oxidation on cobalt-containing catalyst film has been extensively investigated and discussed.16,18,23–27 Significant improvements in electrode performance were demonstrated by applying catalyst films on Fe2O3,28–31 WO3,32,33 ZnO34 and Si35,36 photoanodes as co-catalysts. Surprisingly, the potential of CoWO4 for electrochemical and photoelectrochemical water oxidation is largely unknown. To our best knowledge, it has only appeared in two studies related to water oxidation: one for mechano-catalytic overall water splitting,37 and the other as a catalyst for a dye-assisted photocatalytic water oxdiation reaction using persulfate as the sacrificial oxidant.38 In this study, we examined the electrochemical activity of CoWO4 for water oxidation and herein report a significant difference in catalytic behavior observed between amorphous and crystalline CoWO4.
Experimental
Synthesis and characterization of physical properties
Cobalt tungstate was prepared by adding equal volume and concentration of Na2WO4 dropwise into Co(NO3)2 solution under strong magnetic stirring. The precipitates were rinsed thoroughly with deionized water in a centrifuge, and then dried overnight at 35 °C in a vacuum oven. The resulting CoWO4 powder was further processed in a tube furnace for 1 h under argon at temperatures ranging from 200 to 500 °C. All the samples were manually ground for 15 min, prior to further analysis and use as electrode catalysts.The physical properties of the CoWO4 particles were studied using various analytical techniques, including powder X-ray diffraction (XRD), transmission electron microscopy (TEM), scanning electron microscopy with X-ray energy dispersive spectroscopy (SEM/EDS), X-ray photoelectron spectroscopy (XPS), nitrogen adsorption and desorption (BET specific surface area) and UV–Visible spectroscopy. See the Electronic Supplementary Information (ESI)‡ for further details of the synthetic and analytical procedures.
Electrochemical analysis
Cyclic voltammetry (CV), Tafel plot and electrolyte pH dependence of the catalytic characteristics were examined on rotating disk electrodes (RDEs) following a previously reported protocol.22,39,40 In short, to fabricate a working electrode, a catalyst ink was first prepared by sonicating a mixture of catalyst particles, acid-treated carbon black (CB), Na+-exchanged Nafion® solution with tetrahydofuran, and then drop-casting (10 μL) onto pre-polished glassy carbon disk electrodes (5 mm in diameter). The catalyst film was allowed to dry at room temperature in a sealed container overnight and the final composition of the film was expected to be 250, 50 and 50 μg cm−2 for CoWO4, CB and Nafion®, respectively. The electrochemical measurements were done in a three-electrode glass cell (125 ml) with the working electrode rotating at a rate of 1600 rpm, and Ag/AgCl (3M NaCl) as the reference (ESI, Fig. S1(a)‡). All electrode potentials reported in this study were converted in reference to normal hydrogen electrode (NHE) for easy discussion and comparison with previous literature. The counter electrode (Pt coil) was isolated from the main electrochemical cell using a fritted glass tube. The electrolyte, unless specified, consisted of 0.2 M Na2WO4, the pH of which was adjusted using NaOH or HNO3 solutions. It served well as buffer in the range of 6.5–8, as determined by pH titration (ESI, Fig. S2‡). During the electrochemical tests, the electrolyte was continuously purged and masked with ultra high purity oxygen.Bulk electrolysis studies were performed in a different, air-tight electrochemical cell (ESI Fig. S1(b)‡), which allows the analysis of O2 product from the headspace. The working electrodes used in this cell were fabricated by dip-coating amorphous CoWO4 nanoparticles (from 1-butanol suspension, 2.5 mg ml−1) on ITO glass slides. Some of the electrodes were further processed at 500 °C (1 h, under Ar) to crystalize the catalyst films. For Faraday efficiency measurement, an optical oxygen sensor (Ocean optics, Foxy-R) was installed in the headspace of the working electrode chamber to monitor the formation of the O2 product. To investigate the difference between CoWO4 before and after being used as electrode catalyst, freshly prepared amorphous and crystalline electrodes were subjected to 30 cycles of CV scans (0.71–1.51 V, 100 mV s−1), followed by 30 min of potentiostatic electrolysis at 1.36 V. Further details of the experimental set up and testing conditions are given in the ESI‡.
DFT calculations
The surface property of crystalline CoWO4 was investigated with DFT calculations. The calculations were performed with the Vienna Ab-initio Simulation Package (VASP) using projector augmented wave (PAW) pseudopotential and the exchange–correlation functionals parametrized by Perdew, Burke, and Ernzerhof for the generalized gradient approximation (GGA).41–44 All surfaces were modeled with supercells containing two layers of atoms fixed at their bulk phase position, two layers of atoms allowed to relax and a 20 Å thick vacuum layer. Numerical convergence to about 2 meV per formula unit was ensured by using a cutoff energy 500 eV and appropriate Gamma centered k-point meshes.Results
Characterization of materials properties
Several approaches to the preparation of CoWO4 nanoparticles have been previously reported, including hydrothermal,12,45,46 spray pyrolysis,14 and solution precipitation.15,47 In this study, CoWO4 was synthesized by directly mixing Na2WO4 and Co(NO3)2 in solution without using any surfactant. The precipitated purple slurry of CoWO4 particles was first rinsed with deionized water, and then processed by heat treatment at temperatures ranging from 200 to 500 °C under Ar. Based on XRD patterns shown in Fig. 1, as-synthesized samples and those processed at, or below, 350 °C are amorphous, and those treated at temperatures ≥400 °C are crystalline. All the peaks of the crystalline samples can be assigned to monoclinic CoWO4 (PDF 00-015-0867), consistent with the results from previous literature.14,15,46,48 Detailed indexing is shown in ESI, Fig. S3‡.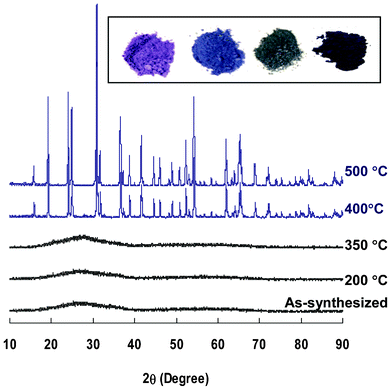 | ||
| Fig. 1 Powder XRD patterns of selected CoWO4 particles heat-treated for 1 h at different temperatures. Inserted photos of CoWO4 samples (from left): as-synthesized, 350, 400 and 500 °C. | ||
Fig. 2 shows the SEM and TEM images of CoWO4 powders processed at 200 and 500 °C. TEM-selected area electron diffraction confirms that these two samples were amorphous and crystalline, respectively. Grain growth during crystallization was evident, as the crystalline particles are much bigger in size and have smoother surfaces than the amorphous. In addition, a decrease in specific surface area was confirmed by nitrogen adsorption/desorption analysis (BET method). The amorphous powders typically have BET specific surface area in the range of 14–18 m2 g−1, however, after crystallization this reduced to 4–5 m2 g−1 (ESI, Fig. S4‡).
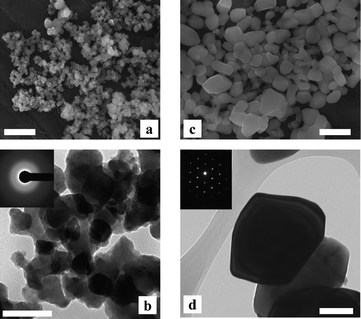 | ||
| Fig. 2 SEM (top) and TEM (bottom) images of CoWO4 particles processed at 200 °C (a, b) and 500 °C (c, d). Inserts: selected area electron diffraction patterns. Scale bars: 500 nm for SEM and 100 nm for TEM images. | ||
As-synthesized CoWO4 has a bright purple color. After heat treatment, its color changed substantially depending on the processing temperature (Fig. 1, inserted photos). UV–Vis spectra show that both amorphous and crystalline CoWO4 have broad adsorption peaks in the range of 500–650 nm (ESI, Fig. S5‡), indicating they could be favorable materials for absorbing visible light. The spectra of the crystalline CoWO4 is slightly red-shifted compared to that of the amorphous samples, which may have contributed to the color differences.
Electrochemical water oxidation on rotating disk electrodes
Catalytic activities of amorphous and crystalline CoWO4 particles were tested on rotating disk electrodes (RDEs) to minimize the impact of mass transfer limitation. The specific protocol used in this study, involving the formation of a thin composite catalyst film on a glassy carbon disk electrode, has been proven as a reliable approach to determine the activity of oxide catalysts for both oxygen reduction and evolution reactions.22,39,40 All electrodes tested in this study, unless specified, contain 50 μg of CoWO4 per electrode disk (5 mm in diameter), or 250 μg per cm2 of projected electrode area.The working electrodes, after curing in air overnight, were first subjected to multiple cycles of CV scans in pH 8.0, 0.2 M Na2WO4 electrolyte. Fig. 3 compares the CVs obtained from representative amorphous and crystalline electrodes to a control electrode without catalyst. Clearly both amorphous and crystalline CoWO4 are catalytically active, although the amorphous electrode seems to be much more efficient. On the voltammogram of the amorphous electrode, there is an anodic (oxidation) peak preceding the major catalytic wave during forward scans (potential low to high). This shoulder peak is substantial at the first scan (black line) and eventually diminishes after multiple scans. A broad cathodic peak at 0.84 V can be identified from the first backward scan (Fig. 3, insert), which becomes narrower and is also shifted to a higher potential (1.01 V) in the following scans. Quasi-reversible redox peaks are commonly seen from amorphous cobalt catalytic films prepared from electrodeposition.19,25,49 According to a Pourbaix diagram established by Gerken et al.,50 two possible redox couples may account for the observed pre-waves (eqn (1) and (2)):
| Coaq2+ ↔ HCoO2 + 3H+ + e− | (1) |
| 2 HCoO2 ↔ HCo2O4+ H+ + e− | (2) |
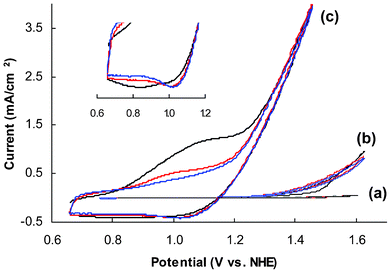 | ||
| Fig. 3 Representative CVs of glassy carbon electrodes coated with (a) carbon black (CB) and Nafion® film (control), (b) CB, Nafion® and crystalline CoWO4 (treated at 500 °C), and (c) amorphous CoWO4 (treated at 200 °C). Insert: zoom-in view of the cathodic waves of (c). Black, red and blue lines represent the first, second and third scan, respectively. Electrolyte: 0.2 M NaWO4, pH 8.0; scan rate: 15 mV s−1. | ||
However, none of these redox features were observed from the voltammograms of the crystalline electrode (see ESI, Fig. S6 for enlarged voltammogram‡).
Steady-state current outputs from electrodes containing CoWO4 processed at six different temperatures (200–500 °C) were measured over an overpotential range from 0.25 V to 0.45 V at steps of 25 mV. Fig. 4 shows their polarization characteristics as Tafel plots, η = blog(j/j0), where η is the internal resistance compensated overpotential, b the Tafel slope (mV per decade), j the electrode current density and j0 the exchange current density. In this format, the Tafel slope reflects rate limiting reaction kinetics and the exchange current density is often used as an indicator of the “intrinsic” activity of the catalysts. As summarized in Table 1, the amorphous catalysts (processing temperature ≤350 °C) all have a Tafel slope of ca. 60 mV per decade, while the crystalline catalysts show higher slopes of 112–115 mV per decade. This difference strongly suggests that distinctive reaction mechanisms might have been involved at the rate-limiting step of the water oxidation process. Over the tested overpotential range of 0.25–0.45 V, amorphous catalysts were apparently more active in terms of generating higher currents under the same overpotentials. However, the exchange current densities of the crystalline catalysts were about 2 orders of magnitude higher. It is worth noting that, due to the lack of a reliable method to determine the area of electrochemically active surface, BET surface areas of the catalysts were used to calculate the exchange current densities. This may introduce considerable errors into the calculation.
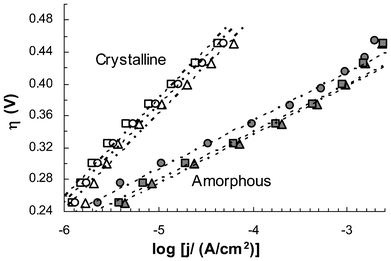 | ||
| Fig. 4 Tafel plots of electrodes containing CoWO4 catalysts processed at 200 (▴), 300 (■), 350 (•), 400 (O), 450 (△) and 500 °C (□). Each data point represents an average of three independent measurements. Error bars are not shown to give a better view of the trend lines (see ESI, Fig S7‡ for plots with error bars). Current density (j) is based on projected electrode area. All electrodes were preconditioned by 5 cycles of CV scans prior to polarization study. Internal resistance was compensated at 53 and 39 Ω for amorphous and crystalline electrodes, respectively. Electrolyte: 0.2 M NaWO4, pH 8.0. | ||
| Sample process T (°C) | Specific surface area (BET, m2 g−1) | Tafel slopea (mV per decade) | Exchange current densityb (10−11 A cm−2) |
|---|---|---|---|
| a Tafel slope was calculated by fitting the linear segments of the polarization curves. b BET surface area was used in the calculation of exchange current density. c Amorphous CoWO4; d Crystalline CoWO4. | |||
| 200c | 16.3 | 61 | 3.8 × 10⁻¹¹ |
| 300c | 14.6 | 60 | 2.9 × 10⁻¹¹ |
| 350c | 14.2 | 60 | 1.6 × 10⁻¹¹ |
| 400d | 4.5 | 112 | 2.4 × 10⁻⁹ |
| 450d | 5.1 | 115 | 1.9 × 10⁻⁹ |
| 500d | 4.4 | 115 | 2.5 × 10⁻⁹ |
To further examine the difference between amorphous and crystalline CoWO4, two samples, treated at 200 and 500 C respectively, were selected for additional study of the pH dependence of their steady-state electrode potential and current. At a constant current of 30 μA cm−2 (based on projected electrode area), galvanostatic titration was performed over a range of pH from 5 to 12 (Fig. 5, left). A slope of 65 mV pH−1 was observed on both amorphous and crystalline electrodes. There is a small deviation of the linear trend in the range of pH 7.5–9.5, especially for the amorphous electrode. Steady state current was recorded at an electrode potential of 1.16 V, for pH ranging from 5.5 to 9.0. Theoretically, as each pH unit brings in an overpotential change of 59 mV, this fixed-potential study examines an effective overpotential range of 0.25 to 0.49 V. Good linearity is seen from the amorphous electrode for pH 5–7.5 with a slope of 1.0 (Fig. 5, right). The log(j)–pH curve flattens out at higher pH (overpotential), which is almost identical to the reported behavior of Co–Pi catalytic films.19,25 Although the exact cause of this behavior is not clear, we suspect it is related to the electrolyte, which loses its buffering capacity at pH >8 (ESI, Fig S2‡). Considering that the electrode current at the tipping-point is relatively high, without buffering mass transfer alone may not be sufficient to prevent the accumulation of protons (byproduct of water oxidation reaction) in close vicinity to the catalyst. In this situation, even when the pH of the bulk electrolyte was adjusted to higher values during the test, the local pH around the catalyst could stagnate at ∼8.Such a trend is not as prominent for the crystalline electrode because of the much lower current output. However, other possibilities, including a change in the reaction mechanism,19 may also be plausible.
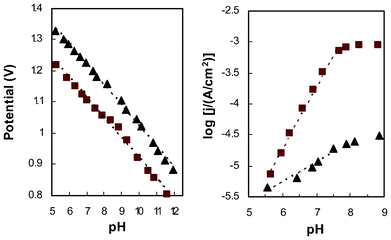 | ||
| Fig. 5 pH dependence of steady-state electrode potential at constant current (left, j = 30μA cm−2) and steady-state catalytic current at constant potential (right, E = 1.16 V) for electrodes with amorphous (■) and crystalline (▴) CoWO4. | ||
Qualitative analysis of CoWO4–ITO electrodes
Although RDEs provide favorable conditions for quantitative analysis of electrode kinetics, it is relatively difficult to pinpoint changes to catalyst materials as these are embedded in the composite film together with Nafion® and carbon black. To further investigate what might have caused the different behaviors of amorphous and crystalline catalysts, CoWO4 films on ITO glass slides were prepared. Amorphous films were first fabricated by a dip coating method using CoWO4 suspension in 1-butanol, and then some of the electrodes were further processed at high temperature (500 °C) to generate crystalline films.Similarly to the test on RDEs, multiple CV scans were first conducted on the CoWO4–ITO electrodes. While visually no change was observed on the crystalline electrode, the color of the amorphous film changed significantly from purple to dark brown during the scans. This shift of color happens as early as the first cycle of CV scanning, and become more evident during the following cycles. Large quantities of gas bubbles, presumed to be O2 bubbles, were seen being generated from the electrode during the CV scans. Faraday efficiencies were measured using an optical oxygen probe in the headspace of the working electrode chamber of the electrochemical cell. It appeared that both amorphous and crystalline electrodes produced oxygen at high current efficiency (ca. 90%). The results, although confirming oxygen production, provided little insight into the comparison of amorphous and crystalline CoWO4 (ESI, Fig. S8‡).
With no in situ techniques readily available, the physicochemical properties of the electrodes before and after being used for extensive CV scans and potentiostatic electrolysis were investigated using SEM, EDS and XPS analysis. The elemental composition, in terms of the Co to W ratio, remained nearly unchanged for both amorphous and crystalline electrodes (ESI, Table S1‡). However, SEM images showed that the surface morphology of amorphous films changed substantially after the tests, whereas that of the crystalline samples did not. Notably, on freshly prepared amorphous electrodes, CoWO4 nanopaticles were initially deposited as a fluffy film, but after multiple cycles of CV scans and bulk electrolysis tests the catalyst film appeared to be re-assembled into a much more densely-packed film on the electrode surface (ESI, Fig. S10‡).
More interestingly, XPS analysis revealed an evident change to the amorphous electrode surface (Fig. 6, left). The Co 2p electrons from crystalline and fresh amorphous electrodes all share the same characteristics of two main peaks and two satellite peaks, similar to previous reports.12,38 After the electrochemical tests, there was no appreciable change to XPS spectra of the crystalline electrode, but satellite peaks of the amorphous sample were clearly suppressed, plus there was a visible downshift to both of the main peaks. These changes correspond to partial oxidation of Co from +2 to +3, at least on the surface,51,52 as the final XPS spectrum of amorphous CoWO4 highly resembles those reported for Co3O438 and Co–Pi catalytic film.19 Based on this experimental evidence, it is very likely that new active sites with a different chemical nature have been formed in situ on the amorphous CoWO4 electrodes, and this change may have contributed to their higher catalytic activity.
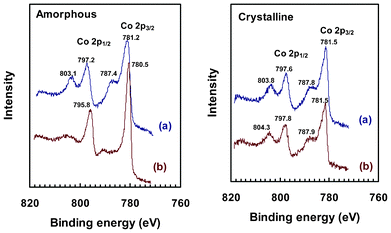 | ||
| Fig. 6 XPS spectra in the region of Co 2p3/2 and Co 2p1/2 peaks of amorphous (left) and crystalline (right) CoWO4 on ITO electrodes. (a): fresh electrode; (b): electrode after being used for multiple CV and bulk electrolysis tests. Note: survey spectrum is available in ESI, Fig. S9‡. | ||
Surface energies of crystalline CoWO4
Table 2 lists the energies of the stoichiometric surface of crystalline CoWO4 surfaces as obtained from DFT calculations. Stoichiometric (010), (011) and (100) surfaces can either terminate with Co/O or W/O. They are denoted as, for example, (010)Co and (010)W, respectively. The surface energy of (010)Co was significantly lower than other surfaces. It can be understood that the creation of (010)Co surface only requires the cleavage of Co–O bonds (Fig. 7), while the creation of all other surfaces breaks W–O bonds, which is much stronger than Co–O. Similar results have been reported in the study of LiFePO4, where breaking of P–O bond always leads to significantly greater surface energies.53 As a result, (010)Co is expected to be the most stable surface for crystalline CoWO4. The distance between two neighboring (010) Co atoms is estimated to be at least 4.69 Å, as shown in Fig. 7 (b).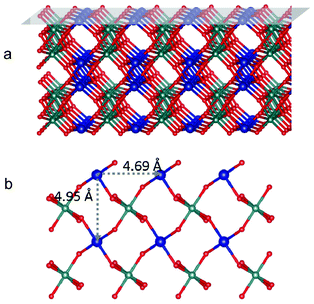 | ||
| Fig. 7 (a) Tilted side view of crystalline CoWO4 with (010) plane shaded on top; (b) top view of (010)Co surface. Blue, green and red balls represent Co, W and O atoms, respectively. Co atoms are purposely enlarged. | ||
Discussion: possible differences in reaction mechanisms
It is widely accepted that water oxidation happens through the adsorption and de-protonation of water molecules and the formation of O–O bonds at the active sites on the catalytic surfaces.16 However, mechanistic details are not clear at this moment, due to the complexity of the water oxidation reaction. Two prominent mechanisms contribute to the long-standing debates about the elementary steps relating to the formation of O–O bonds. Depending on the number of active sites involved in one reaction, these two mechanisms may be distinguished as the Langmuir–Hinshelwood (LH)-like mechanism (two-site), which involves the participation of two neighboring active sites, and the Eley–Rideal (ER)-like mechanism (single-site), which only requires one active site.54As illustrated in Fig. 8, one possible pathway for water oxidation via the LH mechanism is facilitated by the formation and bridging of two oxo groups of terminally coordinated high-valent metal ions,26 while in the ER mechanism, the water oxidation happens through the formation of peroxide groups which act as the precursor of O2 molecules. This classification was successfully used by a recent DFT modeling study to explain the reaction mechanism and Tafel line of RuO2 water oxidation electrodes, where the distinctive shift of Tafel slope (from 55 to 105 mV per decade) at 1.58 V was attributed to a change from a LH to an ER mechanism.54
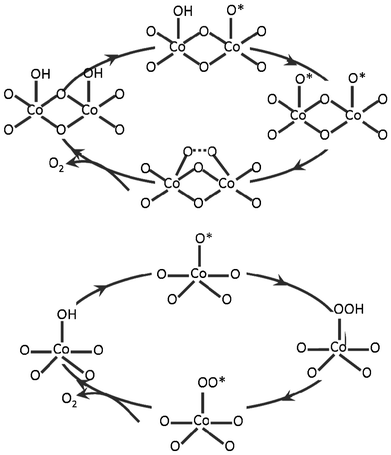 | ||
| Fig. 8 Schematic illustration of LH (two-site) mechanism (top) and ER (mono-site) mechanism (bottom) for O–O bond formation. | ||
The observed difference in Tafel slopes, along with other experimental evidence, clearly shows that water oxidation on amorphous and crystalline CoWO4 follows different mechanisms within the tested overpotential range. In a similar case, amorphous RuO2 was reported to have better activity than the crystalline form of this catalyst for water oxidation.55 A recent study by Tsuji et al.56 showed that electrodes using amorphous RuO2 as a catalyst required 30–60 mV less overpotential and also had smaller Tafel slopes than crystalline electrodes. This improved performance was explained by the structural flexibility of the amorphous RuO2, which could reduce the surface distortion energy related to the formation of precursors for oxygen evolution.
Another efficient water oxidation catalyst that exists as an amorphous phase is the self-repairing Co–Pi film discovered by Nocera and his coworkers.19,57–59 Extensive studies revealed that the Co–Pi catalyst consists of atomic CoOx clusters composed of complete or incomplete Co–oxo cubanes, with the distance between the nearest Co sites being around 2.82 Å.18,24,25,49,60–62 This short Co–Co distance favors the direct bridging of two oxo radicals. As a result, the barrier of oxo bridging was considerably lower on cubane CoOx clusters, and thus water oxidation through the LH route is more favorable on the Co–Pi catalyst.26
In the case of amorphous CoWO4, we believe that, during the initial CV studies, the catalyst has undergone dissolution and re-deposition processes, and formed active sites with a high similarity to those of the amorphous Co–Pi film. This hypothesis is strongly supported by the identical XPS spectra of the two catalysts, as well as other evidence, including: 1) features of CV pre-catalytic redox peaks indicating the participation of solution or bulk catalyst in the electron transfer processes, which was suggested as a signature of Co–Pi catalytic films;16 2) electrocatalytic properties of amorphous CoWO4, including Tafel slope, exchange current density and pH dependence of steady-state potential and current, which all resemble the reported data on Co–Pi catalytic films;25 3) at initial CV scans, amorphous CoWO4 films (on ITO electrodes) turned from purple to dark brown, which final color matches the description of Co–Pi catalytic film;19 and 4) surface morphology of amorphous CoWO4 film changed significantly before and after being used as catalyst. Apparently the catalyst particles had been re-assembled on the film. If this argument were valid, it would be reasonable to believe that the water oxidation reaction on amorphous CoWO4 electrode follows the LH mechanism, as illustrated in Fig. 8. The observed Tafel slope of ∼60 mV per decade can be explained as a reversible one electron transfer process followed by a rate limiting chemical reaction step, which could possibly be the formation of an O–O bond.
On the other hand, for crystalline CoWO4, the (010) surface terminated with Co and oxygen has the significant advantage of low surface energy over other surfaces. It can be speculated that this (010) surface plays a dominant role as the main host of catalytic sites for the water oxidation process. As the minimum distance between surface Co atoms (4.69 Å, as shown in Fig. 7b) is much longer than that of cubane CoOx clusters, the adsorbed species are too far apart to favor binding between the two nearest sites. Hence, water oxidation catalyzed by crystalline CoWO4 is likely to occur through the ER mechanism. Under this assumption, the rate limiting step would involve electron transfer, in agreement with the observed Tafel slope of ∼110 mV per decade.
Conclusions
In this study, the properties of CoWO4 as a water oxidation catalyst were investigated using a number of characterization methods including CV, Tafel analysis and XPS. Distinctive catalytic performances were observed between amorphous and crystalline states of CoWO4 particles. Small redox peaks preceding catalytic oxygen evolution were observed from the cyclic voltammogram of amorphous CoWO4, but were not seen with crystalline electrodes. Tafel slopes were estimated as ∼60 and 110 mV per decade for amorphous and crystalline catalysts, respectively. Although the amorphous electrodes apparently showed higher activity, the exchange current densities of crystalline catalysts were two orders of magnitude higher than those of amorphous. Significant color and morphology changes were observed in amorphous CoWO4 catalyst films deposited on ITO electrodes after being used for catalysis, while the crystalline electrodes remained largely the same. XPS analysis revealed that there was no appreciable change to the chemical nature of crystalline CoWO4, but in the case of the amorphous catalyst, the valence of Co atoms changed from +2 to +3. The characteristics of amorphous CoWO4 highly resemble the well-known self-repairing Co–Pi catalytic films. The collective data indicates that different mechanisms are involved in the water oxidation reactions catalyzed by amorphous and crystalline CoWO4. For amorphous CoWO4, we believe that oxygen evolution should follow the LH mechanism involving coordination of neighboring active sites. In contrast the ER mechanism (single active site) is more favorable for a crystalline surface, as the calculated minimum distance of 4.69 Å between Co atoms is too long for cooperative interaction between adsorbants. These findings provide significant, first-hand insights towards further study of CoWO4 as both a photoanode and photocatalytic material for water oxidation.Acknowledgements
The authors thank Dr Etsuko Fujita, Dr James Makerman and Dr Jacob Schneider at Brookhaven National Lab., Dr Shinichi Matsumoto and Dr Hirohito Hirata at Toyota Motor Corporation for helpful discussions, Dr Kai Sun (Univ. of Michigan, EMAL) and Dr Taghi Darroudi (Clemson Univ., Electron Microscope Facility) for assistance on SEM, TEM and XPS analysis.References
- S. Lewis Nathan and G. Nocera Daniel, Proc. Natl. Acad. Sci. U. S. A., 2006, 103, 15729–15735 CrossRef CAS.
- F. E. Osterloh, Chem. Mater., 2007, 20, 35–54.
- A. Fujishima and K. Honda, Nature, 1972, 238, 37–38 CAS.
- K. Maeda, K. Teramura, D. Lu, T. Takata, N. Saito, Y. Inoue and K. Domen, Nature, 2006, 440, 295–295 CrossRef CAS.
- K. Maeda, K. Teramura, D. Lu, N. Saito, Y. Inoue and K. Domen, J. Phys. Chem. C, 2007, 111, 7554–7560 CrossRef CAS.
- K. Maeda, K. Teramura, D. Lu, N. Saito, Y. Inoue and K. Domen, Angew. Chem., Int. Ed., 2006, 45, 7806–7809 CrossRef CAS.
- S. Sato, T. Arai, T. Morikawa, K. Uemura, T. M. Suzuki, H. Tanaka and T. Kajino, J. Am. Chem. Soc., 2011, 133, 15240–15243 CrossRef CAS.
- K. Maeda and K. Domen, J. Phys. Chem. Lett., 2010, 1, 2655–2661 Search PubMed.
- A. Walsh, K.-S. Ahn, S. Shet, M. N. Huda, T. G. Deutsch, H. Wang, J. A. Turner, S.-H. Wei, Y. Yan and M. M. Al-Jassim, Energy Environ. Sci., 2009, 2, 774–782 RSC.
- S. Ikeda, T. Itani, K. Nango and M. Matsumura, Catal. Lett., 2004, 98, 229–233 CrossRef CAS.
- H. Kato and A. Kudo, Chem. Phys. Lett., 1998, 295, 487–492 CrossRef CAS.
- S. Rajagopal, D. Nataraj, O. Y. Khyzhun, Y. Djaoued, J. Robichaud and D. Mangalaraj, J. Alloys Compd., 2010, 493, 340–345 CrossRef CAS.
- S. Rajagopal, V. L. Bekenev, D. Nataraj, D. Mangalaraj and O. Y. Khyzhun, J. Alloys Compd., 2010, 496, 61–68 CrossRef CAS.
- P. Pandey, N. Bhave and R. Kharat, J. Mater. Sci., 2007, 42, 7927–7933 Search PubMed.
- T. Montini, V. Gombac, A. Hameed, L. Felisari, G. Adami and P. Fornasiero, Chem. Phys. Lett., 2010, 498, 113–119 CrossRef CAS.
- H. Dau, C. Limberg, T. Reier, M. Risch, S. Roggan and P. Strasser, ChemCatChem, 2010, 2, 724–761 Search PubMed.
- F. Jiao and H. Frei, Energy Environ. Sci., 2010, 3, 1018–1027 RSC.
- D. G. Nocera, Acc. Chem. Res., 2012, 45, 767–776 CrossRef CAS.
- M. W. Kanan and D. G. Nocera, Science, 2008, 321, 1072–1075 CrossRef CAS.
- F. Jiao and H. Frei, Angew. Chem., Int. Ed., 2009, 48, 1841–1844 CrossRef CAS.
- Q. Yin, J. M. Tan, C. Besson, Y. V. Geletii, D. G. Musaev, A. E. Kuznetsov, Z. Luo, K. I. Hardcastle and C. L. Hill, Science, 2010, 328, 342–345 CrossRef CAS.
- J. Suntivich, K. J. May, H. A. Gasteiger, J. B. Goodenough and Y. Shao-Horn, Science, 2011, 334, 1383–1385 CrossRef CAS.
- D. K. Dogutan, R. McGuire and D. G. Nocera, J. Am. Chem. Soc., 2011, 133, 9178–9180 CrossRef CAS.
- M. D. Symes, Y. Surendranath, D. A. Lutterman and D. G. Nocera, J. Am. Chem. Soc., 2011, 133, 5174–5177 CrossRef CAS.
- Y. Surendranath, M. W. Kanan and D. G. Nocera, J. Am. Chem. Soc., 2010, 132, 16501–16509 CrossRef CAS.
- L.-P. Wang and T. Van Voorhis, J. Phys. Chem. Lett., 2011, 2, 2200–2204 Search PubMed.
- B. S. Yeo and A. T. Bell, J. Am. Chem. Soc., 2011, 133, 5587–5593 CrossRef CAS.
- D. K. Zhong, M. Cornuz, K. Sivula, M. Graetzel and D. R. Gamelin, Energy Environ. Sci., 2011, 4, 1759–1764 RSC.
- K. J. McDonald and K. S. Choi, Chem. Mater., 2011, 23, 1686–1693 CrossRef CAS.
- D. K. Zhong and D. R. Gamelin, J. Am. Chem. Soc., 2010, 132, 4202–4207 CrossRef CAS.
- D. K. Zhong, J. W. Sun, H. Inumaru and D. R. Gamelin, J. Am. Chem. Soc., 2009, 131, 6086–6087 CrossRef CAS.
- J. A. Seabold and K. S. Choi, Chem. Mater., 2011, 23, 1105–1112 CrossRef CAS.
- J. E. Yourey, J. B. Kurtz and B. M. Bartlett, J. Phys. Chem. C, 2012, 116, 3200–3205 Search PubMed.
- E. M. P. Steinmiller and K. S. Choi, Proc. Natl. Acad. Sci. U. S. A., 2009, 106, 20633–20636 CrossRef CAS.
- J. J. H. Pijpers, M. T. Winkler, Y. Surendranath, T. Buonassisi and D. G. Nocera, Proc. Natl. Acad. Sci. U. S. A., 2011, 108, 10056–10061 CrossRef CAS.
- S. Y. Reece, J. A. Hamel, K. Sung, T. D. Jarvi, A. J. Esswein, J. J. H. Pijpers and D. G. Nocera, Science, 2011 Search PubMed.
- G. Hitoki, T. Takata, S. Ikeda, M. Hara, J. N. Kondo, M. Kakihana and K. Domen, Catal. Today, 2000, 63, 175–181 CrossRef CAS.
- Y. Yamada, K. Yano, D. Hong and S. Fukuzumi, Phys. Chem. Chem. Phys., 2012, 14, 5753–5760 RSC.
- J. Suntivich, H. A. Gasteiger, N. Yabuuchi, H. Nakanishi, J. B. Goodenough and Y. Shao-Horn, Nat. Chem., 2011, 3, 546–550 CrossRef CAS.
- S. Jin, A. G. Hubert, Y. Naoaki and S.-H. Yang, J. Electrochem. Soc., 2010, 157, B1263–B1268 CrossRef CAS.
- G. Kresse and D. Joubert, Phys. Rev. B: Condens. Matter Mater. Phys., 1999, 59, 1758–1775 CrossRef CAS.
- G. Kresse and J. Furthmüller, Phys. Rev. B: Condens. Matter, 1996, 54, 11169–11186 CrossRef CAS.
- G. Kresse and J. Furthmüller, Comput. Mater. Sci., 1996, 6, 15–50 CrossRef CAS.
- G. Kresse and J. Hafner, Phys. Rev. B: Condens. Matter, 1994, 49, 14251–14269 CrossRef CAS.
- T.-D. Nguyen, C.-T. Dinh and T.-O. Do, Nanoscale, 2011, 3, 1861–1873 RSC.
- T. You, G. Cao, X. Song, C. Fan, W. Zhao, Z. Yin and S. Sun, Mater. Lett., 2008, 62, 1169–1172 Search PubMed.
- S. J. Naik and A. V. Salker, Solid State Sci., 2010, 12, 2065–2072 Search PubMed.
- S. Thongtem, S. Wannapop and T. Thongtem, Ceram. Int., 2009, 35, 2087–2091 CrossRef CAS.
- Y. Surendranath, M. Dinca and D. G. Nocera, J. Am. Chem. Soc., 2009, 131, 2615–2620 CrossRef CAS.
- J. B. Gerken, J. G. McAlpin, J. Y. C. Chen, M. L. Rigsby, W. H. Casey, R. D. Britt and S. S. Stahl, J. Am. Chem. Soc., 2011, 133, 14431–14442 CrossRef CAS.
- B. J. Tan, K. J. Klabunde and P. M. A. Sherwood, J. Am. Chem. Soc., 1991, 113, 855–861 CrossRef.
- Y.-H. Fang and Z.-P. Liu, J. Am. Chem. Soc., 2010, 132, 18214–18222 CrossRef CAS.
- A. Foelske and H.-H. Strehblow, Surf. Interface Anal., 2000, 29, 548–555 CrossRef CAS.
- Y.-H. Fang and Z.-P. Liu, J. Am. Chem. Soc., 2010, 132, 18214–18222 CrossRef CAS.
- H. Tamura and C. Iwakura, Int. J. Hydrogen Energy, 1982, 7, 857–865 Search PubMed.
- E. Tsuji, A. Imanishi, K.-i. Fukui and Y. Nakato, Electrochim. Acta, 2011, 56, 2009–2016 CrossRef CAS.
- A. J. Esswein, Y. Surendranath, S. Y. Reece and D. G. Nocera, Energy Environ. Sci., 2011, 4, 499–504 RSC.
- E. R. Young, D. G. Nocera and V. Bulovic, Energy Environ. Sci., 2010, 3, 1726–1728 RSC.
- D. A. Lutterman, Y. Surendranath and D. G. Nocera, J. Am. Chem. Soc., 2009, 131, 3838–3839 CrossRef CAS.
- M. Risch, V. Khare, I. Zaharieva, L. Gerencser, P. Chernev and H. Dau, J. Am. Chem. Soc., 2009, 131, 6936–6937 CrossRef CAS.
- M. W. Kanan, J. Yano, Y. Surendranath, M. Dinca, V. K. Yachandra and D. G. Nocera, J. Am. Chem. Soc., 2010, 132, 13692–13701 CrossRef CAS.
- J. G. McAlpin, Y. Surendranath, M. Dinca, T. A. Stich, S. A. Stoian, W. H. Casey, D. G. Nocera and R. D. Britt, J. Am. Chem. Soc., 2010, 132, 6882–6883 CrossRef CAS.
Footnotes |
| † This article was submitted as part of a special collection on Catalysis for Clean Energy. |
| ‡ Electronic Supplementary Information (ESI) available: additional details of experimental procedures, XRD spectrum with peak index, BET specific surface area, optical absorption spectra, pH titration of Na2WO4 electrolyte, additional CV and Tafel plots, XPS survey spectra, results of Faraday efficiency measurement, SEM images and EDS analysis of CoWO4-ITO electrodes. See DOI: 10.1039/c2ra21993j |
| This journal is © The Royal Society of Chemistry 2012 |
