Quantum dots excitation using pure beta minus radioisotopes emitting Cerenkov radiation
Federico
Boschi
*a and
Antonello E.
Spinelli
b
aDepartment of Neurological, Neuropsychological, Morphological and Motor Sciences University of Verona, Strada Le Grazie 8, Verona, 37134, Italy. E-mail: federico.boschi@univr.it
bMedical Physics Department San Raffaele Scientific Institute, Via Olgettina N. 60, Milan 20182, Italy
First published on 17th September 2012
Abstract
Cerenkov radiation imaging has been recently introduced as a new pre-clinical imaging tool to investigate many pathologies in vivo. It is well known that Cerenkov radiation is more intense at shorter wavelength than at longer wavelength in the visible range and, thus, in order to improve the detectability in biological tissues a shift towards the red and near infrared emission is needed. The use of Quantum Dot (QD) nanoparticles as Stokes shifters has been previously suggested, but the interaction mechanism with Cerenkov radiation was not fully investigated. Our experimental results showed a good agreement with the inverse squared law and, thus, we conclude that the excitation of QDs with a beta emitter is quite similar to the fluorescence by unbound excitation from the luminescence mechanism.
Introduction
In the past three years there has been a significant interest in the use of Cerenkov radiation (CR) for molecular in vivo imaging.1 More precisely, several groups have investigated the use of Cerenkov radiation to image different radiotracers2–10 as an excitation source for quantum dots11–14 (QDs). This last application is quite promising for in vivo imaging since it allows a wavelength shift of the QD emitted light in the red–infrared region. In this region the tissue absorption is smaller allowing the imaging of deeper tissues. In this work our main goal is to investigate the interaction mechanisms between QDs and pure beta emitters.With some analogies to the concepts of fluorescence resonance energy transfer (FRET) and bioluminescence resonance energy transfer (BRET) the concept of Cerenkov radiation energy transfer (CRET) for QD excitation using CR has been introduced.12
The BRET mechanism involves non-radiative energy transfer based on dipole–dipole interactions inversely proportional to the sixth power and this implies that distance between molecules is less than 10 nm.15 It is also necessary for BRET and FRET to have an overlap between the bioluminescence and fluorescence spectra of the donor and the acceptor.
A recent work using luminescence bacteria underlined that in some cases a red-shifted bioluminescence probe mechanism can take place even if some of the conditions above, typical of BRET, are not satisfied.16 In this case the phenomenon named fluorescence by unbound excitation from luminescence (FUEL) is more similar to the epifluorescence based on conventional excitation and emission between an excitation light source and a fluorophore.
In this work our main goal is to further investigate the FUEL approach using pure beta emitter Cerenkov sources instead of luminescence bacteria. We called this effect Cerenkov radiation unbound excitation from luminescence (CRUEL) in order to underline this peculiar excitation light source. It is useful to remember here that the number of the emitted Cerenkov photons per unit of wavelength λ shows a 1/λ2 dependence17 and, thus, a larger number of excitation photons are emitted at shorter wavelengths.
Results and discussion
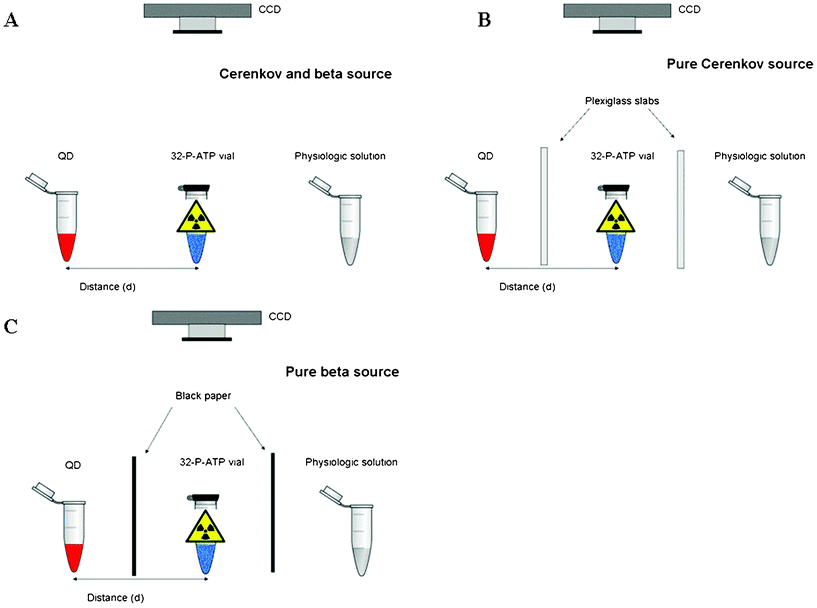
In order to investigate the QD excitation mechanism using 32P as a primary Cerenkov and beta excitation source, we used an experimental set-up described in Fig. 1a. Laterally to the 32P-ATP vial we placed two open transparent vials containing respectively a solution of QDs and physiologic sodium chloride solution (as a reference). The vial containing the QD solution was then placed at different distances from the 32P-ATP in order to investigate the relation between source distance and QD fluorescence intensity. | ||
| Fig. 1 As described in the text, in order to understand the contribution of the different QD excitation sources we performed experiments with three different settings. More precisely with a pure primary beta source (panel c), a pure primary Cerenkov source (panel b), a combination of both (panel a). Laterally to the 32P-ATP vial (blue vial) we placed two transparent vials containing respectively a solution of QDs (red vial) and physiologic solution (grey vial). The distance d between the QD and 32P-ATP vials was then varied in order to investigate the relation between source distance and QD fluorescence intensity. All the vials were placed at the centre of the field of view of a CCD based small animal optical imager (IVIS Spectrum) acquiring in bioluminescence mode. In order to avoid any possible CCD saturation caused by direct Cerenkov light emitted by the 32P, the source vial was closed and tapered with thick black paper. | ||
The main goal of the second set-up (Fig. 1b) was to avoid any possible contribution from beta particles emitted by 32P in order to obtain a pure primary Cerenkov light source. To this purpose we placed several transparent slabs 10 mm, 7.5 mm, 5 mm and 2.5 mm thick of Plexiglas between the 32P-ATP and QD vials. Given the end point energy (1.7 MeV) of the beta particles emitted by 32P, the fraction of beta particles through 6–7 mm of Plexiglas slab is negligible and, thus, in this case the 32P-ATP vial can be considered as a pure Cerenkov light excitation source. The vial containing the QD solution was then moved at different distances in order to investigate the relation between Cerenkov source intensity and QD fluorescence intensity.
In the third set-up (Fig. 1c) to reduce any possible contribution from the primary Cerenkov light a 2 mm thick black paper was placed between the 32P-ATP and QD vials. The CR emitted by the 32P-ATP vial is thus completely stopped by the black paper and only the beta particles emitted from 32P can reach the vial containing the QDs.
Strictly speaking, there might be CR produced in the plastic of the vial and in the QD solution itself and, thus, is not possible in this case to totally exclude the contribution of CR as a QD excitation source. However, as will be described in the rest of this paper, by comparing the measured QD signal with and without a piece of black paper and/or with Plexiglas slabs it is possible to estimate the net contribution of the primary CR emitted by the 32P-ATP vial.
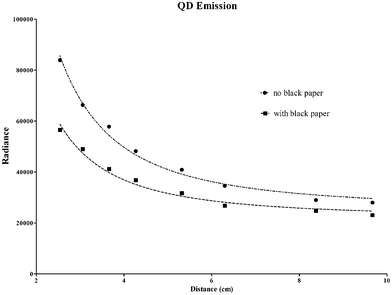
Fig. 2 shows the measured signal of the QD vial at different distances from the 32P-ATP source using the experimental set-up described in Fig. 1a and Fig. 1c. The data were fitted with an inverse squared function plus a constant term to include signal background. As one can see from the plots (Fig. 2) there is a good agreement between the inverse squared model and the experimental data, the R2 being respectively equal to 0.942 and 0.918 for Cerenkov-beta and pure beta sources. The ratio between the curves is within a range of 1.51 and 1.21 showing a distinct contribution of the Cerenkov light emitted by the 32P-ATP vial.
 | ||
| Fig. 2 The plots show the measured radiance (ph/s/cm2/sr) in the QD vial placed at different positions for the experimental conditions described in Fig. 1 a and c with (■) and without (●) black paper between the 32P-ATP and QD solution. The data were fitted using an inverse squared function plus a constant term to include signal background. The R2 is respectively equal to 0.942 and 0.918 for Cerenkov-beta (see Fig. 1a) and pure beta (see Fig. 1c) sources. | ||
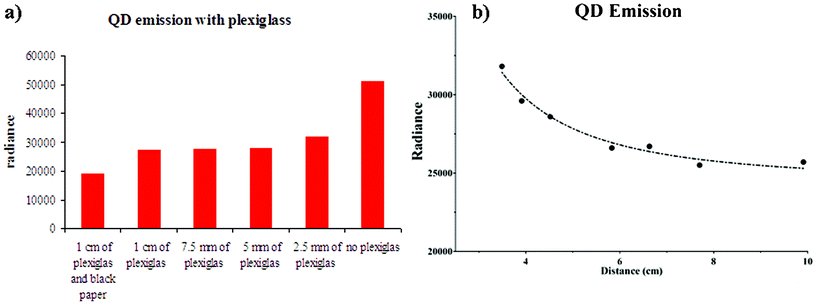
Fig. 3a presents the results obtained by placing Plexiglas slabs between the 32P-ATP and QD vials (see Fig. 1b). As one can see, the radiance of the QD vials is almost constant when the Plexiglas slab thickness is greater than 5 mm. This is because the contribution of the beta particles to the QD radiance is almost zero. In this case the ratio between the total signal (no Plexiglas) and pure Cerenkov signal is equal to 1.75: this value is almost comparable with the ratio we found using the data in Fig. 2 and shows that the primary CR and beta particles contribute almost equally to the excitation of the QDs.
 | ||
| Fig. 3 The histogram in panel (a) shows the QD emitted radiance (ph/s/cm2/sr) measurements obtained by placing slabs between the 32P-ATP and QD vials (see Fig. 1b). As one can see, the radiance of the QD vials is almost constant when the Plexiglas slab thickness is greater than 5 mm. In this case the contribution of the beta particles to the QD radiance is almost zero. The plot in panel (b) shows the dependence of QD excitation with respect to the primary CR emitted by 32P through a 1 cm Plexiglas slab. The data were fitted with an inverse squared function plus a constant term. The fit (dotted line) shows a good agreement between the inverse squared model and the experimental data. The resulting R2 was equal to 0.973. | ||
The dependence of QD excitation with respect to the primary CR emitted by 32P through a 1 cm Plexiglas slab is presented in Fig. 3b. Analogously to Fig. 2 the data were fitted with an inverse squared function plus a constant term. The fit in Fig. 3b shows a good agreement between the inverse squared model and the experimental data, the R2 being equal to 0.973.
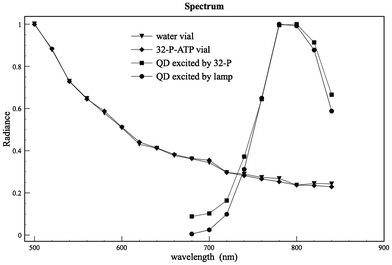
We completed the experiments by measuring the emission light spectrum of the 32P source, the QD and water reference vials in bioluminescent mode (no external excitation). The QD emission spectrum was also measured in fluorescence mode by exciting the vial with an external lamp.
As one can see from Fig. 4 the spectra of both source and reference water vial show a typical shape of the Cerenkov spectrum:3,17 this allows us to rule out any possible bias (like for example plastic luminescence) during the measurements. More interesting is the comparison between the emission spectrum obtained by exciting the QDs with the Cerenkov 32P source and with an external lamp. In this case both spectra are almost the same at the QD emission peak (around 800 nm) but are slightly different at smaller wavelengths (660–720 nm) because of a fraction of the Cerenkov spectrum in the QD solution.
 | ||
| Fig. 4 The spectra of both source and reference water vials show a typical shape of the Cerenkov spectrum3,17 and this allows us to rule out any possible bias during the measurements. The comparison between the emission spectrum obtained by exiting the QDs with the Cerenkov 32P source and with an external lamp shows that both spectra are almost the same at the QD emission peak (around 800 nm). The spectra are slightly different at smaller wavelengths (660–720 nm) because of a fraction of the Cerenkov component. | ||
Experimental
Source preparation
A transparent vial containing 0.1 MBq of 32P-ATP was placed in the centre of the Field of View (FoV) of a small animal optical imager. In order to avoid any possible CCD saturation caused by direct Cerenkov light emitted by the 32P, the vial containing 32P-ATP was closed and tapered with black paper.Image acquisition
The images were acquired using the IVIS Spectrum, the system is equipped with a back-thinned, back-illuminated CCD camera cooled at −90 °C. The images analyzed in this work were acquired in bioluminescence mode (no excitation lamps) with the following parameters: f-number of the optics f = 1, with a FoV = 13 cm, exposure time of 10 s and grouping 8 pixels (B = 8) in the case of the set-up without black papers. Exposure time of 60 s and B = 16 in the case of black papers inserted between the source and QD solution. The images were analyzed with Living Image 4.2 (Caliper Life Sciences- PerkinElmer) and were corrected for dark measurements.Spectral measurements
For the spectral measurements of the QD emission in the case of 32P-ATP excitation the following parameters were used: exposure time of 60 s, f = 1, B = 16. Emission filters: from 500 to 840 each filter has a FWHM around 20 nm.The spectral measurements of the QD emission in case of fluorescence with excitation lamps were acquired using the following parameters: exposure time of 1 s, f = 2, B = 4. Emission filters from 680 to 840 nm; each filter has a FWHM of 20 nm. The excitation light was set at 500 nm.
QD preparation
A 2 μM quantum dot 800 (Qracker800, Invitrogen) solution was diluted 1![[thin space (1/6-em)]](https://www.rsc.org/images/entities/char_2009.gif) :
:![[thin space (1/6-em)]](https://www.rsc.org/images/entities/char_2009.gif) 5 in physiological solution and a transparent plastic vial was then filled with 200 μl. The QD emission around 800 nm is particularly suitable for in vivo imaging applications due to the lower optical thickness of the biological tissues at this specific wavelength. These QDs can be excited in a broad range of wavelengths from 400 to 700 but the emission always peaks around 800 nm.
5 in physiological solution and a transparent plastic vial was then filled with 200 μl. The QD emission around 800 nm is particularly suitable for in vivo imaging applications due to the lower optical thickness of the biological tissues at this specific wavelength. These QDs can be excited in a broad range of wavelengths from 400 to 700 but the emission always peaks around 800 nm.
Conclusions
To summarize, the experimental data presented in this paper showed that the excitation of QDs with beta emitters is quite similar to the FUEL mechanism. More precisely, the experiments performed using the set-up shown in Fig. 1c clearly demonstrate a net contribution of the primary CR emitted by the 32P vial to the QD excitation with a inverse squared dependence from the distance (Fig. 2). This is further confirmed (Fig. 3) by using the set-up of Fig. 1b: in this case, given the amount of Plexiglas (1 cm) between the 32P source and the QD vial, we can exclude any direct contribution to QD excitation due to the beta particles inside the vial. The agreement of the data with the inverse squared law shows that the interaction between QD and Cerenkov radiation resembles more the FUEL mechanism than BRET.It is also useful to underline that the distance between the 32P and QD vials was always of the order of a few centimeters and, thus, much higher than the effective range of dipole–dipole interaction (few nanometers) typical of BRET.
In the case of a mixture of QDs and beta emitters, or alternatively, if the QDs are located within the range of beta emitters with an energy greater than the Cerenkov threshold (like in Fig. 1c) there might be a local production of Cerenkov radiation and, thus, QD excitation.
The beta particles themselves can cause QD excitation, and this will be further investigated using beta emitters having an end point energy smaller than the Cerenkov threshold in water.
Acknowledgements
The authors would like to acknowledge Dr Regis Tournebize of the Institute Pasteur for the useful discussions regarding the FUEL mechanism and Fondazione Cariverona for the financial support.References
- A. E. Spinelli, M. Marengo, R. Calandrino, A. Sbarbati and F. Boschi, Q. Jour. Nuc. Med, 2012, 56(3), 280–289 CAS.
- R. Robertson, M. S. Germanos, C. Li, G. S. Mitchell, S. R. Cherry and M. D. Silva, Phys. Med. Biol., 2009, 54, N355–N365 CrossRef CAS.
- A. E. Spinelli, D. D'Ambrosio, L. Calderan, M. Marengo, A. Sbarbati and F. Boschi, Phys. Med. Biol., 2010, 55, 483–495 CrossRef.
- A. E. Spinelli, F. Boschi, D. D'Ambrosio, L. Calderan, M. Marengo, A. Fenzi, A. Sbarbati, A. Del Vecchio and R. Calandrino, Nucl. Instrum. Methods Phys. Res., Sect. A, 2011, 648, S310–S312 CrossRef CAS.
- F. Boschi, L. Calderan, D. D'Ambrosio, M. Marengo, A. Fenzi, R. Calandrino, A. Sbarbati and A. E. Spinelli, Eur. J. Nucl. Med. Mol. Imaging, 2011, 38, 120–127 CrossRef.
- H. Liu, G. Ren, Z. Miao, X. Zhang, X. Tang, P. Han, S. S. Gambhir and Z. Cheng, PLoS One, 2010, 5, e9470 Search PubMed.
- A. Ruggiero, J. P. Holland, J. S. Lewis and J. Grimm, J. Nucl. Med., 2010, 51, 1123–1130 CrossRef CAS.
- A. E. Spinelli, C. Kuo, B. W. Rice, R. Calandrino, P. Marzola, A. Sbarbati and F. Boschi, Opt. Express, 2011, 19, 12605–12618 CrossRef CAS.
- A. E. Spinelli and F. Boschi, J. Biom. Opt., 2011, 16, 12 Search PubMed.
- A. E. Spinelli, M. Marengo, R. Calandrino, A. Sbarbati and F. Boschi, Quarterly J Nucl Med and Mol Im, 2012, 56, 280–90 CAS.
- H. Liu, X. Zhang, B. Xing, P. Han, S. S. Gambhir and Z. Cheng, Small, 2010, 6, 1087–1091 CrossRef CAS.
- R. S. Dothager, R. J. Goiffon, E. Jackson, S. Harpstrite and D. Piwnica-Worms, PLoS One, 2010, 5, e13300 Search PubMed.
- M. A. Lewis, V. D. Kodibagkar, O. K. Öz and R. P. Mason, Opt. Lett., 2010, 35, 3889–3891 CrossRef CAS.
- Y. Xu, H. Liu and Z. Cheng, J. Nucl. Med., 2011, 52, 1–10 CrossRef.
- K. D. Pfleger and K. A. Eidne, Nat. Methods, 2006, 3, 165–174 CrossRef CAS.
- J. Dragavon, S. Blazquez, A. Rekiki, C. Samson, I. Theodorou, K. L. Rogers, R. Tournebize and R. L. Shorte, Proc. Natl. Acad. Sci. U. S. A., 2012, 109, 8890–8895 CrossRef CAS.
- J. V. Jelley, Cerenkov Radiation and its Applications, Pergamon, London, 1958, p.22 Search PubMed.
| This journal is © The Royal Society of Chemistry 2012 |
