Sononanostructuring of zinc-based materials
Jana Dullea, Silke Nemetha, Ekaterina V. Skorbb and Daria V. Andreeva*a
aPhysical Chemistry II, University of Bayreuth Universitätsstrße, 30 95440 Bayreuth, Germany. E-mail: daria.andreeva@uni-bayreuth.de; Fax: +49 921552059; Tel: +49 921552750
bMax Planck Institute of Colloids and Interfaces, Am Mühlenberg 1, 14424 Potsdam, Germany. E-mail: skorb@mpikg.mpg.de; Fax: +49 331567 9202; Tel: +49 331567 9233
First published on 16th October 2012
Abstract
We performed the sonochemical nanostructuring (sononanostructuring) of zinc particles, which produced a core–shell “hedgehog” zinc-based material by a “green” ultrasound method. The core–shell “hedgehogs” consist of a metallic zinc core covered by zinc oxide nanorods. Due to the “hedgehog” morphology, the novel zinc-based material exhibited increased surface area, high accessibility for substrate molecules and could be a promising component of sensors, catalysts, active feedback coatings, and photovoltaic systems. We demonstrate the results of the photocatalytic performance of the zinc-based core–shell “hedgehogs”.
1. Introduction
Ultrasound (US) technology is a green chemistry tool for the direct delivery of energy in a chemical reactor. Ultrasound-assisted processes can be carried out under relatively mild conditions and do not require aggressive media or harsh chemical additives. The energy is concentrated locally inside and near cavitation bubbles.1–5 In general, the collapse of acoustic cavitation microbubbles (frequency of 20 kHz) under the ambient conditions of the bulk solution is characterized by intensive local effects: temperature increase (up to 5000 K), pressure increase (of about 1000 atmospheres), and heating and cooling rates above 109 degrees per second. The sonochemical effects include the formation of radicals from solvents and the enhancement of reaction rates at ambient temperature. Thus, ultrasound can be used for fast and effective modification, fragmentation of particles, etching of metal surfaces, depassivation of metal surfaces, oxidation, and for the growth stimulation of a novel metal oxide/hydroxide interfacial layer.Here we propose an easy ultrasound-driven method of the modification of zinc particles, so-called “sononanostructuring” of zinc particles, by using US. The novel US-assisted modification method leads to the formation of core–shell “hedgehog” zinc-based materials. Wide band-gap semiconductor materials like nanostructured zinc oxide (ZnO) are important for several applications, such as transparent semiconductors, gas sensors, solar cell windows, and photovoltaic devices.9,10 Thus, ZnO in the form of powders,11–15 nanoparticles,16–19 nanoplatelets,20 plates,21 or thin films,22–24 has already gained interest as a photocatalyst for the degradation of water pollutants. Photocatalytic materials have become a promising alternative for environmental reprocessing25 due to their ability to degrade different organic compounds in a more efficient way than other processes, e.g., biodegradation techniques.26,27 The polluted water contains toxic compounds that are persistent and not biodegradable. Dyes from the textile industry are examples of such dangerous waste. The degradation of these dyes is a serious problem worldwide.28–32 The cleaning of the highly contaminated waste is important for the environment and human beings. With this in view, ZnO is considered as a low cost photocatalyst for photodegradation.13,16,33–35 The high photocatalytic efficiency of ZnO is attributed to its ability to generate H2O236,37 and to the high number of active sites with high surface reactivity.
The formation of ZnO nanostructured materials varies from the sol–gel method,38 the use of a thermal plasma reactor,16 the chemical vapour deposition method,39 alkali precipitation,12 and spray pyrolysis40 to orient the attachment of preformed ZnO nanoparticles.41 Here, we propose an alternative approach: direct oxidation of the zinc surface by using a sonochemical approach. The ZnO nanorods form a shell attached to the metal zinc core. The novel approach is based on our previous works.3,4,6–8 Recently, we demonstrated that mesoporous metal structures stabilized by a metal oxide layer could be formed using ultrasound. The sononanostructuring of zinc particles requires relatively mild conditions: aqueous media without any additional oxidants. Production expenses including the ultrasound equipment and energy costs of preparing the particles are rather low. The US-assisted method can be up-scaled by using different sonotrodes or a series of sonotrodes.6 One of the advantages of the proposed sononanostructuring process is that a wide range of Zn-based materials with various morphologies and functionalities can be prepared. The photocatalytic performance was demonstrated as one of the potential applications of the sononanostructured Zn. Furthermore, the ultrasound-assisted modification was performed under different conditions in order to help understand the mechanisms of the sononanostructuring of Zn.
2. Experimental
2.1. Formation of core–shell “hedgehogs” from Zn particles
Zinc powder (Sigma Aldrich, ≥99%, initial size ∼50 μm and 4 μm) was dispersed in ultrapure MilliQ-water and sonicated for different durations with an ultrasound tip (VIP1000hd, Hielscher Ultrasonics GmbH, Germany) operated at 20 kHz with a maximum output power of 1000 W ultrasonic horn BS2d22 (head area of 3.8 cm2) and equipped with a booster B2-1.8. The maximum intensity was calculated to be 140 W cm−2 at a mechanical amplitude of 106 μm. The concentration of the initial powder was varied in the range 0.01–0.1 g mL−1. During treatment the sample was cooled in a thermostatic flow cell. After the treatment, the modified zinc (US-Zn) sample was dried for 24 h.2.2. Characterisation methods
Transmission and scanning electron microscopy (TEM, Zeiss EM922 Omega, EFTEM operating at 200 kV and SEM, LEO 1530 FE-SEM, Zeiss), in combination with an ultra microtome (Ultracut E, Reichert Jung, thickness 50 nm) were applied to characterize the optical response, structure, and the size of the zinc powder.The powder X-ray diffraction (PXRD) patterns were collected in the θ–θ mode using a Stoe STADI P X-ray transmission diffractometer: Cu-Kα1, irradiation, room temperature, 2θ =5–90°.
The surface area is based on physisorption (adsorption and desorption of gases) and was measured by the BET (Brunauer–Emmett–Teller)48 method using krypton at 77 K on a vacuum gas sorption Autosorb-1 and Autosorb Degasser apparatus (Quantachrom). Each sample was dried under vacuum for 24 h at 100 °C.
X-ray photoelectron spectroscopy (XPS) was acquired with a SPECS hemispherical energy analyzer (Phoibus 100) and SPECS focus 500 X-Ray monochromator using the Al-Kα with energy of 1486.74 eV.
2.3. Photocatalytic experiments
The photocatalytic activities were used for the as-prepared and filtered samples in order to separate the free ZnO nanorods formed by sonication. The core–shell Zn/ZnO particles were used for the degradation of methyl orange (MO, ACS reagent, Sigma-Aldrich) in solution in the presence of UV light.The degradation of MO dye was estimated by evaluation of the intensity of the absorption band centred at 464 nm, as a function of the illumination time.
The initial pH of these solutions was 5.4. A 450 W UV lamp, equipped with a 420 nm cut-off filter (λ = 380 nm) was used (UV-F 400 F, Dr. Hönle, Germany) to irradiate the stirred dispersions. The sample was placed at a distance of 25 cm from the UV lamp, the average light intensity was 15 mJ cm−2 (measured by tesa® UV Strip – UV Scan, Dr. Hönle, Germany). 10 mg of zinc modified for different lengths of sonication time were dispersed in a 10 mL MO suspension (0.1 mM) and stirred at room temperature. Prior to irradiation, the suspensions were magnetically stirred in the dark for 30 min to reach an adsorption–desorption equilibrium. At given time intervals, 1 μL of the solution samples were collected and analysed by recording the absorption of MO from 190 nm to 800 nm using an Agilent 8453 UV/VIS spectrophotometer with ultrapure water in the reference beam. The degradation percentage was obtained as well as the rate of reaction constant k. This rate of reaction was used to compare the efficiency of the catalysts. For the reusability experiments the catalyst was washed in ultrapure water several times and dried.
The reaction with UV radiation and catalyst follows the first reaction order
| [A]t = [A]0e−kt | (1) |
3. Results and discussion
3.1. Sonication of Zn particles: formation of the Zn-based core–shell “hedgehogs”
Recently we have suggested that the surface preferable orientation etching/oxidation of metal particles4 during their ultrasound modification is an important aspect in the nanostructuring of such metals as aluminum and magnesium. In general, the ultrasound-driven modification of metals is base on cavitation induced metal depassivation (breakage of initial oxide layer), mechanochemistry (due to particle collision), and sonochemistry (structure stabilization by the sonogenerated oxide layer). Thus, the sonicated species adopts a number of features which are attractive for further applications, e.g., high surface area (more than 100 m2 g−1 for aluminum-based alloys), narrow pore size distribution in the mesoscopic range. We also demonstrated that long-term (longer then 90 min) ultrasound treatment of Zn particles results in the complete conversion of Zn into Zn oxide. Our current research demonstrates that the short-term ultrasound treatment (up to 90 min) of Zn particles gives a Zn-based material with amazing variable core–shell “hedgehog” morphologies, which depend on the initial particle sizes, Zn concentration in the solution and the duration of the sononanostructuring.The general concept of ultrasound-driven modification of zinc particles is shown in Fig. 1. During the US treatment of zinc particles the following phenomena could be observed (Fig. 1A): (I) formation of cavitation bubbles in the aqueous suspension of zinc particles; (IIa) the red/ox reactions at the interfacial regions; (IIb) interparticle collisions; (III) generation of the core–shell “hedgehog” zinc. Moreover (IV) total oxidation with total conversion to oxide structure is possible (not shown in the sketch).
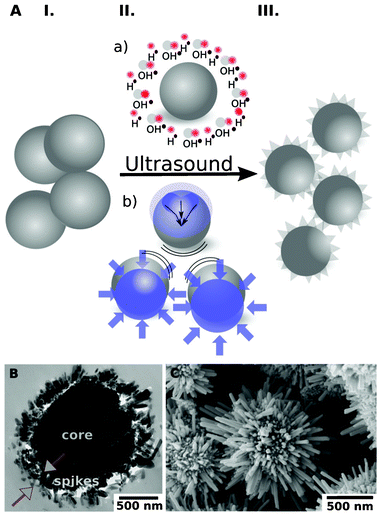 | ||
| Fig. 1 A – Sonochemical modification of zinc particles: (I) initial particles; (II) (a) chemical aspect due to surface oxidation; (b) physical aspects are caused by interparticle collisions and surface impinging by high velocity microjets providing preferable directions of etching; (III) formation of “hegdehog” zinc particles. B, C – TEM (B, 10 min US) and SEM (C, 15 min US) images of the core–shell “hedgehog” structure: metal core and the oxide nanorods attached to the core after US treatment. | ||
Zn particles of the size ∼4 μm and ∼50 μm were used for Zn sononanostructuring. The morphology of the modified Zn-based particles was studied by using scanning and transmission electron microscopy (Fig. 2). The particles after 10 min of sonication consist of the metallic Zn core covered by ZnO nanorods. The core–shell morphology can be clearly seen in the TEM image of the cross section of the modified Zn particle (Fig. 1B). The nanorods are attached perpendicularly to the Zn core. The SEM image (Fig. 1C) shows that the nm-long rods homogeneously cover the metal surface, forming so-called “hedgehogs” from Zn particles. We explain the formation of the core–shell “hedgehog” morphology to be as a result of the oxidation of the surface of Zn particles by free radicals generated during cavitation.
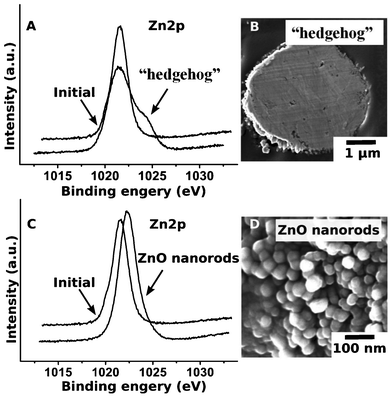 | ||
| Fig. 2 XPS spectra of the “hedgehog” zinc particles (A) and the ZnO nanorods (C), and SEM image of the ultramicrotomed Zn/ZnO particle (B) and ZnO nanorods (D) after 15 min of US treatment. | ||
3.2. Mechanism of formation of core–shell Zn-based “hedgehogs”
The formation of the core–shell Zn-based morphology was confirmed by the TEM images (Fig. 1B) and the XPS experiments (Fig. 2). The XPS spectra (Fig. 2A, C) correspond to the Zn 2p3/2. It is clearly seen that after modification, in the case of the “hedgehog” structures, there are two peaks, corresponding to the metallic core and oxidized shell. In the case of ZnO nanorods, a shift of the peak is attributed to the change of Zn0 to Zn2+.The growth of ZnO on the zinc particles can be controlled by the duration of the sonication (Fig. 3). The ultrasound-stimulated formation of zinc oxide on the surface of the zinc particles (here, ∼4 μm initial Zn particles) occurs after short-term sonication. 60 s US treatment leads to the appearance of 60 nm long ZnO nanorods on the Zn core (Fig. 3D). After 10 min of sononanostructuring the ZnO nanorods grow up to 160 nm and cover the entire core (Fig. 3F).
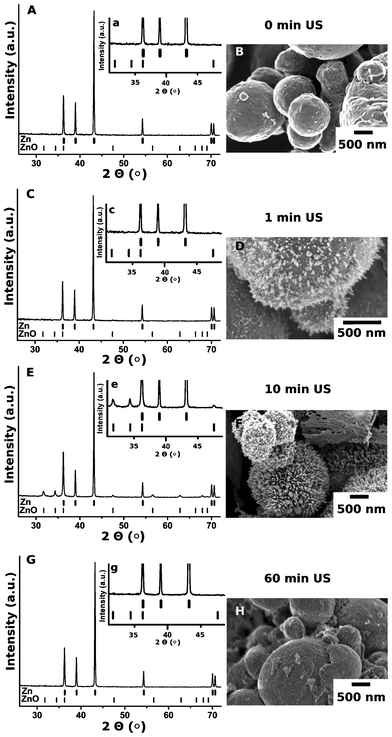 | ||
| Fig. 3 PXRD patterns and SEM images of the initial zinc particles (A, B) and the particles treated for 1 min (C, D), 10 min (E, F) and 60 min (G, H) by ultrasound. The inserts (a, c, e, g) show the magnified part of the PXRD patterns with the ZnO attributed peaks. | ||
Longer treatments (>30 min) destroy the relatively long nanorods (Fig. 3G). The 160 nm nanorods are removed from the particle surface due to friction forces during interparticle collisions. Then the surface oxidation starts again. The 60 min-sonicated samples are covered by 20 nm nanorods. The PXRD patterns in Fig. 3 A–G confirm the cycle character of the ultrasound-driven modification of Zn. A 10 min ultrasonic treatment leads to the partial conversion of Zn into ZnO, which results in the “hedgehog” morphology of the particles. The PXRD pattern of the 10 min-modified samples exhibits the peaks of both the metallic Zn and ZnO. After 30 min the “hedgehog” structures lose their spikes. Two separate phases, Zn particles and ZnO nanorods, can be distinguished and separated. The PXRD pattern of the Zn after loss of the ZnO nanorod shell is shown in Fig. 3E.
The size of the initial Zn particles also affects the modification process and, therefore, the morphology of the modified systems (Fig. 4). The modification of the ∼4 μm and ∼50 μm particles leads to surface oxidation, growth of ZnO nanorods and their detachment. These ZnO nanorods are formed and detached in a cyclic manner. The PXRD patterns and the SEM images in Fig. 3 show that the nanorods grow, reach a maximum size, detach during sonication, and then the cycle starts again. However, the character of growth of the metal oxide depends on the particle size. The SEM images (Fig. 4) demonstrate that the ∼50 μm particles are covered by randomly attached ZnO nanorods (Fig. 4A, C, E). The concentration of these nanorods increases with the sonication duration. The increase in ZnO concentration on the surface of the ∼50 μm particles was confirmed by PXRD (not shown here). The ∼4 μm Zn particles are covered by the perpendicularly attached ZnO. The surface area of the initial ∼4 μm zinc particles is 0.4 m2 g−1. The surface area of these particles reaches 2.6 m2 g−1 after 10 min of sonication. After 30 min of US treatment, the surface of the “hedgehogs” is covered by 20 nm ZnO rods and has the surface area of 1.3 m2 g−1. The surface area of the ∼50 μm particles can achieve a maximum of 20 m2 g−1 after 10 min of sonication due to the formation of a thick layer of randomly distributed 160 μm ZnO spikes. After 90 min of modification the surface area of the ∼50 μm particles is also decreased up to 12 m2 g−1, which is due to the formation of 100 nm nanorods on the metal surface. Thus, the surface area of the modified particles depends on the character of growth and distribution of the ZnO nanorods on the metal core. At the beginning of the sonication treatment (10–15 min) we observed the formation of the very interesting tubular ZnO nanorods4 on the surface of the ∼50 μm particles that are probably responsible for the increased surface area of such particles. However, as we will demonstrate in the next part of this article, these nanorods do not significantly contribute to the catalytic activity of the Zn particles. It is likely that they are not accessible to the substrate molecules. The 15 min-sonicated ∼4 μm Zn particles (Fig. 4D) demonstrate the core–shell morphology, where the Zn core is homogeneously covered by a monolayer of ZnO nanorods. The longer sonication time (the 60 min-sonicated particles in Fig. 4F) leads to the formation of randomly distributed 100 nm ZnO nanorods, similar to the ZnO layer formed on the ∼50 μm particles. These particles demonstrate the highest catalytic activity which we will discuss here later.
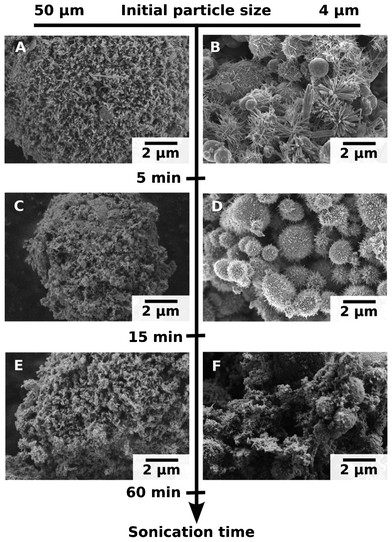 | ||
| Fig. 4 SEM images of the ∼4 μm and ∼50 μm initial particle size after 5 (A, B), 15 (C, D) and 60 min (E, F) of US treatment. | ||
Based on all characterizations performed above, we can summarize that the ultrasound modification of the Zn particles has a cycle character that depends on the sonication time and particle size. The free radicals generated by the ultrasound oxidize the surface, after which, the ZnO nanorods rapidly grow on the metallic core. The long nanorods are detached because of interparticle collisions in the sonicated suspensions. We could distinguish two phases: the relatively smooth Zn particles and the ZnO nanorods. When the oxidation continues and the nanorods grow again on the surface. The size of the nanorods can be controlled by the particle size and the duration of sonication. Short-term sonication (up to 90 min) leads to the formation of core–shell “hedgehogs” with an increased surface area.
3.3. Photocatalytic activity
The functionality of the sononanostructured Zn can be related to its properties as a semiconductor. When the modified zinc is illuminated by UV light, the migration of electrons to the zinc core begins (eqn (2)), and so positive holes (h+) are formed.42–44 When the semiconductor is immersed in an aqueous medium, the spontaneous adsorption of water molecules in the liquid occurs. Then an electron is transferred to the acceptor molecule and the donor molecule gives an electron to the semiconductor particle. The holes generate ˙OH by reacting with the water molecules (eqn (3)), and the O2 molecule accepts an electron to form the super-oxide radical O2˙− (eqn (4)). These O2˙− radicals act as strong oxidizing agents and they also contribute to the formation of hydrogen peroxide (eqn (5)–(8)).45 Thus, as an example of the possible application range of the sononanostructured zinc, we tested the photocatalytic activity of the core–shell “hedgehog” in the detoxification of methyl orange (MO). The radicals formed in the presence of a semiconductor can react with the dye molecule, disrupting it in its conjugated system, which leads to the complete decomposition of the dye.46,47 | (2) |
| H2O + ZnO(h+) → ˙OH + H+ + ZnO | (3) |
| O2 + e− → O2˙− | (4) |
| O2˙− + H+ → HO2˙ | (5) |
| 2HO2˙ → H2O2 + O2 | (6) |
| H2O2 + O2˙− → ˙OH + O2 + OH− | (7) |
| ˙OH + dye (MO) → dye (MO) mineralization | (8) |
In Fig. 5 are highlighted some results of the detoxification of MO by the core–shell “hedgehog” zinc. The dye degradation was monitored using the UV/VIS spectra. The absorption peaks, corresponding to dye, diminished and finally disappeared under irradiation, which indicates that the dye is degraded. No new absorption bands appear in either the visible or ultraviolet regions. The spectrum of MO in the visible region exhibits a band with a maximum at 464 nm. The decrease of the absorption peaks of MO at λmax = 464 nm indicates a rapid degradation of the azo dye. It also indicates that the nitrogen–nitrogen double bond (–N=N–) of MO is the most active site for oxidation attack. Complete degradation of the dye was observed after 50 min using the optimized conditions. MO in the absence of the photocatalyst is stable under UV-irradiation. In the absence of photocatalyst no colour change was observed.
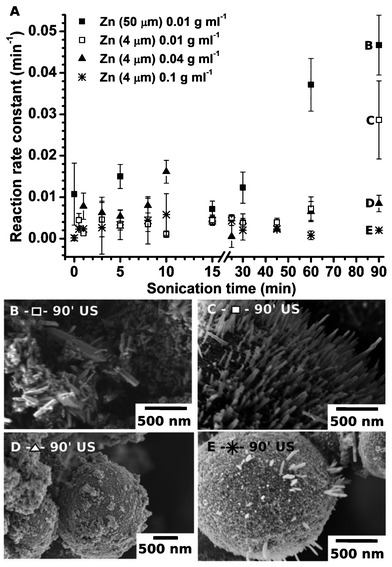 | ||
| Fig. 5 The reaction rate constant k is shown to be independent of the ultrasound treatment duration. We used 10 mg of the US-Zn (A). The SEM images of the samples prepared for 90 min of sonication: 0.01 g mL−1 50 μm Zn particles (B), 0.01 g mL−1 4 μm particles (C), 0.04 g mL−1 4 μm particles (D) and 0.1 g mL−1 4 μm particles (E). | ||
To optimize the ultrasound treatment of the Zn particles, we tested the catalytic activity of the US-Zn prepared over different sonication times. Fig. 5 shows the catalytic activity of the samples prepared at different concentrations of Zn in water and by using ∼50 μm and ∼4 μm initial Zn particles. For all samples we observed the cycle character of the reaction rate constant vs. sonication time.
At the beginning of modification, up to 10 min of sonication, we observed an increase in the rate constant for all samples. After 10 min of US exposure the activity decreases rapidly and converges to a k value comparable to the untreated zinc. The observed dependence can be explained by the ultrasound-driven change of the particle morphology. During the first 10 min of modification, “hedgehogs” with increased surface areas are formed. After long exposure to US, the “hedgehogs” lose their spikes, which results in the loss of photocatalytic activity (Fig. 3).
The catalytic activity of the sononanostrustured Zn prepared at longer sonication times (up to 90 min) strongly depends on the concentration of the sonicated particles and the initial size of the Zn particles. The ∼4 μm and ∼50 μm zinc particles exhibit different photocatalytic activity. We observed, that 90 min US exposure leads to the highest reaction rate constant k ∼ 0.05 min−1 for 10 mg of ∼50 μm Zn particles, where the same amount of ∼4 μm zinc particles reached k ∼ 0.03 min−1.
The fact that the modified ∼4 μm and ∼50 μm zinc particles exhibit different activities could be explained by the higher concentration of ZnO nanorods randomly attached to the bigger Zn core, which are more accessible to the MO molecules. The difference in the surface morphology of both samples (∼4 μm and ∼50 μm Zn particles) can be clearly seen in the SEM images in Fig. 5. Additionally, the surface area of the ∼50 μm particles is 12 m2 g−1 and 1.3 m2 g−1 after 90 min-sonication. This is not the maximum surface area we could achieve for the sononanostructured Zn. However, the 90 min-sonicated Zn-based materials exhibit the highest rate of MO conversion, which is probably due to the better accessibility of the ZnO nanorods formed in 90 min modification. The control experiments with commercial ZnO demonstrate an activity similar to US-Zn. The reaction rate constant of the commercial ZnO was estimated to be ca. 0.05 min−1. In Fig. 5A we can also see the influence of the concentration of the sonicated particles on the rate constant. The optimal concentration of Zn particles during sononanostructuring was found 0.01 g mL−1. The higher concentration of Zn particles leads to fast Zn modification but the nanorods might also be rapidly detached from the Zn core surface due to the vigorous interparticle collisions stimulated by the sonication. At the same time, the lower Zn concentration (<0.01 g mL−1) leads to a reduction in the number of collision events between the particles. The particle modification became very slow and we could not achieve the “hedgehog” morphology and comparable catalytic activity.
4. Conclusions
We have shown that the sononanostructuring of zinc is an easy and green method for the production of a wide spectrum of interesting zinc-based materials with spectacular morphologies and functionalities, i.e., core–shell “hedgehogs” and ZnO nanorods. By using ultrasound, the nanostrucruring of zinc can be performed in a fairly easy and cost efficient way,7,8 avoiding aggressive media, harsh additives and oxidants. The Zn/ZnO “hedgehogs” have a Zn metallic core covered by ZnO nanorods. The form and length of these nanorods can be controlled by the sonication conditions. The “hedgehogs” demonstrate a good photocatalytic activity due to the semiconductive nature of the ZnO spikes. We do believe that the sonochemical approach to the nanostructuring of materials provides a novel methodology for the focused construction and functionalization of solids. The nanostructured semiconductor zinc-based material demonstrated here could be a promising component in the construction of a whole range of composite systems for photocatalysis, gas sensing, photovoltaic, etc. The metallic nature of the Zn core could be applied to the formation of corrosion protection systems.Acknowledgements
We thank B. Putz (Uni Bayreuth) for the PXRD measurements and C. Kunert (Uni Bayreuth) for SEM images. We thank C. Hasenöhrl for fruitful discussions. J. D. and D. V. A. thank project A11 SFB 840 for financial support. E. V. S. thanks the Alexander von Humboldt Foundation.References
- K. S. Suslick, Science, 1990, 247, 1439–1445 CAS.
- K. S. Suslick, D. J. Casadonte, M. L. H. Green and M. E. Thompson, Ultrasonics, 1987, 25, 56–59 CrossRef CAS.
- E. V. Skorb, D. G. Shchukin, H. Möhwald and D. V. Andreeva, Nanoscale, 2010, 2, 722–727 RSC.
- E. V. Skorb, D. Fix, D. G. Shchukin, H. Möhwald, D. V. Sviridov, R. Mousa, N. Wanderka, J. Schäferhans, N. Pazos-Pérez, A. Fery and D. V. Andreeva, Nanoscale, 2011, 3, 985–993 RSC.
- E. Skorb, D. Shchukin, H. Möhwald and D. Andreeva, Langmuir, 2010, 26, 16973–16979 CrossRef CAS.
- D. V. Andreeva, D. V. Sviridov, A. Masic, H. Möhwald and E. V. Skorb, Small, 2012, 8, 820–825 CrossRef CAS.
- N. Pazos-Perez, J. Schäferhans, E. V. Skorb, A. Fery and D. V. Andreeva, Microporous Mesoporous Mater., 2012, 154, 164–169 CrossRef CAS.
- J. Schäferhans, S. Gómez-Quero, D. V. Andreeva and G. Rothenberg, Chem.–Eur. J., 2011, 17, 12254–12256 CrossRef.
- S. J. Pearton, D. P. Norton, K. Ip, Y. W. Heo and T. Steiner, Prog. Mater. Sci., 2005, 50, 293–340 CrossRef CAS.
- H. M. a. Ø. Ôzgûr, Zinc Oxide, Fundamentals, Materials and Device Technology, Wiley-VCH Verlag, Weinheim, 2009 Search PubMed.
- B. Dindar and S. Içli, J. Photochem. Photobiol., A, 2001, 140, 263–268 CrossRef CAS.
- D. Li and H. Haneda, Chemosphere, 2003, 51, 129–137 CrossRef CAS.
- S. K. Kansal, M. Singh and D. Sud, J. Hazard. Mater., 2007, 141, 581–590 CrossRef CAS.
- H. Fu, T. Xu, S. Zhu and Y. Zhu, Environ. Sci. Technol., 2008, 42, 8064–8069 CrossRef CAS.
- N. Daneshvar, D. Salari and A. R. Khataee, J. Photochem. Photobiol., A, 2004, 162, 317–322 CrossRef CAS.
- H.-F. Lin, S.-C. Liao and S.-W. Hung, J. Photochem. Photobiol., A, 2005, 174, 82–87 CrossRef CAS.
- C. Hariharan, Appl. Catal., A, 2006, 304, 55–61 CrossRef CAS.
- K. G. Kanade, B. B. Kale, J.-O. Baeg, S. M. Lee, C. W. Lee, S.-J. Moon and H. Chang, Mater. Chem. Phys., 2007, 102, 98–104 CrossRef CAS.
- R. Ullah and J. Dutta, J. Hazard. Mater., 2008, 156, 194–200 CrossRef CAS.
- C. Ye, Y. Bando, G. Shen and D. Golberg, J. Phys. Chem. B, 2006, 110, 15146–15151 CrossRef CAS.
- E. Yassıtepe, H. C. Yatmaz, C. Öztürk, K. Öztürk and C. Duran, J. Photochem. Photobiol., A, 2008, 198, 1–6 CrossRef.
- B. Pal and M. Sharon, Mater. Chem. Phys., 2002, 76, 82–87 CrossRef CAS.
- J. L. Yang, S. J. An, W. I. Park, G. C. Yi and W. Choi, Adv. Mater., 2004, 16, 1661–1664 CrossRef CAS.
- A. M. Ali, E. A. C. Emanuelsson and D. A. Patterson, Appl. Catal., B, 2010, 97, 168–181 CrossRef CAS.
- M. R. Hoffmann, S. T. Martin, W. Choi and D. W. Bahnemann, Chem. Rev., 1995, 95, 69–96 CrossRef CAS.
- P. R. Gogate and A. B. Pandit, Adv. Environ. Res., 2004, 8, 501–551 CrossRef CAS.
- C. Comninellis, A. Kapalka, S. Malato, S. A. Parsons, I. Poulios and D. Mantzavinos, J. Chem. Technol. Biotechnol., 2008, 83, 769–776 CrossRef CAS.
- J. W. Tang, Z. G. Zou, J. Yin and J. H. Ye, Chem. Phys. Lett., 2003, 382, 175 CrossRef CAS.
- R. Asahi, T. Morikawa, T. Ohwaki, K. Aoki and Y. Taga, Science, 2001, 293, 269 CrossRef CAS.
- X. Tao, W. Ma, T. Zhang and J. Zhao, Angew. Chem., Int. Ed., 2001, 40, 3014 CrossRef CAS.
- W. Ma, J. Li, X. Tao, J. He, Y. Xu, J. C. Yu and J. Zhao, Angew. Chem., Int. Ed., 2003, 42, 1029 CrossRef CAS.
- J. W. Tang, Z. G. Zou, J. Yin and J. H. Ye, Angew. Chem., Int. Ed., 2004, 43, 4463 CrossRef CAS.
- B. Pal and M. Sharon, Mater. Chem. Phys., 2002, 76, 82–87 CrossRef CAS.
- A. A. Aal, S. A. Mahmoud and A. K. Aboul-Gheit, Mater. Sci. Eng., C, 2009, 29, 831–835 CrossRef.
- E. YassItepe, H. C. Yatmaz, C. Öztürk, K. Öztürk and C. Duran, J. Photochem. Photobiol., A, 2008, 198, 1–6 CrossRef CAS.
- E. R. Carraway, A. J. Hoffman and M. R. Hoffmann, Environ. Sci. Technol., 1994, 28, 786–793 CrossRef CAS.
- A. J. Hoffman, E. R. Carraway and M. R. Hoffmann, Environ. Sci. Technol., 1994, 28, 776–785 CrossRef CAS.
- S. Liao, H. Donggen, D. Yu, Y. Su and G. Yuan, J. Photochem. Photobiol., A, 2004, 168, 7–13 CrossRef CAS.
- J. J. Wu and S. C. Liu, Adv. Mater., 2002, 14, 215–218 CrossRef CAS.
- M. Bizarro, Appl. Catal., B, 2010, 97, 198–203 CrossRef CAS.
- C. Pacholski, A. Kornowski and H. Weller, Angew. Chem., Int. Ed., 2002, 41, 1188–1191 CrossRef CAS.
- P. V. Kamat, Pure Appl. Chem., 2002, 74, 1693–1706 CrossRef CAS.
- A. Wood, M. Giersig and P. Mulvaney, J. Phys. Chem. B, 2001, 105, 8810–8815 CrossRef CAS.
- F. Han, V. S. R. Kambala, M. Srinivasan, D. Rajarathnam and R. Naidu, Appl. Catal., A, 2009, 359, 25–40 CrossRef CAS.
- M. Bizarro, M. A. Tapia-Rodríguez, M. L. Ojeda, J. C. Alonso and A. Ortiz, Appl. Surf. Sci., 2009, 255, 6274–6278 CrossRef CAS.
- J. M. Herrmann, Top. Catal., 2005, 34, 49–65 CrossRef CAS.
- C. A. K. Gouvêa, F. Wypych, S. G. Moraes, N. Durán, N. Nagata and P. Peralta-Zamora, Chemosphere, 2000, 40, 433–440 CrossRef.
- S. Brunauer, L. S. Deming, W. E. Deming and E. Teller, J. Am. Chem. Soc., 1940, 62, 1723–1732 CrossRef CAS.
| This journal is © The Royal Society of Chemistry 2012 |
