Dynamic potential–pH diagrams application to electrocatalysts for water oxidation†
Alessandro
Minguzzi
a,
Fu-Ren F.
Fan
b,
Alberto
Vertova
a,
Sandra
Rondinini
a and
Allen J.
Bard
b
aDipartimento di Chimica Fisica ed Elettrochimica, Universitá degli Studi di Milano, Via Golgi, 19, 20133, Milan, Italy
bCenter for Electrochemistry, Department of Chemistry and Biochemistry, The University of Texas at Austin, Austin, TX 78712-0165, USA
First published on 3rd November 2011
Abstract
The construction and use of “dynamic potential–pH diagrams” (DPPDs), that are intended to extend the usefulness of thermodynamic Pourbaix diagrams to include kinetic considerations is described. As an example, DPPDs are presented for the comparison of electrocatalysts for water oxidation, i.e., the oxygen evolution reaction (OER), an important electrochemical reaction because of its key role in energy conversion devices and biological systems (water electrolyses, photoelectrochemical water splitting, plant photosynthesis). The criteria for obtaining kinetic data are discussed and a 3-D diagram, which shows the heterogeneous electron transfer kinetics of an electrochemical system as a function of pH and applied potential is presented. DPPDs are given for four catalysts: IrO2, Co3O4, Co3O4 electrodeposited in a phosphate medium (Co–Pi) and Pt, allowing a direct comparison of the activity of different electrode materials over a broad range of experimental conditions (pH, potential, current density). In addition, the experimental setup and the factors affecting the accurate collection and presentation of data (e.g., reference electrode system, correction of ohmic drops, bubble formation) are discussed.
1. Introduction
Chemists have often adopted graphical methods to represent the properties of elements and their compounds. Generally these diagrams are useful in representing chemical behavior over a wide range of conditions and are particularly useful in allowing experimental data to be considered and interpreted by a non-expert audience. For example, thermodynamic data have been summarized in diagrams that enable a user to predict quickly the (thermodynamic) stability or reactivity of a given species in a given oxidation state under selected conditions, e.g., the popular diagrams proposed by Latimer1 (which show potentials and oxidation states) and by Frost2 (which represent free energy as a function of oxidation state). These representations are easily and rapidly readable; giving the reader useful thermodynamic information, but each diagram is confined to a given set of conditions: pH, temperature and pressure. The most popular diagrams are probably the Pourbaix (or potential–pH) diagrams3 that show the stability regions of various phases and compounds of a given element or multielement system on a potential vs. pH plane. These are used extensively in corrosion science for determining when metals are thermodynamically stable and when they are in a passive state.4 They have also been used to treat the portioning of ionizable species at the interface between two immiscible electrolyte solution.5 However such diagrams are little used for predicting possible reactions between different species by using diagrams for two different elements or in general considerations of electrochemical cells, perhaps because kinetic considerations are so important in these applications. As with all predictions based on thermodynamic data, the ability to predict reactivity and the actual stability of phases is related to the kinetics of the reactions that depend on pH, temperature and applied potential, and, especially when one is considering multielectron transfer reactions, the predictive strength of E–pH diagrams is limited. Here we propose a dynamic potential–pH diagram (DPPD) to extend potential–pH diagrams by the addition of a third axis representing the rate of the investigated reaction, as represented by the current density (potential and pH dependent). We also use a color code to represent the DPPD in two dimensions so that it can represent kinetic and thermodynamic information at the same time. While such DPPD diagrams will be useful in many electrochemical systems, it is especially relevant in electrocatalysis. Electrocatalysts promote heterogeneous inner-sphere electron transfer reactions and are important scientifically in obtaining an understanding of how the material and structure affect their activity and also for practical applications, such as electrochemical energy conversion devices.6 Electrocatalysts that show high activity, low cost, and good stability, for which PPDs are particularly useful by showing where an active phase is stable, are widely investigated, and a means of comparing different compositions (e.g., metals, oxides, and alloys) and structures over a wide range of potential, pH and current density values is needed. Simply demonstrating that a material shows improved behavior compared to a poor one (e.g., a bare carbon substrate) is not sufficient to demonstrate the real value of the electrocatalyst. We illustrate this application by considering electrocatalysts for the oxygen evolution reaction (OER). On the basis of data obtained under the same experimental conditions for several different electrocatalysts, we show that the DPPDs allow a simple method of comparing their activity.The OER is one of the most studied electrochemical reactions, because of its importance in photosynthesis (photosystem II) and in energy conversion systems (the anodic process in the water splitting reaction for the production of H2 utilizing electrical or radiant energy).
| 2H2O → 2H2 + O2; ΔG° = 237 kJ mol−1 (H2O, T = 298 K; pO2 = pH2 = 1 atm) | (1) |
The standard potential in acidic solutions is:
| O2 + 4e− + 4H+ = 2H2O; E° = 1.229 V (vs. NHE, STP)7 | (2) |
If conducted in alkaline media, the oxygen source is hydroxyl anions and the standard potential is:
| O2 + 4e− + 2H2O = 4OH−; E° = 0.401 V | (3) |
Because the OER is a complicated inner-sphere reaction (loss of 4e, 4H+, and oxygen bond formation per O2 formed), it is characterized by slow kinetics and OER electrocatalysts have been studied intensively over the last 40 years.8 These have mainly focused on gauging the activity of different electrode materials and trying to understand the factors that determine this activity. Most studies have been conducted in strong acid or alkaline solutions, representing the best conditions for performing industrial water electrolysis, because the relatively high mobility of H+ and OH− leads to more conductive solutions and minimized resistive losses. Fewer studies have been done for the OER in neutral media, although such media could be of interest in photoelectrochemical cells. Trasatti8 noted that the reaction rate usually displays a minimum at intermediate pH values, and suggested that this was the result of poor availability of OH− ions under these conditions; both H2O and OH− can serve as the reactive species.
Many materials are known to be active as anodes for the OER.8 However, many metals are thermodynamically unstable with respect to formation of the oxide at potentials at which the OER occurs.3 Generally the reaction occurs on an oxidized surface and this is also a reason why water electrolyses are often carried out under alkaline conditions, where such oxides are stable. More recently, as hydrogen production has become more important in energy conversion and storage, water electrolyses in acidic media has become of interest, mainly because of the high purity of the products (free from alkaline mists) and the possibility of attaining higher current densities with better safety and compactness.9 On the other hand, very few materials are active and stable for the OER under strongly acidic conditions, limiting the choice to iridium oxide and ruthenium oxide, the former being more expensive and slightly less active, but more stable than the latter.10,11,12 At neutral pH very few materials are available.13 Clearly from these considerations the number of available materials is wide and the choice of the correct material depends on the desired operating conditions, e.g., pH.
We describe here the application of DPPDs for the OER on four different anodes: iridium oxide (IrO2, prepared by thermal decomposition), cobalt oxide (Co3O4, prepared by thermal decomposition), cobalt oxide in the form of an amorphous layer13 by electrodeposition in the presence of phosphate anions (Co–Pi electrodeposited) and platinum. Note that our goal is to show how to construct and use color-coded diagrams and the factors needed to compare the activity of different materials under a broad range of conditions. The current, which is proportional to the reaction rate, recorded at various potential values and at the selected pH, is the experimentally monitored activity parameter. Even though the construction of DPPDs will be described in detail in the next paragraphs, an example is given in Fig. 1 in the case of IrO2. As can be seen, a typical DPPD contains both thermodynamic information (exactly like in a Pourbaix plot) and kinetic ones. In this case, the former are relevant to the stability of phases related to nature of the electrode material, the latter describe the rate of oxygen production thanks to the use of a color-code.
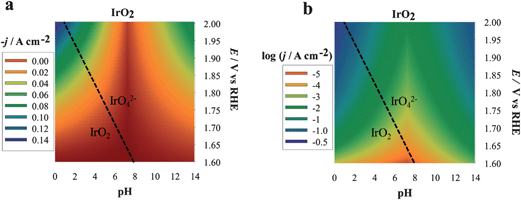 | ||
| Fig. 1 Three-dimensional dynamic potential–pH diagrams of IrO2 plotted in 2D by use of a color code. The z axis is expressed in terms of current density (a) or of its logarithm (b) A zone colored in blue or violet represents higher current densities and, therefore, higher activity; zones colored in orange or red represent lower activity conditions. All dashed lines represent the borders of thermodynamic stability of different species, as derived from Pourbaix diagrams, considering the activity of dissolved species equal to 1. | ||
2. Experimental
2.1. Materials preparation
Co3O4 and IrO2 were prepared by thermal decomposition of a 0.5 M Co(NO3)2·6H2O (99.999%, Alfa Aesar) solution in ethanol on Ni plates (0.25 mm thick, 99.5%, Alfa Aesar, Ward Hill, MA) and of a 0.2 M IrCl3 solution in ethanol on Ti plates (0.25 mm thick, 99.99%, Aldrich, Milwaukee, WI). Ti and Ni plates were first roughened with abrasive paper (1000 mesh, Buehler, Lake Bluff, IL). The Ti plates were further treated by immersing in a 10% aqueous oxalic acid solution at 80 °C for 1 h. The solutions were deposited on the substrate with a glass capillary, dried in an oven at 80 °C for 10 min and then calcined for 10 min at the chosen temperatures: 300 °C for Co3O4 and 500 °C for IrO2, as reported.14,15 The deposition–drying–calcination cycle was repeated until an approximate weight of 1 mg per cm2 geometric area was obtained. The plates were then calcined again for 1 h at the same temperature. Measurements on Pt were conducted using a 1 mm radius disk previously polished with 1 mm and 0.3 mm alumina powder.Several Co3O4–Pi (also called Co–Pi) on Ni electrodes were prepared based on a slightly modified procedure (method A) reported previously,13,16 as described below. Briefly, a Ni plate 0.25 mm thick, 99.5%, Alfa-Aesar, without further roughening of its surface) after sonicating and cleaning in ethanol was used as the substrate for electrodeposition. Electrodeposition was performed in a two-compartment electrochemical cell with a glass frit junction of medium porosity. For catalyst electrodeposition, the auxiliary compartment was charged with 0.1 M PBS (pH = 6.8) and the working compartment was charged with 0.1 M PBS (pH = 6.8) containing 0.5 or 1.0 mM Co2+. Typically, a 1–2 cm2 area of the electrode was immersed in the solution. A graphite rod was used as the auxiliary electrode. Electrolysis was carried out at 1.10 V vs. Ag/AgCl reference electrode with stirring and without IR compensation and with the salt bridge of the reference electrode placed 2–3 mm from the substrate surface. The amounts of Co–Pi electrodeposited were monitored by measuring the anodic charges collected during deposition with a coulometer (typically 4 C cm−2). No further thermal treatment was performed.
We also carried out the Co–Pi electrodeposition based on the procedures (method B) reported previously by Nocera et al.,13,16,17 in which an FTO (sheet resistance = 14 Ω □−1) coated glass or a Ni plate (0.25 mm thick, 99.5%, Alfa-Aesar, without further roughening of its surface) after sonicating in the presence of a Triton-X surfactant, then water, then IPA followed by air drying was used as the substrate for electrodeposition. The solution was not stirred during the deposition and all measurements were carried out at room temperature (∼22 °C). The solutions were not bubbled with N2 or any other inert gas prior to deposition. Also, the Co-containing deposition bath was prepared immediately before deposition. Electrolysis was carried out (a) at 0.85 V vs. an Ag/AgCl reference electrode overnight (16–17 h) to collect an anodic charge of 0.35 C cm−2 or (b) at 1.10 V vs. an Ag/AgCl electrode for ∼1.5 h to collect an anodic charge of 4.3 C cm−2. Note that deposition at low potential (i.e., 0.85 V) results in a much slower deposition rate relative to that obtained at a higher potential (e.g., 1.10 V).
2.2. Steady-state polarization (I–E) curves (via stair-case voltammetry)
Steady-state I–E curves were recorded in a two-compartment cell, separated by a glass frit. An Ag/AgCl and a Pt coil (or graphite rod) were used as the reference and the counter electrode, respectively. The reference electrode was inserted in a pipette filled with agar (purified grade, Fisher Scientific, Fair Lawn, NJ), impregnated with 0.1 M NaClO4 (99%, Aldrich, Milwaukee, WI). Solutions were magnetically stirred. All measurements were conducted by the stair-case voltammetry of an Autolab PGSTAT30 Potantiostat/Galvanostat (Eco Chemie B.V. Utrecht, The Netherlands) with the upper potential limit between 1.3 and 2.0 V (vs. RHE), with 10 mV steps every 100 s (scan rate 0.1 mV s−1) and measuring the current at the end of each step. Before the recording of each steady-state curve, the initial potential was applied for 300 s. Current densities are reported with respect to the geometric area of the working electrode.Each material was tested at least for three different pH values. IrO2 and Pt were characterized in 1 M HClO4 (pH 0.1); 1 M phosphate buffer solution (PBS), pH 6.8, as an equimolar mixture of NaH2PO4 and Na2HPO4. Neutral pH conditions were also achieved using 1 M NaClO4 (pH 6.0) to study the effect of unbuffered solutions. Cobalt-based materials are thermodynamically unstable in strongly acidic media; therefore they were studied in 1 M acetate buffer solution at pH 4.7 (obtained by mixing equimolar solutions of acetic acid and sodium acetate) or in 1 M PBS at pH 4.3, 1 M PBS at pH 6.8 (equimolar mixture of NaH2PO4 and Na2HPO4) and 11.3 (equimolar mixture of Na3PO4 and Na2HPO4) as well as 1 M NaOH (pH 14.0).
All electrolyte solutions were prepared with deionized Milli-Q water. HClO4 (Analytical reagent grade, 70%, Aldrich), NaOH (Certified A.C.S., ≥99.2%, Fisher Scientific), Na3PO4 (A.C.S. Reagent, MCB), Na2HPO4 (A.C.S. Reagent, MCB), NaH2PO4 (≥99.5%, Fluka), acetic acid (Glacial, Analytical reagent, MCB) and sodium acetate (Certified A.C.S., Fisher Scientific) were used as received.
3. Results and discussion
3.1. Factors of importance in comparison of electrocatalysts
The following variables considered in the preparation of DPPDs are described below.E − Erev = ηact = a + b![[thin space (1/6-em)]](https://www.rsc.org/images/entities/char_2009.gif) log(j) log(j) | (4) |
| η = ηact + IRu + ηmt + ηbubble | (5) |
| Erev = E° + (2.303RT/4F)log pO2 − (2.303RT/F)pH | (6) |
The NHE is the most frequently used reference electrode in potential–pH diagrams and could be used in DPPDs as well. However, the NHE is less useful as a reference for comparing the electroactivities of a material toward OER, since Erev is a function of pH. This also applies to any non pH-dependent reference electrode, e.g., Ag/AgCl and the saturated calomel electrode (SCE). To overcome these drawbacks, a good choice is the use of a reference electrode that offers the same dependence on pH as the equilibrium potential of the reaction under investigation. For example, the reversible hydrogen electrode (RHE), which can be constructed as a Pt/H2 (1 atm) immersed in the test solution at a given pH, is a good candidate for the OER, since the potential dependence on pH for the two systems is the same:
| ERHE = 0.00 − 0.0591pH (at 298.15 K) | (7) |
It is, of course, also possible to perform electrochemical experiments with any reference electrode and then calculate the relative potential values with respect to the RHE (or NHE).
3.2. The dependence of kinetics on pH; the importance of using buffer solutions near neutral pH.
One can represent the pH dependence in the DPPD by using selected pH values (e.g. extreme values and at least one close to neutral pH). The dependence of the kinetics of the OER on pH is complicated (and this paper is not intended as a comprehensive review of this topic), because both H2O and OH− can serve as the reactive species8 and the reaction rate usually displays a minimum at intermediate pH values.21 If removal of an electron from OH− is taken as a key step, a progressively increasing activity (at constant overpotential) with increasing pH might be expected. In acidic solutions the discharge of OH from H2O may be kinetically more difficult than from OH−. The situation is more complicated because other factors, like changes in the reaction mechanism or in the rate-determining step, and changes in the state of the electrocatalyst surface because of the acid/base nature of the electrode metal oxides come into play.The most complicated pH range is the one between 2 and 12, because one cannot buffer the solutions without adding additional ions (e.g., phosphates, acetates, borates) that can specifically adsorb on the electrode surface, thus modifying its electrochemical properties.22 Good buffering is required to maintain the same pH value at the electrode surface as in the bulk solution. This is shown in Fig. 2, in which the I–E curves recorded with an IrO2 electrode in an unbuffered solution with a nonadsorbing anion, 1 M NaClO4, and a buffered solution with a specifically adsorbing anion, 1 M phosphate (PBS) both at the same bulk pH. Even in the presence of an adsorbing anion, the curve recorded in the buffered solution shows higher current densities over the whole potential range. This demonstrates that the evaluation of the electrocatalytic activity towards the OER in unbuffered neutral media can be difficult because of the production of H+ ions accompanying O2 evolution. Under reasonable current densities, the local pH at the electrode surface can show a dramatic decrease, thus increasing the actual Erev (see eqn (6)). At a constant applied potential this in turn leads to a decrease of the overpotential, thus making the kinetics of reaction (1) less favorable. The need for pH buffering is also evident in the case of Co–Pi. Fig. 3 compares I–E curves recorded with Co–Pi on Ni in 0.1 M and 1 M PBS. To minimize the difference in the effect of adsorbed anionic species of the pH buffer, particularly at highly positive potential, on the curves, we adopted a PBS buffer at a given phosphate concentration with the pH adjusted over the range 4.3 to 11.3.
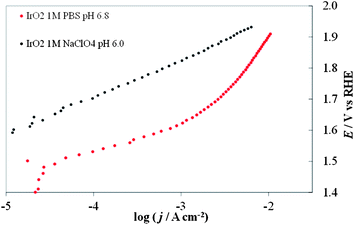 | ||
| Fig. 2 Comparison of steady-state curves of an IrO2 electrode in 1 M PBS (red dots) at pH 6.8 and in (black dots) 1 M NaClO4 at pH 6.0. | ||
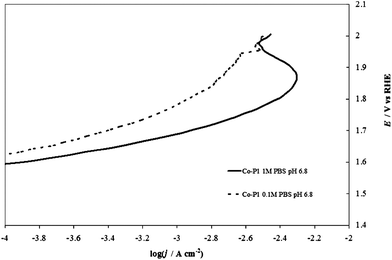 | ||
Fig. 3 Comparison of steady-state curves of a Co–Pi (4 C cm−2) on Ni electrode at pH 6.8 in (—) 1 M PBS and (![[dash dash, graph caption]](https://www.rsc.org/images/entities/char_e091.gif) ) 0.1 M PBS. ) 0.1 M PBS. | ||
In 0.1 M PBS, the buffer capacity may be insufficient to compensate for the rapid decrease of pH in the proximity of the electrode surface at reasonable current densities. On the other hand, in 1 M PBS, the current is higher and bubble formation becomes more intense. This can lead to the partial peeling of the electrodeposited layer from the supporting Ni plate at higher potentials (the same phenomenon was also observed in 1 M PBS at pH 11.3 and in acetate buffer), as demonstrated also by the current decrease observed at potentials higher than 1.9 V (vs. RHE) and c.d. >5 mA cm−2 (see Fig. 3). The formation of an H+ diffusion layer over the electrode surface is well demonstrated by forcing solution convection by stirring. As depicted in Fig. 4, the current recorded in 0.1 M PBS, increases when the solution is stirred.
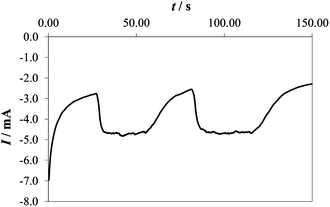 | ||
| Fig. 4 Chronoamperometric curve recorded at 2.0 V (vs. RHE) in 0.1 M PBS on a Co–Pi electrode while alternatively turning on and off the magnetic stirrer. Note that the measurement started with the stirrer off. | ||
3.3. Correction for the ohmic drop contribution
As shown, ohmic drops can greatly affect the collection of reliable data, especially at high currents. Contributions to the overall ohmic drop come from the electrolyte solution, the electrode material and the contact between the latter and the support.Many methods for the determination of the uncompensated resistance have been proposed.23 Positive feedback compensation, current interruption and electrochemical impedance spectroscopy (EIS) are valid methods. One of the most accurate, EIS, requires data interpretation that is heavily dependent on the modeling of the equivalent circuit and quite a bit of analyses. For correcting the data collected in the present paper, we adopted a method proposed by Krastjic and Trasatti.24 It starts from the Tafel law and assumes that the solution ohmic resistance is constant (i.e. does not depend on potential or changes in concentration in the diffusion layer):
E = Ecorrect + RuI = a + b![[thin space (1/6-em)]](https://www.rsc.org/images/entities/char_2009.gif) ln ln![[thin space (1/6-em)]](https://www.rsc.org/images/entities/char_2009.gif) I + RuI I + RuI | (8) |
Taking the derivative of E with respect to I we obtain:
 | (9) |
Therefore, by plotting the slope (∼ΔE/ΔI) as a function of 1/I (where I is taken as the mean value of two consecutive current values), Ru can be obtained as the intercept (1/I = 0) and used for calculating Ecorrect. The value of Ru obtained graphically in Fig. 5 was used to correct the I–E curve recorded on IrO2 at pH 14.
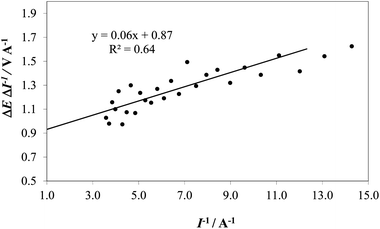 | ||
| Fig. 5 An example of extrapolation of the ΔE/ΔI vs. I−1 for the determination of R on the IrO2 electrode at pH 14 (1 M NaOH). | ||
Fig. 6 shows an example of correction of the potential for the IRu term for an IrO2 electrode at pH 14 (1 M NaOH), using the value of 0.87 Ω for the uncompensated resistance, Ru, found with the extrapolation shown in Fig. 5. We realize that this method is not free from drawbacks, the most important being that the ratio ΔE/ΔI has an increased uncertainty because of the derivative operation, which amplifies effects of the noise present in the raw data (e.g., due to stirring). The treatment also assumes no contribution from mass transfer effects, which is probably correct for pH 14. However, the method has the advantage of requiring no further data collection: the method uses the same values of I and V plotted in the Tafel diagrams. Moreover, in spite of unavoidable noise, the error in the determination of Ru is about ±0.1 Ω, which contributes an error of about 0.01 V to IRu for the highest current values recorded in typical experiments.
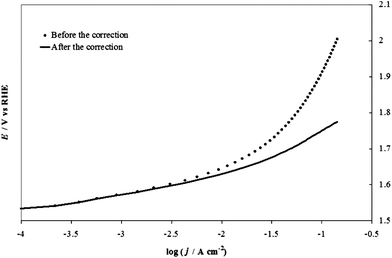 | ||
| Fig. 6 An example of correction of the potential for the IR term in the case of the IrO2 electrode at pH 14 (1 M NaOH), using the value (0.73 Ω for uncompensated resistance, Ru) found with the extrapolation shown in Fig. 5. | ||
By using this method, one can distinguish between ohmic resistance effects and the change of slope of the curve related to kinetic phenomena. In the case of the OER, these changes typically occur at E > 1.6–1.7 V. Many explanations for this phenomenon have been attempted: change in the reaction mechanism, change of the rate-determining step, saturation of the active sites by reaction intermediates or the onset of a catalyst dissolution process, which are beyond our focus here. The concomitant increase of the term ηbubble is probably also a significant effect: bubbles act as surface insulators, limiting the available active area and increasing the resistance, but can also increase the mass transfer in the solution layer close to the electrode surface. The observed increase of the curve slope at higher current densities is usually accompanied by the formation of bubbles on the electrode surface, suggesting the two phenomena are related.
3.4. Constructing dynamic potential–pH diagrams
DPPDs are generated from steady-state I–E curves recorded at different pH values. Fig. 7 represents I–E curves (not corrected for the ohmic drop and with c.d. expressed in terms of the geometric area) recorded for an IrO2 electrode (Fig. 7a) and the corresponding Tafel plots (E (V vs. RHE) vs. log (c.d.)) (Fig. 7b). The two corresponding 3D DPPDs are represented in Fig. 8. Values shown between the three experimental lines (in this case recorded at pH 0.1, 6.8 and 14) are the results of linear interpolation, although in a more detailed diagram. Curves taken at intermediate pH values (e.g., 4.3 and 11.3) would produce a more accurate representation.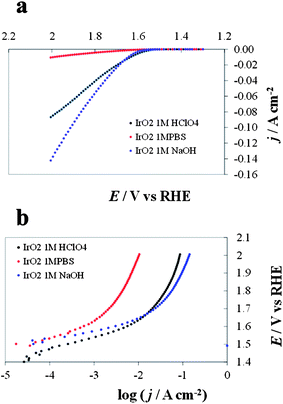 | ||
| Fig. 7 Current/potential diagrams (a) and Tafel plots (b) recorded for IrO2 at pH 6.8, 1 M phosphate buffer solution (PBS), red line, pH 0.1, 1 M HClO4, black line and pH 14.0, 1 M NaOH, blue line. | ||
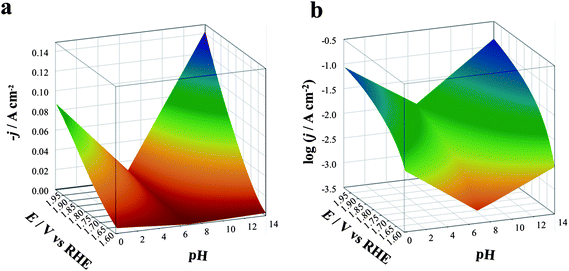 | ||
| Fig. 8 Three-dimensional dynamic potential–pH diagrams of IrO2: z axis is expressed in terms of current density (a) or of its logarithm (b). The plots are derived from the curves in Fig. 6, recorded on IrO2 at pH 6.8 (1 M PBS red line), 0.1 (1 M HClO4, black line) and 14.0 (1 M NaOH, blue line). | ||
The plots can be easily converted into two-dimensional (surface) plots, as shown in Fig. 1, by color coding the j or log![[thin space (1/6-em)]](https://www.rsc.org/images/entities/char_2009.gif) j data with the color scheme shown in Fig. 8. These follow the spectrum, with red–orange representing the lower currents (catalytic activities) and blue–violet, the higher ones. The information contained in the diagram is easy to read: iridium oxide activity is higher at basic and acidic pH, reaching the best performance at pH 14. The diagram immediately gives visual information to show the conditions where the material is more active (larger blue region extending to less positive potentials vs. RHE).
j data with the color scheme shown in Fig. 8. These follow the spectrum, with red–orange representing the lower currents (catalytic activities) and blue–violet, the higher ones. The information contained in the diagram is easy to read: iridium oxide activity is higher at basic and acidic pH, reaching the best performance at pH 14. The diagram immediately gives visual information to show the conditions where the material is more active (larger blue region extending to less positive potentials vs. RHE).
DPPDs also enable a direct comparison of different materials. Since plots of j tend to emphasize the lower current densities, DPPDs are made more informative by plotting log![[thin space (1/6-em)]](https://www.rsc.org/images/entities/char_2009.gif) j as shown in Fig. 9, which shows four DPPDs of the OER for the materials IrO2, Pt, Co3O4 and Co–Pi/Ni prepared by method A. The use of dynamic plots enables immediate evaluation of the relative activities of the catalysts, by the use of the same color for the same log
j as shown in Fig. 9, which shows four DPPDs of the OER for the materials IrO2, Pt, Co3O4 and Co–Pi/Ni prepared by method A. The use of dynamic plots enables immediate evaluation of the relative activities of the catalysts, by the use of the same color for the same log![[thin space (1/6-em)]](https://www.rsc.org/images/entities/char_2009.gif) j range. The constant log
j range. The constant log![[thin space (1/6-em)]](https://www.rsc.org/images/entities/char_2009.gif) j increments employed (each change of color corresponds to a change of log
j increments employed (each change of color corresponds to a change of log![[thin space (1/6-em)]](https://www.rsc.org/images/entities/char_2009.gif) j = 0.3) allows for a quick evaluation of the linearity of the Tafel lines. This represents an empirical method for the estimation of the quality of the electrocatalyst, e.g., in considering the industrial application of such materials. Additional information can be added to the plots, e.g., the α-values or slope of the Tafel lines.
j = 0.3) allows for a quick evaluation of the linearity of the Tafel lines. This represents an empirical method for the estimation of the quality of the electrocatalyst, e.g., in considering the industrial application of such materials. Additional information can be added to the plots, e.g., the α-values or slope of the Tafel lines.
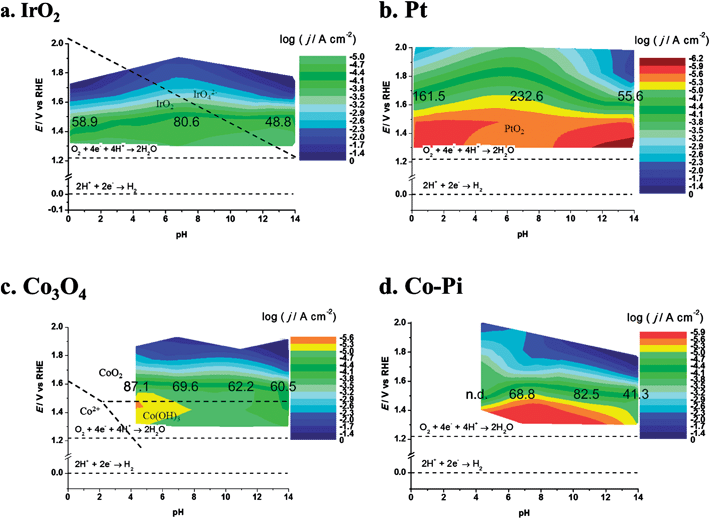 | ||
| Fig. 9 Dynamic potential–pH diagrams for (a) IrO2, (b) Pt, (c) Co3O4 and (d) Co–Pi. In this case the z axis represents the current density (based on geometric area). Dashed lines represent the equilibrium potentials for water oxidation and reduction reactions. The numbers on the colored area represents the slopes (in mV/decade) of Tafel lines recorded at the relevant pH. All dashed lines represent the borders of thermodynamic stability of different species, as derived from Pourbaix diagrams, considering the activity of dissolved species equal to 1. | ||
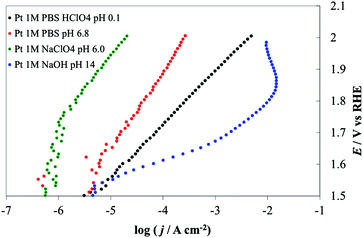
In the present case, a rapid look at the plots reported in Fig. 9 leads to the conclusion that the most active material is iridium oxide, over the whole pH range. Cobalt oxide is very active in alkaline solutions but the activity decreases toward neutral pH. Moreover, Co3O4 is thermodynamically unstable in acidic media, as shown by the insertion of a white zone and from species shown on the E–pH plane. Fig. 9b shows the result of a decrease in the active surface as a result of bubble formation. Pt in a pH 14 solution shows a current maximum at about 1.87 V. At higher potentials the electrode was almost fully covered by bubbles, thus causing a dramatic increase of the term ηbubble and a decrease of the active surface area.
Moreover, if the logarithm of c.d. is used, more general information about the material behavior can be extracted. For example, as discussed later, Co–Pi/Ni electrodes prepared by method A show current instability at pH 4.3, 6.8 and 11.3 in 1 M PBS (see the discussion described below). Experiments using acetate buffer were also performed on cobalt-based materials on Ni. In this case Co–Pi was found to show current instability during the recording of the I–E curve. The nature of the instability is still not clear, but could be due to the rapid buildup of protons at the surface or to the presence of a high concentration of phosphate ion, or the combination of all these factors. The formation of Ni oxide is not a factor, since degradation phenomena were also observed with FTO substrates.
Co3O4 is somewhat more stable, but long-term stability is uncertain. Corrosion of Co3O4 occurs in acidic solution. Dissolution involves the formation of CoO2, whose decomposition forms O2.25 The use of the logarithmic scale also enables a comparison of zones where the catalysts show lower activity, e.g., neutral pHs. In this case IrO2 represents the best electrocatalyst, followed by Co3O4 and Co–Pi.
3.5. Real (as opposed to geometric) electrocatalyst surface area
A given DPPD represents kinetic data with respect to the applied potential and the solution pH is valid under the given material preparation procedure, and using the given experimental approach. However, adopting the right tools (e.g., as described before, a common reference electrode) and applying common rules or guidelines for the normalization of the experimental data, a DPPD is a good way to compare materials prepared by different methods. This unavoidably leads to a search for the definition and determination of the real surface area, which has always been a central issue for comparing the activities of different materials. More specifically, the focus is on the correct way to define and measure the number of active sites participating in the electrochemical reaction. In the case of Pt a possible way is to count the sites on which atomic hydrogen is adsorbed and desorbed as shown by the underpotential deposition (UPD) waves. The integration of these peaks gives the amount of charge, QH, for a monolayer of adsorbed hydrogen, and the relative number of Pt atoms is generally adopted as one of the best indications of the active surface. Oxides offer a more complicated situation, since many of these show more complicated electrochemical behavior with a number of contributions to the charge, e.g., pseudocapacitive (faradaic processes) or solid-state redox transitions (surface reactions), potential-dependent conductivity, and double layer capacitance. In the experimental data, the latter measurement may depend on the conductivity. However, for the oxides considered in this work, this is not a problem, since all of them show quite high conductivity (κ = (1.7–3.3) × 104 Ω−1 cm−1 for IrO2,26 quasi-metallic conductivity, and 10−4 Ω−1 cm−1 for Co3O427).The importance of pseudocapacitive phenomena is related to the generally written OER mechanism involving intermediacy of a higher oxide:
| Higher valence oxide formation: MOx + yH2O → MOx+y + 2yH+ + 2ye− | (10) |
| Higher valence oxide decomposition: MOx+y → MOx + y/2O2 | (11) |
Although the mechanism described by eqn (10) and (11) has not been demonstrated, the presence of the electrode material in the mechanism of OER was demonstrated using an 18O-enriched aqueous electrolyte.28 In this way, for IrO2 obtained by thermal decomposition, the amount of electrode material participating in the reaction was said to be of the order of 1% of the total Ir-loading.
Pseudocapacitive phenomena occurring in the potential window between the OER and the HER, have been attributed to a solid-state redox reaction:
| MOx(OH)y + δH+(solution) + δe−(oxide) → MOx−δ(OH)y+δ | (12) |
In a recent study,32 solutions containing iridium oxide nanoparticles (NPs) (mean diameter 1.6 nm) were characterized by cyclic voltammetry and chronoamperometry, and the redox transitions associated with reaction (12) were quantitatively analyzed to demonstrate that they involved essentially all of the iridium sites present in the NPs. However, NPs prepared by hydrolysis of a suitable iridium precursor are more likely to be highly hydrated, thus suggesting that in this case the particles are highly defective and that each atom can be involved in reaction (12) (i.e. the active sites are accessible in the whole bulk of the particles). The importance of reaction (12) in the estimation of the real surface area is also related to the change of the oxidation state of the site on which OER occurs.33,34,35 For iridium oxide, an increase in the mean valence of iridium sites under OER conditions has been observed by XPS36 and X-ray absorption.37 The number of sites participating in reaction (12) has also been related to the Tafel slope value.38
The details of the procedure we used for the calculation of the number of active sites, ns, of oxide materials are reported in ESI†. After the number of active sites is known, the turnover frequency (TOF) can be calculated by:
 | (13) |
 | ||
| Fig. 10 Dynamic potential–pH diagrams for (a) IrO2, (b) Pt, (c) Co3O4. In this case the z axis represents the turnover frequency. Potentials were already corrected for ohmic drops. The data relevant to Co3O4 at pH 4.7 are not inserted because of the expected instability of this material in acidic conditions. All dashed lines represent the borders of thermodynamic stability of different species, as derived from Pourbaix diagrams, considering the activity of dissolved species equal to 1. | ||
Note that the use of the number of active sites as determined here in eqn (13) requires reactions where the effectiveness factor (Ef) is equal to 1. The Ef represents, according to the definition given by Calderon et al.,39 the “fraction of the electrode surface that participates effectively in the investigated reaction” Ef is close to 1 for the OER, meaning that the whole electrode thickness is involved in the reaction. For other reactions this may not be true (in the most extreme case, only the outer surface, i.e. the portion close to the electrolyte, is involved) and the number of active sites that effectively work are a fraction of ns.29,39
Note also that the zones of thermodynamic stability of different species of the materials, as derived from Pourbaix diagrams by considering the activity of dissolved species equal to 1, are also shown in Fig. 1, 9 and 10, which clearly show the relevance of the DPPDs to material stability.
3.6. Overview of the OER electrocatalysts in this study
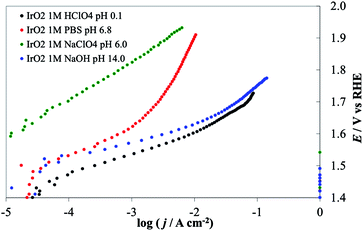 | ||
| Fig. 11 Steady-state current density vs. potential curves recorded on IrO2 deposited on Ti lamina by thermal decomposition of IrCl3 solution in ethanol. Green line, 1 M NaClO4 (pH 6.0), red line, 1 M PBS (pH 6.8), blue line 1 M NaOH (pH 14), black line 1 M HClO4 (pH 0.1). All curves are reported after correction for ohmic drops. | ||
Tafel slopes for the OER are generally higher at neutral pH (in this case 80.6 mV/decade in 1 M PBS) than at the extreme pH values (48.8 mV/decade in 1 M NaOH, 58.9 mV/decade in 1 M HClO4). At neutral pH the effect of the nature of the buffer solution is clearly visible; currents recorded in 1 M PBS are more than one order of magnitude higher at a given potential than those obtained in 1 M NaClO4 (with 116 mV/decade slope). However, at the most positive potential investigated, i.e. at 2.0 V vs. RHE, currents recorded in the two cases were similar. This behavior may be caused by the limited buffer capacity of the 1 M PBS, which can compensate for the decrease of the surface pH only to a certain reaction rate. At the highest current densities, when the flux of protons produced at the anode is high, the 1 M buffer cannot compensate and the pH gradient at the electrode surface becomes similar in the two solutions. The behavior of IrO2 under strongly alkaline conditions, where the stability is limited by the formation of highly oxidized species (iridates), has been studied.8,41,42 While this might represent a technological limit, the material activity towards the OER can be carried out under these conditions, if the polarization time is not too long. For example, we recorded the electrode CV before and after the I–E curve was recorded (see ESI†). A comparison of the two CVs did not show any sign of the electrode degradation, thus demonstrating that the value shown in IrO2 DPPD at alkaline pH was unchanged by the OER. In comparing the four materials considered (see Fig. 9 and 10), IrO2 represents the material showing the best combination of activity and stability.
The Pourbaix diagram for Co shows that Co3O4 is stable only over a very narrow range of potentials and pHs. However, thermal treatment or incorporation of other anions could produce (kinetic) stability under conditions outside the predicted thermodynamic range. As shown in Fig. 13, Co3O4 activity is highest at pH 14. At lower pHs the observed activity probably decreases because of the lower local pH values at the electrode surface during the reaction, because the 1 M PBS buffer (at pH 11.3 and 6.8) may not have sufficient capacity to maintain the pH at the electrode surface at high proton production rates, compared to 1 M NaOH. Moreover, this solution has a higher conductivity than the phosphates, producing relatively smaller IRu drops.50 The progressive increase of the Tafel slope values observed for decreasing pHs (see values reported in Fig. 9) may also derive from the instability of the deposit.
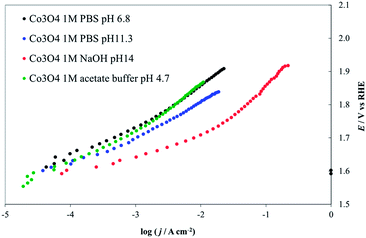 | ||
| Fig. 13 Steady-state current density vs. potential curves recorded on Co3O4 deposited on a Ni lamina by thermal decomposition of a Co(NO3)2 solution in ethanol. Green line, 1 M acetate buffer (pH 4.7), red line, 1 M PBS (pH 6.8), blue line 1 M NaOH (pH 14), black line 1 M HClO4 (pH 0.1). All curves are reported after correction for ohmic drops. | ||
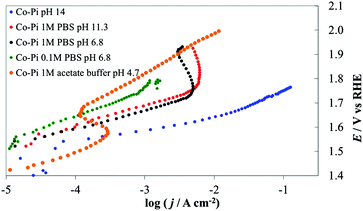 | ||
| Fig. 14 Steady-state current density vs. potential curves recorded on Co–Pi (4 C cm−2) deposited on Ni lamina by electrodeposition in the presence of phosphate anions. Orange line, 1 M acetate (pH 4.7), green line, 0.1 M PBS (pH 6.8), black line, 1 M PBS (pH 6.8), red line, 1 M PBS (pH 11.3), blue line 1 M NaOH (pH 14). All curves are reported after correction for ohmic drops. | ||
We also investigated and compared the I–E behavior of Co–Pi layers prepared based on method B on Ni and FTO support materials. As shown in the blue curve of Fig. 15, a bare FTO electrode shows very small activity for water oxidation in PBS, while a Co–Pi coating increases its activity. For a Co–Pi coating deposited at a low potential (i.e., at 0.85 V vs. Ag/AgCl), the I–E curves were stable and followed Tafel behavior in both 0.1 and 1 M PBS in the low potential (<1.6 V vs. RHE)–low c.d. (<1 mA cm−2) region, but deviate significantly from the ideal Tafel behavior at higher potentials. The c.d. increased slightly with increasing concentration of PBS (compare the green or red curve for 1 M PBS with the black curve for 0.1 M PBS of Fig. 15).
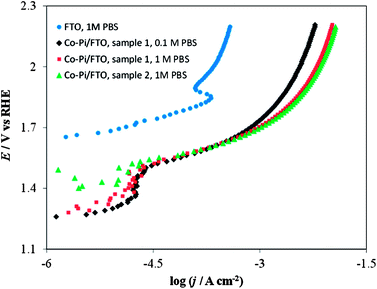 | ||
| Fig. 15 Current density vs. potential curves in a stirred PBS at a scan rate of 0.1 mV s−1. Blue circles on FTO only (no Co–Pi film) in 1 M PBS; Black diamonds on Co–Pi/FTO sample 1 in 0.1 M PBS; Red squares on Co–Pi/FTO same sample 1 in 1 M PBS; Green triangles on Co–Pi/FTO sample 2 in 1 M PBS. Electrodeposition conditions: Constant potential at 0.85 V vs. Ag/AgCl. Solution was quiet without dearation during deposition. Anodic charge collected = 0.35 C for overnight (16–17 h). | ||
Fig. 16 shows the effect of the deposition potential of Co–Pi/FTO electrodes on the shape of the I–E curve in 1 M PBS. No dramatic difference was observed in the I–E curves for Co–Pi coatings deposited at two different potentials (i.e., at 0.85 or 1.10 V vs. Ag/AgCl) in the low potential (<1.6 V vs. RHE)–low c.d. (<1 mA cm−2) region. However, in the high c.d. (>10 mA cm−2)–high potential (>1.9 V vs. RHE) region, Co–Pi/FTO electrodes prepared at 1.10 V by method B showed a greater current instability, as demonstrated by the current decrease observed at potentials above 1.9 V (vs. RHE) (see blue and red curves of Fig. 16) relative to that deposited at low potential (i.e., 0.85 V vs. Ag/AgCl) (see black curve of Fig. 16). As described above, we have also seen this type of I–E curve when Ni (instead of FTO) was used as the substrate (see Fig. 3 and 14) and the Co–Pi coating was electrodeposited at a potential positive of 1.1 V vs. Ag/AgCl based on method A. This suggests that the substrate (FTO or Ni) used in this study is not a key factor in the voltammetric behavior, but rather that film preparation conditions, such as the potential and rate for electrodeposition are important. We have also described other I–E characteristics in 0.1 or 1 M PBS (pH 6.8) in more detail in ESI†.
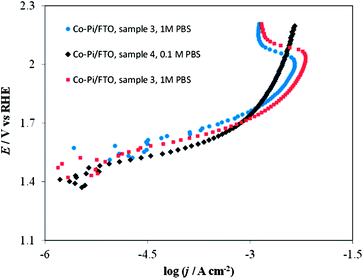 | ||
| Fig. 16 Current density vs. potential curves in stirred PBS at a scan rate of 0. 1 mV s−1. Blue circles on Co–Pi/FTO sample 3 in 1 M PBS; Black diamonds on Co–Pi/FTO sample 4 in 0.1 M PBS; Red squares on Co–Pi/FTO same sample 3 in 1 M PBS. Electrodeposition conditions: Constant potential at 1.1 V vs. Ag/AgCl. Solution was quiet without dearation during deposition. Anodic charge collected = 4.3 C for ∼1.5 h. | ||
It is still not clear which specific factors are important in the current instability of the deposited material but several are suggested for further investigation. We can exclude the effect of high current densities, since no degradation or current drops were observed at pH 14, where much higher currents were reached than at lower pHs. Most probably, the degradation is caused by the pH conditions and decrease of pH during the OER at high current densities. We believe that the same instability was not observed on the Co3O4 electrodes because of their higher mechanical strength and better adhesion to the support. Electrodeposited electrocatalysts are often poorly stable under anodic polarization, as seen, for example, with iridium oxide.52 Moreover, the evolution of oxygen bubbles can cause the mechanical removal of material from the support. Although bubbles are formed mainly at the cobalt oxide/electrolyte interface, if the Ni support comes in contact with the solution, bubbles also can form at the Ni/electrolyte interface as well. This effect is enhanced by the high activity shown by nickel toward the OER.8
In 1 M PBS, before the material starts to decompose, the Co–Pi activity is higher than that of Co3O4 prepared by thermal decomposition (Fig. 17). This might be the result of higher hydration of the layer typically observed in the case of electrodeposited materials with respect to layers obtained by thermal decomposition.30 This higher hydration does not lead to a per site increase in the material activity,52 but rather to an increase in the number of accessible sites. This effect of loading and hydration is a possible cause of the differences in the results here and in a previous study13,16 (see Fig. 17); significant differences in current densities can be generated by relatively small differences in electrocatalyst loading, substrate material, temperature and pressure.
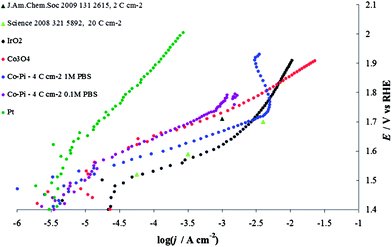 | ||
| Fig. 17 Steady-state current density vs. potential curves recorded in phosphate buffer solution (PBS) on Co–Pi layers (4 C cm−2) electrodeposited on Ni sheet in the presence of phosphate anions. Blue line, 1 M PBS (pH 6.8), violet line, 0.1 M PBS (pH 6.8). Both curves are compared with data reported in the literature: light green triangles are taken from Tafel line obtained on Co–Pi deposited after the passage of 20 C cm−2 (Fig. 4 from ref. 13), while the dark green triangle is extracted from Fig. 7 in ref. 16. Data recorded on Co3O4, red line, Pt, green line and IrO2, black line, are also shown. The charge densities shown in the legend represent the value of charge passed for the electrodeposition. All curves are reported after correction for ohmic drops. | ||
The results of the individual I–E curves are the same as that of the DPPDs (see Fig. 9), and indicate that, of the materials examined here, the IrO2 electrode is the best electrocatalyst under these conditions, followed by the Co-based materials.
Conclusions
We propose a new diagrammatic approach (dynamic potential–pH diagrams or DPPDs) for comparing the behavior of electrocatalysts and show results for those for the OER. DPPDs were obtained for four materials (IrO2, Co3O4, Co–Pi and Pt) by recording the steady-state c.d./potential characteristics at different pH values where the materials were stable. Stability can readily be found from the zero current plane (the conventional Pourbaix diagram), where the electrocatalyst material under consideration is the indicated predominant species. The c.d. is reported with respect to the geometric area, but normalization of the current for the real active surface area or number of active sites is also considered. All measurements were corrected for ohmic drops, adopting a method proposed by Trasatti.24All materials showed the highest activity at high pH, both because of the higher conductivity and also because pH gradients in the proximity of the surface caused by the OER were minimized. Kinetic effects may also contribute to the dependence of activity on the solution pH. Neutral conditions are the most complicated to address, particularly at high current densities, where these effects are more pronounced. The role of the buffer solution and its concentration on the currents recorded at neutral pH was considered in the paper. A comparison of measurements performed over a broad pH window makes necessary the use of a suitable reference electrode, such as one whose dependence on pH is the same as the half reaction for the reaction of interest; here we used the reversible (in the same medium) hydrogen electrode or RHE. Doing so, the equilibrium potential for a half reaction involving the same number of protons and electrons is constant with pH and the measured characteristics are more easily compared. However, it is also possible to use the diagram with potentials vs. NHE. The film preparation conditions, such as the potential and rate for electrodeposition, rather than the substrate, are shown to be important factors affecting the voltammetric behavior of Co–Pi layer. While it is not addressed here, it would be useful to define benchmark electrocatalysts to define the known best material and structure to allow comparison with proposed new electrocatalysts.
This new type of diagram enables the direct comparison of results obtained on different materials. Secondary effects, due to surface area effects on different samples, could be accounted for, if the real current densities (obtained after measuring the actual number of active sites) are plotted. The display of an intensive variable, like the turnover frequency, TOF, can definitively help to solve this problem, since this depends only on the properties of the materials and not on their extensive properties. The use of color codes in the DPPDs makes the comparison easier for those without extensive electrochemical experience. In this sense, we believe that DPPDs could be useful in the teaching of electrochemistry and electrochemical kinetics. While this paper emphasizes the use of DPPDs in electrocatalysis, they may also find application in other fields where kinetics plays a significant role, such as corrosion research and prediction of reactions for species whose diagrams are available.
Acknowledgements
We are grateful to Prof. Cinthia G. Zoski for helpful discussions. Financial support from the Ministry of Education, University and Research (PRIN 2008PF9TWZ and 2008N7CYL5) and Università degli Studi di Milano (PUR 2009 Funds, coordinator: Prof. S. Ardizzone) is gratefully acknowledged. A. M. is thankful to the Università degli Studi di Milano for a post-doc fellowship. We also thank the National Science Foundation (CHE-0808927) and the Robert A. Welch Foundation (F-0021) for the support of this research.References
- W. M. Latimer, Oxidation Potentials, Prentice-Hall, New York, NY, 1938 Search PubMed.
- A. A. Frost, J. Am. Chem. Soc., 1951, 73, 2680 CrossRef CAS.
- M. Pourbaix, Atlas of Electrochemical Equilibria in Aqueous Solutions, National Association of Corrosion Engineers, Houston, Texas, 2nd English edn, 1974 Search PubMed.
- Uhlig's Handbook of Corrosion, ed. R. W. Revie, Wiley, Hoboken, NJ, 2011, ch. 7, 8, 9 Search PubMed.
- F. Reymond, G. Steyaert, P.-A. Carrupt, B. Testa and H. Girault, J. Am. Chem. Soc., 1996, 118, 11951–11957 CrossRef CAS.
- A. J. Bard, J. Am. Chem. Soc., 2010, 132, 7559 CrossRef CAS.
- Standard conditions are defined here as T = 298.15 K and P = 101
![[thin space (1/6-em)]](https://www.rsc.org/images/entities/char_2009.gif) 325 Pa (1 atm): A. J. Bard, R. Parsons and J. Jordan, Standard Potentials in Aqueous Solution, Marcel Dekker, New York, 1985. The IUPAC recommendation for P is 100
325 Pa (1 atm): A. J. Bard, R. Parsons and J. Jordan, Standard Potentials in Aqueous Solution, Marcel Dekker, New York, 1985. The IUPAC recommendation for P is 100![[thin space (1/6-em)]](https://www.rsc.org/images/entities/char_2009.gif) 000 Pa (1 bar). The difference in potentials for the purpose of this work is negligible Search PubMed.
000 Pa (1 bar). The difference in potentials for the purpose of this work is negligible Search PubMed. - S. Trasatti and G. Lodi, in Electrodes of Conductive Metallic Oxides: Part B, ed. S. Trasatti, Elsevier, Amsterdam, 1981, Chapter 10 Search PubMed.
- L. Ma, S. Sui and Y. Zhai, Int. J. Hydrogen Energy, 2009, 34, 678 CrossRef CAS.
- S. Trasatti, J. Electroanal. Chem., 1995, 396, 161 CrossRef CAS.
- S. Ardizzone, C. L. Bianchi, G. Cappelletti, M. Ionita, A. Minguzzi, S. Rondinini and A. Vertova, J. Electroanal. Chem., 2006, 589, 160 CrossRef CAS.
- A. Minguzzi, M. A. Alpuche-Aviles, J. Rodríguez López, S. Rondinini and A. J. Bard, Anal. Chem., 2008, 80, 4055 CrossRef CAS.
- M. W. Kanan and D. G. Nocera, Science, 2008, 321, 5892.
- G. Spinolo, S. Ardizzone and S. Trasatti, J. Electroanal. Chem., 1997, 423, 49 CrossRef CAS.
- S. Ardizzone, C. L. Bianchi, L. Borgese, G. Cappelletti, C. Locatelli, A. Minguzzi, S. Rondinini, A. Vertova, P. C. Ricci, C. Cannas and A. Musinu, J. Appl. Elechochem., 2009, 39, 2039 Search PubMed.
- Y. Surendranath, M. Dinca and D. G. Nocera, J. Am. Chem. Soc., 2009, 131, 2615 CrossRef CAS.
- Y. Surendranath and D. G. Nocera, personal communication.
- R. F. Savinell, R. L. Zeller III and J. A. Adams, J. Electrochem. Soc., 1990, 137, 489 CrossRef CAS.
- A. J. Bard and L. R. Faulkner, Electrochemical Methods: Fundamentals and Applications, John Wiley and Sons, New York, 2nd edn, 2001, ch. 3 Search PubMed.
- S. Trasatti, Pure Appl. Chem., 1986, 58, 955 CrossRef CAS.
- S. Trasatti and G. Lodi, in Electrodes of Conductive Metallic Oxides: Part B, ed. S. Trasatti, Elsevier, Amsterdam, 1981, ch. 10 Search PubMed.
- M. G. Nooney, A. Campbell, T. S. Murrell, X.-F. Lin, L. R. Hossner, C. C. Chusuei and D. W. Goodman, Langmuir, 1998, 14, 2750 CrossRef CAS.
- D. van der Vliet, D. S. Strmcnik, C. Wang, V. R. Stamenkovic, N. M. Markovic and M. T. M. Koper, J. Electroanal. Chem., 2010, 647, 29 CrossRef CAS.
- N. Krstajic and S. Trasatti, J. Appl. Electrochem., 1998, 28, 1291 CrossRef CAS.
- L. M. Da Silva, J. F. C. Boodts and L. A. De Faria, Electrochim. Acta, 2001, 46, 1369 CrossRef CAS.
- S. Trasatti and G. Lodi, in Electrodes of Conductive Metallic Oxides: Part A, ed. S. Trasatti, Elsevier, Amsterdam, 1980, ch, 7 Search PubMed.
- M. R. Tarasevich and B. N. Efremov, in Electrodes of Conductive Metallic Oxides: Part A, ed. S. Trasatti,Elsevier, Amsterdam, 1980, ch. 5 Search PubMed.
- S. Fierro, T. Nagel, H. Baltruschat and C. Comninellis, Electrochem. Commun., 2007, 9, 1969 CrossRef CAS.
- C. Locatelli, A. Minguzzi, A. Vertova, P. Cava and S. Rondinini, Anal. Chem., 2011, 83, 2819 CrossRef CAS.
- S. Ardizzone, G. Fregonara and S. Trasatti, Electrochim. Acta, 1990, 35, 263 CrossRef CAS.
- A. Vertova, L. Borgese, G. Cappelletti, C. Locatelli, A. Minguzzi, C. Pezzoni and S. Rondinini, J. Appl. Electrochem., 2008, 38, 973 CrossRef CAS.
- T. Nakagawa, N. S. Bjorge and R. W. Murray, J. Am. Chem. Soc., 2009, 131, 15578 CrossRef CAS.
- S. Trasatti, Electrochim. Acta, 1984, 29, 1503 CrossRef CAS.
- G. Fóti, D. Gandini, C. Comninellis, A. Perret and W. Haenni, Electrochem. Solid-State Lett., 1999, 2, 228 CrossRef CAS.
- J. G. McAlpin, Y. Surendranath, M. Dincă, T. A. Stich, S. A. Stoian, W. H. Casey, D. G. Nocera and R. D. Britt, J. Am. Chem. Soc., 2010, 132, 6882 CrossRef CAS.
- R. Kötz, H. Neff and S. Stucki, J. Electrochem. Soc., 1984, 131, 72.
- M. Hüppauff and B. Lengeler, J. Electrochem. Soc., 1993, 140, 598 CrossRef.
- E. Guerrini and S. Trasatti, Russ. J. Electrochem., 2006, 42, 1017 CrossRef CAS.
- E. Herrera Calderon, A. Katsaounis, R. Wüthrich, P. Mandin, G. Foti and Ch. Comninellis, J. Appl. Electrochem., 2009, 39, 1827 CrossRef.
- A. Morozov, A. De Battisti, S. Ferro and G. N. Martelli, Int. Pat., WO 2005/014885 A1.
- E. Guerrini, H. Chen and S. Trasatti, J. Solid State Electrochem., 2006, 11, 939.
- M. Morimitsu, C. Murakami, K. Kawaguchi, R. Otogawa and M. Matsunaga, J. New Mater. Electrochem. Science, 2004, 7, 323 Search PubMed.
- H. Ye, H. S. Park and A. J. Bard, J. Phys. Chem. C, 2011, 115, 12464 CrossRef CAS.
- J. Rodríguez-López, M. A. Alpuche-Avilés and A. J. Bard, J. Am. Chem. Soc., 2008, 130, 16985 CrossRef CAS.
- J. Bao and D. D. Macdonald, J. Electroanal. Chem., 2007, 600, 205 CrossRef CAS.
- L. D. Burke, in Electrodes of Conductive Metallic Oxides: Part A, ed. S. Trasatti, Elsevier, Amsterdam, 1980, ch. 3 Search PubMed.
- R. N. Singh, D. Mishra, Anindita, A. S. K. Sinha and A. Singh, Electrochem. Commun., 2007, 9, 1369 CrossRef CAS.
- A. J. Esswein, M. J. McMurdo, P. N. Ross, A. T. Bell and T. D. Tilley, J. Phys. Chem. C, 2009, 113, 15068 CrossRef CAS.
- N. K. Singh, J. P. Singh and R. N. Singh, Int. J. Hydrogen Energy, 2002, 27, 895 CrossRef CAS.
- R. Parsons, Handbook of Electrochemical Constants, Butterworths Scientific, London, 1959 Search PubMed.
- D. A. Lutterman, Y. Surendranath and D. G. Nocera, J. Am. Chem. Soc., 2009, 131, 3838 CrossRef CAS.
- L. Ouattara, S. Fierro, O. Frey, M. Koudelka and C. Comninellis, J. Appl. Electrochem., 2009, 39, 1361 CrossRef CAS.
Footnote |
| † Electronic supplementary information (ESI) available. See DOI: 10.1039/c1sc00516b |
| This journal is © The Royal Society of Chemistry 2012 |

