A novel route to prepare LaNiO3 perovskite-type oxide nanofibers by electrospinning for glucose and hydrogen peroxide sensing†
Bijun Wang, Shuqing Gu, Yaping Ding*, Yuliang Chu, Zhen Zhang, Xi Ba, Qiaolin Zhang and Xinru Li
Department of Chemistry, Shanghai University, Shanghai, 200444, P. R. China. E-mail: wdingyp@sina.com; Fax: +86 21 66132797; Tel: +86 21 66134734
First published on 31st October 2012
Abstract
Perovskite-type oxide LaNiO3 nanofibers (LNFs) have been successfully synthesized by electrospinning and sequential calcinations. The electrospun LNFs modified carbon paste electrode was used to construct a nonenzymatic hydrogen peroxide (H2O2) sensor and glucose biosensor for the first time. The LNFs composition was verified by X-ray diffraction, and the morphologies were examined by scanning electron microscopy and transmission electron microscopy. Cyclic voltammetry and amperometry were used to evaluate the catalytic activity of the LNFs modified electrode towards H2O2 and glucose. By using LNFs as electrocatalysts, the modified electrode showed high electrocatalytic activity for the oxidation of H2O2 and glucose. Under the optimized conditions, the H2O2 sensor exhibited a low detection limit down to 33.9 nM with a wide linear range from 0.05 to 1000 μM. The nonenzymatic sensor also showed fast response, long-term stability as well as a low detection limit for glucose.
Introduction
Electrospinning is known as a simple and low-cost technique which uses a high-voltage power supply between the steel needle and the collector to prepare ultrafine fibers with diameters ranging from tens of nanometers to several micrometers.1 This technique is a stable way to produce continuous fibers, of which the length can range up to several centimeters. Upon subsequent calcination, the organic components decompose or carbonize, and the inorganic precursors oxidize. Whether to decompose or to carbonize depends on the conditions of calcination. Various materials can be used for electrospinning, as different polymers and inorganic precursors can be mixed in the sol–gel solutions according to specific requirements. Various nanostructures including nanofibers,2,3 nanoparticles,4 nanobelts,5 and nanotubes6,7 have been produced using this technique. Since the electrospun materials have high surface area, small grain size and very porous structures, electrospinning technology has been successfully applied in many fields, such as gas sensors,8 batteries,5 solar cells9 and supercapacitors.10Detection of glucose is crucial in many fields including clinical, food and pharmaceutical analyses, and it has been receiving attention for many years.11 Electrochemical glucose biosensors have been widely developed since first proposed by Clark and Lyons on an enzymatic electrode.12 Much research has focused on the immobilization of glucose oxidase (GOx) and other materials, such as metal nanoparticles,13 nanowires,14 graphene15 and carbon nanotubes16 on electrodes. Despite the high selectivity and sensitivity of enzymatic biosensors based on GOx, they inevitably suffer from chemical and thermal instabilities originating from the nature of enzymes.17–19 Detection of hydrogen peroxide has suffered from the same problem. Therefore, nonenzymatic biosensors for detecting glucose and H2O2 have aroused growing interest. Nanostructured materials are well known for their unique and excellent electrochemical performance due to their extremely reduced sizes, large surface-to-volume ratio, high level of crystallinity, and a Debye length λD comparable to its dimensions.20 Therefore, they are widely applied to construct nonenzymatic glucose sensors and H2O2 sensors. Typical nanostructures include nanofibers,5,21 nanotubes,22,23 nanoparticles24,25 and nanowires.26,27
Perovskite-type oxide, especially as nanomaterials, exhibits peculiar and fascinating physical and chemical characteristics, such as superconductivity, ferroelectricity, ferromagnetism, charge ordering and magnetism,28 so it is an excellent and novel material, which can be used in an electrochemical sensor to enhance catalytic performance and to construct highly sensitive sensors. Though there are a number of reports which focus on the preparation of perovskite-type materials by electrospinning,29,30 few of them use electrospun materials as electrochemical modifiers. LaNiO3 is a typical perovskite-type oxide with excellent electrocatalytic activity. Hwang et al.39 reported a gas sensor with high sensitivity and high selectivity based on LaNiO3 nanofiber mats produced by electrospinning. However, to the best of our knowledge, this is the first time that electrospun LaNiO3 nanofibers modified carbon paste electrode (LNFs/CPE) has been developed as a nonenzymatic H2O2 sensor and glucose sensor.
Herein, we synthesize nanofibers of nickel(II) acetate/lanthanum nitrate/polyvinyl pyrrolidone (La(NO3)3/Ni(Ac)2/PVP) by electrospinning and calcination to form LNFs. This new type of H2O2 sensor and glucose sensor is developed based on LNFs modified carbon paste electrode. Compared with other detectors, the as-synthesized sensor in this work showed excellent sensing characteristics, including a lower detection limit and higher sensitivity, to H2O2 as well as glucose.
Experimental
Chemicals and apparatus
PVP (Mw 1![[thin space (1/6-em)]](https://www.rsc.org/images/entities/char_2009.gif) 300
300![[thin space (1/6-em)]](https://www.rsc.org/images/entities/char_2009.gif) 000), Ni(Ac)2·4H2O and H2O2 (30%) were obtained from Aldrich. La(NO3)3·6H2O, N-dimethylformamide (DMF), glucose, sodium hydroxide (NaOH), graphite powder (spectral reagent) and paraffin oil were purchased from Sinopharm Chemical Reagent Co., Ltd. (SCRC, China). All chemicals were of analytical grade and used as received. All solutions were prepared with redistilled water before the experiments were undertaken.
000), Ni(Ac)2·4H2O and H2O2 (30%) were obtained from Aldrich. La(NO3)3·6H2O, N-dimethylformamide (DMF), glucose, sodium hydroxide (NaOH), graphite powder (spectral reagent) and paraffin oil were purchased from Sinopharm Chemical Reagent Co., Ltd. (SCRC, China). All chemicals were of analytical grade and used as received. All solutions were prepared with redistilled water before the experiments were undertaken.Electrochemical measurements were carried out on a CHI 842B electrochemical workstation (CHI, China). A conventional three-electrode cell was used to conduct electrochemical tests, consisting of a saturated calomel electrode (SCE) as the reference electrode, a Pt wire as the counter electrode and a CPE as the working electrode (3 mm in diameter).
A morphology study of the nanofibers on the CPE surface was carried out with a scanning electron microscopy (SEM, JSM-6700F, 15.0 kV) and a transmission electron microscopy (TEM, JEM-2100, 200.0 kV) with fast Fourier transformation and selected area electron diffraction. The synthesized sample of LaNiO3 nanofibers was characterized by X-ray diffraction. Powder X-ray diffraction (XRD) patterns were obtained by Rigaku DLMAX-2200 X-ray diffraction using Kα radiation (λ = 1.5418 Å, 40 kV, 40 mA; scanning rate: 0.08° s−1) from 10° to 80°.
Synthesis of LNFs
Preparation of LNFs contain two main steps: electrospinning La(NO3)3/Ni(Ac)2/PVP nanofibers and calcinating the electrospun nanofibers. 0.3111 g Ni(Ac)2·4H2O and 0.5413 g La(NO3)3·6H2O were added slowly into 0.5247 g PVP solution (10.0 wt%) with 5 mL DMF under vigorous magnetic stirring for 24 h until a viscous gel was obtained. Then, the as-prepared gel was loaded into a plastic syringe and connected to a high-voltage power supply for electrospinning. A high voltage of 15 kV was applied between the spinneret and the collector at a gap of 10 cm (Fig. 1). After electrospinning, the stabilization of La(NO3)3/Ni(Ac)2/PVP nanofibers was completed in a drying oven at 80 °C for 12 h. To obtain the LNFs, the as-prepared nanofibers were calcined in air at 700 °C with a heating rate of 2 °C min−1, and held for 2 h at the target temperature. Electrospun LNFs were prepared at the end of this process.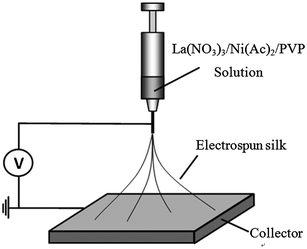 | ||
| Fig. 1 Schematic diagram of the electrospinning apparatus. | ||
Preparation of LNFs/CPE
The bare CPEs were prepared by hand-mixing the graphite powder and the paraffin oil in a ratio of 7![[thin space (1/6-em)]](https://www.rsc.org/images/entities/char_2009.gif) :
:![[thin space (1/6-em)]](https://www.rsc.org/images/entities/char_2009.gif) 3 (w/w) in a mortar and pestle until a uniformly wetted paste was obtained. The paste was packed firmly into a glass tube (3.0 mm in diameter). A copper wire was then inserted into the glass tube from the rear to establish electrical contact. The bare CPEs were finally obtained by smoothing the tubes on a weighing paper.
3 (w/w) in a mortar and pestle until a uniformly wetted paste was obtained. The paste was packed firmly into a glass tube (3.0 mm in diameter). A copper wire was then inserted into the glass tube from the rear to establish electrical contact. The bare CPEs were finally obtained by smoothing the tubes on a weighing paper.To make LNFs/CPE, 1 mg LNFs were dispersed in 1 mL double distilled water by ultrasonic agitation for 2 h to give a homogenous gray suspension. Then, 10 μL of the LNFs suspension (1 mg mL−1) was cast on the surface of the well-polished bare CPE and the modified electrode was allowed to dry under an infrared lamp.
Results and discussion
Structure and morphology characterization
The crystal structure of the final product of LaNiO3 samples was characterized by XRD, as shown in Fig. 2(A). All the detectable peaks can be easily indexed to the standard XRD pattern of LaNiO3 (JCPDS card no. 34-1028), and no other impurity peaks were observed, indicating high purity of the as-synthesized LaNiO3 nanofibers. The characteristic reflections of the sample are shown at 2θ 23.32°, 32.89°, 40.70°, 47.36°, 53.34°, 58.68°, 68.81°, 74.54° and 78.69° corresponding to the lattice planes (101), (110), (021), (202), (211), (122), (220), (303) and (312), respectively. This demonstrates that the powder of LNFs is rhombohedral in structure.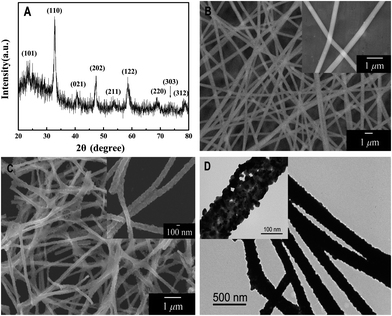 | ||
| Fig. 2 (A) XRD pattern of electrospun LaNiO3 nanofibers; (B) SEM images of electrospun La(NO3)3/Ni(Ac)2/PVP composite nanofibers; (C) SEM images of electrospun LaNiO3 nanofibers; and (D) TEM images of electrospun LaNiO3 nanofibers under low magnification (inset: under high magnification). | ||
Typical SEM images of La(NO3)3/Ni(Ac)2/PVP composite nanofibers and LNFs obtained after calcination at 700 °C are shown in Fig. 2(B) and (C), respectively. In Fig. 2(B), the precursor nanofibers have smooth surfaces and no obvious difference in overall morphologies of La(NO3)3/Ni(Ac)2/PVP composite nanofibers was found. Fig. 2(C) shows the as-prepared samples, the morphologies of which are maintained after the degradation of PVP and decomposition of La(NO3)3 and Ni(Ac)2, while the average diameter of nanofibers decreases from 400 nm to 140 nm (calculated from 50 randomly selected nanofibers under SEM imaging). It is clear that the LNFs are no longer smooth, which provides a larger accessible surface area for the subsequent electrochemical catalytic reaction of glucose and H2O2. After 2 h ultrasonic treatment, the nanofibers still maintain the fiber shape observed by SEM.
The shape and microstructure of the sample are further examined by transmission electron microscopy (TEM). As shown in the low magnification TEM image (Fig. 2(D)), the synthesized sample was composed of LaNiO3 nanoparticles. Under high magnification the TEM image (Fig. 2(D) inset), the irregular spherical LaNiO3 nanoparticles become obvious and make nanofibers with an average size of 20 nm.
Reaction mechanism for the oxidation of H2O2
Cyclic voltammogram (CV) experiments were carried out to research the mechanism of H2O2 oxidation between NiIII/NiII in alkaline solution. The electrochemical responses to H2O2 were studied at different electrodes in 0.1 M NaOH solution with and without H2O2. The results are shown in Fig. 3. Compared with the bare CPE (Fig. 3, curve a) with H2O2 and LNFs/CPE without H2O2 (Fig. 3, curve b), an increase of oxidation current on the LNFs/CPE with H2O2 (Fig. 3, curve c) is observed at around 0.68 V. This experimental result shows that LNFs exhibit excellent electrocatalytic activity to the oxidation of H2O2, which can be attributed to the perovskite-type oxides having many active sites. These active sites are transition metal ions with partially occupied d orbitals, thus perovskite-type oxides LaNiO3 can be considered as catalysts with transition metals in mixed oxidation states with the formula NiIII/NiII. As previously reported,31,32 the possible electrooxidation mechanism of H2O2 relies on cyclic electron-transfer processes. An electron is transferred from a reduced site on the surface of the catalyst to the H2O2 ion yielding an OH˙ radical, and another electron is transferred from the H2O2 ion to an oxidized site on the surface of the catalyst to produce an HO2˙ radical. Finally, the HO2˙ reacts with OH˙ to produce H2O and oxygen. The reactions are as follows:| H2O2 + NiII ↔ NiIII + OH˙ + OH− | (1) |
| OH− + H2O2 ↔ HO2− + H2O | (2) |
| HO2− + NiIII ↔ HO2˙ + NiII | (3) |
| HO2˙ + OH˙ → H2O + O2 | (4) |
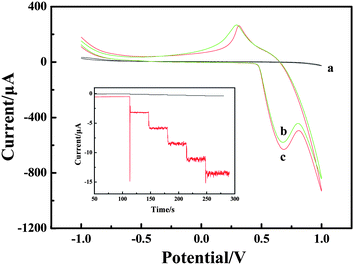 | ||
| Fig. 3 CVs recorded on the bare CPE (a) and LNFs/CPE without H2O2 (b) and with H2O2 (c) in 0.1 M NaOH. Scan rate: 100 mV s−1. Inset: amperometric response obtained on bare CPE and LNFs/CPE upon successive addition of 50 μM H2O2 into 0.1 M NaOH with applied potential at 0.6 V. | ||
Amperometric detection was performed to compare the current response between LNFs/CPE and bare CPE towards 50 μM H2O2. As shown in Fig. 3 inset, the average faradic current obtained on the modified CPE was 2.441 mA, which was 37.3 times larger than 0.0654 mA obtained on bare CPE, so that the sensor showed excellent electrocatalytic activity of LNFs/CPE.
To improve the performance of the H2O2 sensor, some important influence factors were optimized, including the applied potential (Fig. S1(A) in ESI†), the concentrations of NaOH (Fig. S1(B) in ESI†) and the concentrations of modifier (Fig. S1(C) in ESI†).
Amperometric response to H2O2 and the calibration curve
The obtained electrospun LNFs were used as a catalyst to promote the oxidation of H2O2. Fig. 4(A) shows the amperometric I–t curve of LNFs/CPE with successive additions of H2O2 to a continuously stirring NaOH solution under optimized experimental conditions. The sensor rapidly responds to the changes of H2O2 concentration and steady-state signals are obtained within 2 s. The regression equation of linear current response with H2O2 concentration is I (μA) = 0.27899 + 0.08025c (μM) with the correlation coefficient of 0.999. The detection limit is 33.9 nM at a signal-to-noise ratio of 3 and the expanded linear response ranges from 0.05 μM to 1000 μM. The sensitivity is calculated to be 1135.88 μA mM−1 cm−2.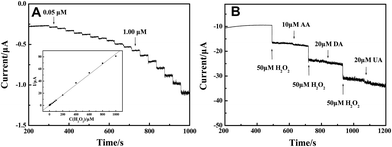 | ||
| Fig. 4 (A) Amperometric response obtained on the modified CPE upon successive addition of H2O2 of different concentration to 0.1 M NaOH with applied potential at 0.6 V. Inset: calibration curves of H2O2 sensor. (B) 50 μM H2O2 at different stages and on addition of 10 μM AA, 20 μM DA and 20 μM UA to 0.1 M NaOH with applied potential at 0.6 V. | ||
Reproducibility, stability and selectivity of the sensor are important factors and have been studied. The relative standard deviation (R.S.D.) of reproducibility was calculated to be 3.18% for 10 successive determinations of 50 μM H2O2 at one modified electrode. When the modified electrode was stored at room temperature for 4 weeks, the catalytic current response remained at 94.6% of its original value for H2O2 determination, reflecting the good stability of the modified electrode. The selectivity of the sensor was also evaluated against ascorbic acid (AA), dopamine (DA) and uric acid (UA), which are commonly present in the physiological samples. Fig. 4(B) shows amperometric response of the modified electrode for H2O2, AA, DA and UA in 0.1 M NaOH at an applied potential of 0.6 V. There is an obvious current response to the addition of 50 μM H2O2. However, the current response was little affected when adding 10 μM AA, 20 μM DA and 20 μM UA in the same sample, indicating that the LNFs/CPE shows very high selectivity towards the determination of H2O2.
Table 1 shows the comparison between the as-prepared sensor and some previously reported sensors which are modified with other types of Ni-compound for the determination of H2O2 as linear working range, detection limit and sensitivity. It can be clearly seen that the LNFs/CPE has a lower determination limit and higher sensitivity because the electrospun LNFs provide abundant active sites for sensing of H2O2. Therefore, this perovskite-type oxide is a good electrode material for oxidation of H2O2.
| Type of electrode | Linear working range (μM) | Detection limit (μM) | Sensitivity (μA mM−1 cm2) | Ref. |
|---|---|---|---|---|
| a Nickel hexacyanoferrate/chitosan/carbon nanotubes/nickel net.b Silicon nanowires.c Ni(II)/poly(m-toluidine)/modified carbon paste electrode.d Thionine/nano-nickel oxide/glassy carbon electrode.e Celestine blue.f Layered double hydroxides. | ||||
| NiHCF/CS/CNTs/NNa | 40–5600 | 0.28 | 654 | 34 |
| Ni(OH)2/SiNWsb electrode | 0–5500 | 3.2 | 3310 | 35 |
| Ni/PMT/MCPEc | 8–100 | 6.5 | — | 36 |
100–20![[thin space (1/6-em)]](https://www.rsc.org/images/entities/char_2009.gif) 000 000 | 22.4 | |||
| TH/nano-NiOx/GCEd | 1–10![[thin space (1/6-em)]](https://www.rsc.org/images/entities/char_2009.gif) 000 000 | 0.36 | 131.85 | 37 |
| CBe/nano-NiOx/GCE | 5–20![[thin space (1/6-em)]](https://www.rsc.org/images/entities/char_2009.gif) 000 000 | 1.67 | 242.68 | 37 |
| Ni/Al-LDHsf/GCE | 0.036–175 | 0.009 | 595.7 | 38 |
| LNFs/CPE | 0.05–1000 | 0.0339 | 1135.88 | This work |
Reaction mechanism for the oxidation of glucose
The electrochemical properties of LNFs/CPE in 0.1 M NaOH were shown in Fig. 5 curve b. When glucose was added to the NaOH, an increase in the oxidation peak is observed (Fig. 5 curve c) at about 0.6 V compared with the system without glucose. According to the literature,33 the electrooxidation mechanism of the oxidation of glucose to glucolactone is given by the following reactions, which have been used as the basis of the fabrication of a nonenzymatic sensor for electrochemical catalytic oxidation of glucose:| NiII ↔ NiIII + e− | (5) |
| NiIII + glucose → NiII + glucolactone | (6) |
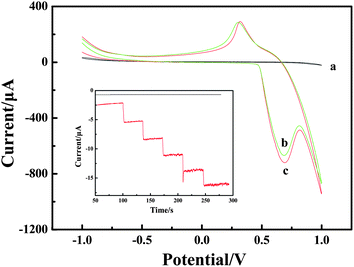 | ||
| Fig. 5 CVs recorded on the bare CPE (a) and LNFs/CPE without glucose (b) and with glucose (c) in 0.1 M NaOH. Scan rate: 100 mV s−1. Inset: amperometric response obtained on bare CPE and LNFs/CPE upon successive addition of 50 μM glucose into 0.1 M NaOH with applied potential at 0.6 V. | ||
The amperometric detection of 50 μM glucose was also performed on LNFs/CPE and bare CPE. As shown in Fig. 5 inset, the bare electrode has almost no current response towards glucose. However, the modified CPE displays obvious current change when adding glucose. Therefore, the electrospun LNFs are satisfactory modifiers to detect glucose.
Some important factors influencing the reaction were optimized to improve the performance of the glucose sensor, for example, the applied potential (Fig. S2(A) in ESI†), the concentrations of NaOH (Fig. S2(B) in ESI†) and the concentrations of modifier (Fig. S2(C) in ESI†).
Amperometric response to glucose and the calibration curve
Fig. 6(A) illustrates the amperometric I–t curve of LNFs/CPE with successive addition of glucose to a continuously stirred 0.1 M NaOH solution under optimized experimental conditions. The maximum steady-state current of the sensor was achieved within 4 s. The regression equation of linear current response with glucose concentration is I (μA) = 0.00981 + 0.00299c (μM) with the correlation coefficient of 0.998. The LNFs/CPE displays a linear response range from 1 μM to 1000 μM with the detection limit of 0.32 μM at the signal-to-noise ratio of 3. The sensitivity of the modified CPE is 42.321 μA mM−1 cm−2.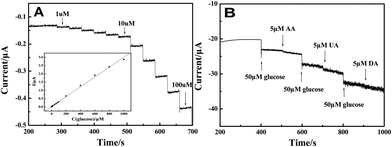 | ||
| Fig. 6 Amperometric response obtained on the LNFs/CPE upon successive addition of glucose at different concentrations to 0.1 M NaOH with applied potential at 0.6 V. Inset: calibration curves of the glucose sensor. (B) 50 μM glucose at different stages and on addition of 5 μM AA, 5 μM DA and 5 μM UA to the solution of 0.1 M NaOH with applied potential at 0.6 V. | ||
The reproducibility and stability of the glucose sensor was calculated by using the same method as the H2O2 sensor. The R.S.D. of reproducibility was 5.23%. The sensor kept 92.9% of its original value for glucose determination after 4 weeks. Fig. 6(B) shows the selectivity of the sensor in the determination of glucose by adding 5 μM AA, 5 μM DA and 5 μM UA, respectively. The result shows that these concentrations of AA, DA and UA have negligible interference on glucose.
Conclusion
In summary, a sensitive non-enzymatic sensor based on LNFs is demonstrated. The LNFs were synthesized by electrospinning and subsequent calcination, which provides a fast and easy method to prepare perovskite-type oxide nanofibers. The modified electrode provided high sensitivity and a low detection limit for sensing H2O2 and glucose under alkaline conditions due to the abundant active sites of the modifier. This non-enzymatic H2O2 sensor had a wide linear range from 0.05 to 1000 μM with a detection limit of 33.9 nM. The obtained sensor could be used to detect glucose with a detection limit of 0.32 μM and a linear detection ranging up to 1 mM. Moreover, the LNFs/CPE showed good selectivity in the presence of interfering species such as AA, UA and DA. The combination of proposed synthetic method and electrochemical sensing technology is expected to generate new opportunities for the development of reliable biosensor devices.Acknowledgements
This research is supported by the National Natural Science Foundation of China (no. 21271127, 20975066, 41140031, 61171033), the Nano-Foundation of Science and Techniques Commission of Shanghai Municipality (no. 12nm0504200), and the Leading Academic Discipline Project of Shanghai Municipal Education Commission (J50102).References
- J. S. Park, Adv. Nat. Sci.: Nanosci. Nanotechnol., 2010, 1, 1–5 Search PubMed.
- C. S. Zhou, Z. Liu, J. Y. Dai and D. Xiao, Analyst, 2010, 135, 1004–1009 RSC.
- J. Liu, J. F. Niu, L. F. Yin and F. Jiang, Analyst, 2011, 136, 4802–4808 RSC.
- B. J. Wang, L. Q. Luo, Y. P. Ding, D. S. Zhao and Q. L. Zhang, Colloids Surf., B, 2012, 97, 51–56 CrossRef CAS.
- L. M. Li, X. M. Yin, S. A. Liu, Y. G. Wang, L. B. Chen and T. H. Wang, Electrochem. Commun., 2010, 12, 1383–1386 CrossRef CAS.
- H. Q. Hou and H. R. Darrell, Adv. Mater., 2004, 16, 69–73 CrossRef CAS.
- Y. Liu, H. Teng, H. Q. Hou and T. Y. You, Biosens. Bioelectron., 2009, 24, 3329–3334 CrossRef CAS.
- S. I. Ji, C. K. Seok, S. H. Lee and Y. S. Lee, Carbon, 2010, 48, 2573–2581 CrossRef.
- Y. P. Lin, Y. Y. Chen, Y. C. Lee and Y. W. C. Yang, J. Phys. Chem. C, 2012, 116, 13003–13012 CAS.
- M. J. Zhi, M. Ayyakkannu and F. K. Meng, J. Power Sources, 2012, 208, 345–353 CrossRef CAS.
- N. J. Perera, L. Molyneaux, M. I. Constantino, M. McGill, D. K. S. Yue, S. M. Twigg and G. P. Ross, Diabetes Care, 2011, 34, 335–337 CrossRef.
- L. C. Clark and C. Lyons, Ann. N. Y. Acad. Sci., 1962, 102, 29–45 CrossRef CAS.
- X. Y. Qin, W. B. Lu, Y. L. Luo, G. H. Chang, A. M. Asiri, Y. Al, O. Abdulrahman and X. P. Sun, Analyst, 2012, 137, 939–943 RSC.
- K. Dawson, M. Baudequin and A. O. Riordan, Analyst, 2011, 136, 4507–4513 RSC.
- S. Liu, J. Q. Tian, L. Wang, Y. L. Luo, W. B. Lu and X. P. Sun, Biosens. Bioelectron., 2011, 26, 4491–4496 CrossRef CAS.
- Z. Y. Zeng, X. Z. Zhou, X. Huang, Z. J. Wang, Y. L. Yang, Q. C. Zhang, F. Boey and H. Zhang, Analyst, 2010, 135, 1726–1730 RSC.
- B. Laura, Colloids Surf., B, 2000, 17, 103–109 CrossRef.
- Y. Xiao, H. X. Ju and H. Y. Chen, Anal. Chim. Acta, 1999, 391, 73–82 CrossRef CAS.
- C. X. Lei, S. Q. Hu, G. L. Shen and R. Q. Yu, Talanta, 2003, 59, 981–988 CrossRef CAS.
- A. Kolmakov and M. Moskovits, Annu. Rev. Mater. Res., 2004, 34, 151–180 CrossRef CAS.
- B. Singh, E. Dempsey, C. Dickinson and F. Laffir, Analyst, 2012, 137, 1639–1648 RSC.
- F. Tasca, M. N. Zafar, W. Harreither, G. Noll, R. Ludwig and L. Gorton, Analyst, 2011, 136, 2033–2036 RSC.
- C. K. Tan, K. P. Loh and J. T. L. Thong, Analyst, 2008, 133, 448–451 RSC.
- J. Narang, N. Chauhan and C. S. Pundir, Analyst, 2011, 136, 4460–4466 RSC.
- T. S. Li, K. Zhu, S. He, X. Xia, S. Q. Liu, Z. Wang and X. Y. Jiang, Analyst, 2011, 136, 2893–2896 RSC.
- X. Cao and N. Wang, Analyst, 2011, 136, 4241–4246 RSC.
- Z. J. Zhuang, X. D. Su, H. Y. Yuan, Q. Sun, D. Xiao and M. M. F. Choi, Analyst, 2008, 133, 126–132 RSC.
- D. Kießling, R. Schneider, P. Kraak, M. Haftendorn and M. Wendt, Appl. Catal., B, 1998, 19, 143–151 CrossRef.
- Y. He, T. Zhang, W. Zheng, R. Wang, X. W. Liu, Y. Xia and X. W. Zhao, Sens. Actuators, B, 2010, 146, 98–102 CrossRef.
- X. F. Lu, D. L. Zhang, Q. D. Zhao, C. Wang, W. J. Zhang and Y. Wei, Macromol. Rapid Commun., 2006, 27, 76–80 CrossRef CAS.
- S. B. Kanungo, K. M. Paridaa and B. R. Sant, Electrochim. Acta, 1981, 26, 1157–1167 CrossRef CAS.
- D. X. Ye, Y. H. Xu, L. Q. Luo, Y. P. Ding, Y. L. Wang, X. J. Liu, L. J. Xing and J. W. Peng, Colloids Surf., B, 2012, 89, 10–14 CrossRef CAS.
- L. M. Lu, L. Zhang, F. L. Qu, H. X. Lu, X. B. Zhang, Z. S. Wu, S. Y. Huan, Q. A. Wang, G. L. Shen and R. Q. Yu, Biosens. Bioelectron., 2009, 25, 218–223 CrossRef CAS.
- Z. D. Wang, X. G. Hao, Z. L. Zhang, S. B. Liu, Z. H. Liang and G. Q. Guan, Sens. Actuators, B, 2012, 162, 353–360 CrossRef CAS.
- Q. Yan, Z. L. Wang, J. Zhang, H. Peng, X. J. Chen, H. N. Hou and C. R. Liu, Electrochim. Acta, 2012, 61, 148–153 CrossRef CAS.
- R. Ojani, J. B. Raoof and R. Babazadeh, Electroanalysis, 2010, 22, 1607–1616 CAS.
- A. Noorbakhsh and A. Salimi, Electrochim. Acta, 2009, 54, 6312–6321 CrossRef CAS.
- Z. J. Yin, J. J. Wu and Z. S. Yang, Biosens. Bioelectron., 2011, 26, 1970–1974 CrossRef CAS.
- D. K. Hwang, S. H. Kim, J. H. Lee, I. S. Hwang and I. D. Kim, J. Mater. Chem., 2011, 21, 1959–1965 RSC.
Footnote |
| † Electronic supplementary information (ESI) available. See DOI: 10.1039/c2an35989h |
| This journal is © The Royal Society of Chemistry 2013 |
