DOI:
10.1039/C2AN36382H
(Paper)
Analyst, 2013,
138, 353-361
Metabolomics study on the hepatoprotective effect of scoparone using ultra-performance liquid chromatography/electrospray ionization quadruple time-of-flight mass spectrometry†
Received
25th September 2012
, Accepted 23rd October 2012
First published on 23rd October 2012
Abstract
Scoparone is an important constituent of Yinchenhao (Artemisia annua L.), a famous medicinal plant, and displayed bright prospects in the prevention and therapy of liver injury. However, the precise molecular mechanism of hepatoprotective effects has not been comprehensively explored. Here, metabolomics techniques are the comprehensive assessment of endogenous metabolites in a biological system and may provide additional insight into the mechanisms. The present investigation was designed to assess the effects and possible mechanisms of scoparone against carbon tetrachloride-induced liver injury. Ultra-performance liquid chromatography/electrospray ionization quadruple time-of-flight mass spectrometry (UPLC/ESI-Q-TOF/MS) combined with pattern recognition approaches including principal component analysis (PCA) and partial least squares-discriminant analysis (PLS-DA) were integrated to discover differentiating metabolites. Results indicate five ions in the positive mode as differentiating metabolites. Functional pathway analysis revealed that the alterations in these metabolites were associated with primary bile acid biosynthesis, pyrimidine metabolism. Of note, scoparone has a potential pharmacological effect through regulating multiple perturbed pathways to the normal state. Our findings also showed that the robust metabolomics techniques are promising for getting biomarkers and clarifying mechanisms of disease, highlighting insights into drug discovery.
1. Introduction
Metabolomics is an emerging and powerful discipline concerned with the comprehensive analysis of small molecules (<1 kDa) and provides a powerful approach to discover biomarkers in biological systems.1 Various analytical techniques, with multivariate data analysis, such as principal components analysis (PCA) and partial least squares-discriminant analysis (PLS-DA) have been applied in metabolomic-based drug metabolism studies.2–5 Today, UPLC/ESI-Q-TOF/MS has become one of the widely applied techniques in metabolomics studies owing to its high sensitivity and reproducibility.6–9 As the newest of the “omics” sciences, metabolomics offers a global analysis of low-molecular-weight metabolites in biological samples, and attempts to elucidate sites of perturbations.10–12
Yinchenhao (Artemisia annua L.) is one of the most popular traditional Chinese medicinal plants for the treatment of jaundice and liver disorders and has been used for more than one thousand years (Chinese Pharmacopoeia Commission 2010). It was reported that scoparone was an important chemical substance with the activity to cure hepatic injury in Herba Artemisiae scopariae.13 As one of the main active constituents of Yinchenhao, scoparone (ESI Fig. 1†) has been proven to effectively treat liver diseases, and shows hepato-protectivity and contributes directly to the therapeutic effect.14 However, information about scoparone's metabolomics characteristics, which are very important for new drug discovery, has not been found in the published literature up to now. It is well known that the metabolomics study of a bioactive constituent can help us to understand its in vivo actions and explain a variety of events related to its efficacy.15 Therefore, the importance of understanding the metabolic profiles of scoparone is evident, and a corresponding metabolomics study is undoubtedly required.
Oriental herbal medicines, widely used for the treatment of liver diseases, have recently attracted the interest of the modern scientific community as alternative therapies. Carbon tetrachloride (CCl4) is a well-known model compound for producing chemical hepatic injury.16–18 To investigate the effect and mechanism of scoparone, acute liver injury in rats was induced by CCl4 which is a hepatotoxicant that produces acute liver injury in rodents. The aim of the current study was to obtain a systematic view of the mechanisms of scoparone as an effective treatment for liver injury. Thus, a robust Waters UPLC/ESI-Q-TOF/MS system and a Waters UPLC BEH C18 column with a 1.7 μm particle size were utilized and designed to elucidate the hepatoprotective effect of scoparone on CCl4-induced liver injury in rats.
2. Materials and methods
2.1. Chemicals and reagents
Acetonitrile (HPLC grade) was purchased from Dikma Technology Inc. (Dima Company, USA). Deionized water was purified by the Milli-Q system (Millipore, Bedford, MA, USA). Formic acid (HPLC grade, FA) was purchased from Honeywell Company (USA). Leucine enkephalin and CCl4 were purchased from Sigma-Aldrich (MO, USA). CCl4 was supplied from Chemicals Factory (Beijing, P. R. China). Olive oil (Oliver grade) was supplied by Kerry Oils & Grains Trade Co., Ltd (Shenzhen, China). Scoparone (purity 99%) was purchased from Sichuan Provincial Institute for Food and Drug Control (Sichuan, P. R. China).
Male Wistar rats (weighting 220–260 g) were supplied by GLP Center of Heilongjiang University of Chinese Medicine (Harbin, China). The room temperature was regulated at 25 ± 1 °C with 40 ± 5% humidity. A 12 h light/dark cycle was set, with free access to standard diet and water. The animals were allowed to acclimatize for 7 days prior to dosing and put in the metabolism cages during the urine collection periods specified below. After acclimatization, animals were randomly divided into 3 groups with 10 rats in each: the control; model; and scoparone groups. The rats in the control group were administrated with 0.9% saline in the whole procedure for 5 consecutive days. Rats were orally administrated with 20% CCl4 (1 ml kg−1 body weight) olive oil solution on the fourth day (6:00 p.m.) to induce liver injury model for 5 consecutive days, until day 8. Simultaneously, a scoparone group was administrated with CCl4 and 0.7 mg mL−1 drug treatment for 5 consecutive days. The rats were administrated with an orally accurate volume of 1 mL/100 g of each animal. Urine was collected daily (at 6:00 a.m.) from metabolism cages at ambient temperature throughout the whole procedure and centrifuged at 13![[thin space (1/6-em)]](https://www.rsc.org/images/entities/char_2009.gif) 000 rpm at 4 °C for 5 min, and the supernatants were stored frozen at −20 °C until metabolomic analysis. All animal care and experimental procedures were performed in compliance with the policies on the care and use of animals of the Ethical Committee of Heilongjiang University of Chinese Medicine. All efforts were made to ameliorate the suffering of the animals.
000 rpm at 4 °C for 5 min, and the supernatants were stored frozen at −20 °C until metabolomic analysis. All animal care and experimental procedures were performed in compliance with the policies on the care and use of animals of the Ethical Committee of Heilongjiang University of Chinese Medicine. All efforts were made to ameliorate the suffering of the animals.
2.3. Metabolic profiling
2.3.1. Chromatography.
UPLC/ESI-Q-TOF/MS was used for the global analysis of urine samples. Chromatographic analysis was performed in a Waters ACQUITY UHPLC system controlled with Masslynx (V4.1, Waters Corporation, Milford, USA). An aliquot of 6 μL of sample solution was injected onto an ACQUITY UHPLC HSS T3 C18 column (100 mm × 2.1 mm, 1.7 μm, Waters Corporation, Milford, USA) at 40 °C and the flow rate was 0.4 mL min−1. The optimal mobile phase consisted of a linear gradient system of (A) 0.1% formic acid in acetonitrile and (B) 0.1% formic acid in water, 0–2 min, 98% A; 2–3 min, 98–80% A; 3–7 min, 80–5% A; 7–9 min, 5% A; 9–11 min, 5–98% A; 11–13 min, 98% A. In addition, the QC sample was used to optimize the condition of UPLC-Q-TOF/MS, as it contained the most information of the urine samples. Whenever one sample injection was finished, a needle wash cycle was done to remove the remnants and prepare for the next sample. In addition, the eluent was transferred to the mass spectrometer directly, that is, without a split.
2.3.2. Mass spectrometry.
The mass spectrometry was operated by electrospray ionization in the positive ionization mode. The eluent was introduced into the high-definition mass spectrometer (Waters Corp., Milford, USA) analysis, and the optimal conditions of analysis were as follow: the source temperature was set at 110 °C, desolvation gas temperature was 300 °C, cone gas flow was 100 L h−1, desolvation gas flow was 600 L h−1; the capillary voltage was 3.2 kV, the sampling cone voltage was 35 V, microchannel plate voltage was 2300 V and extraction cone voltage was 3.0 V. The data acquisition rate was set to 0.14 s per scan, with a 0.1 s inter scan delay. Data were collected in centroid mode from 100 to 900 Da. For accurate mass acquisition, a lock-mass of leucine enkephalin at a concentration of 0.2 ng mL−1 was used via a lock spray interface at a flow rate of 100 μL min−1, monitoring in positive ion mode ([M + H]+ = 556.2771) to ensure accuracy during the MS analysis.
2.4. Multivariate data analysis and data processing
The UPLC-MS data were processed using the MarkerLynx Application Manager (Waters Corp.). After UPLC/ESI-QTOF/MS measurement, the raw data were imported into the MassLynx software for peak detection and alignment. The intensity of each ion was normalized with respect to the total ion count to generate a data matrix that consisted of the retention time, m/z value, and the normalized peak area. The multivariate data matrix was analyzed by EZinfo software 2.8 (Waters Corp., Milford, USA). All the variables were mean-centered and Pareto-scaled prior to PCA and PLS-DA. Here, “Unsupervised” PCA and “Supervised” PLS-DA were used to process the acquired UPLC-MS data. In the PCA scores, each point represents an individual sample. The PCA results are displayed as score plots indicating the scatter of the samples, which indicates similar metabolomic compositions when clustered together, and compositionally different metabolomes when dispersed. Further metabolite differences are indicated by the PCA loading plots. The purpose of the PLS-DA analysis was to calculate models that differentiate between groups or classes and between model and control subjects. In the PLS-DA modelling, the samples from the different groups were sorted into different classes using score plots, and endogenous metabolites that contribute to the classification were identified in loading plots, which showed the importance of each variable to the classification. Each score plot has a loading plot associated with it, which makes it possible to identify the spectral regions (metabolites) that are responsible for the observed sample clustering.
2.5. Biomarkers identification and reconstruction of metabolic pathway
Potential markers of interest were extracted from loading plots constructed following analysis with PLS-DA, and markers were chosen based on their contribution to the variation and correlation within the data set. The MassFragment™ application manager (Waters corp., Milford, USA) was used to facilitate the MS/MS fragment ion analysis process by way of chemically intelligent peak-matching algorithms. The identities of the specific metabolites were confirmed by comparison of their mass spectra and chromatographic retention times. A full spectral library, containing MS/MS data obtained in the positive ion modes, for all metabolites reported in this work is available on request from the authors. With regard to the identification of biomarkers, the ion spectrum of potential biomarkers was matched with the structure message of metabolites acquired from available biochemical databases, such as HMDB, http://www.hmdb.ca/; KEGG, http://www.genome.jp/kegg/; METLIN, http://metlin.scripps.edu/; Chemical Entities of Biological Interest (http://www.ebi.ac.uk/Databases/); MassBank, http://www.massbank.jp/; Scripps Center for Mass Spectrometry (http://masspec.scripps.edu/index.php) and Lipidmaps (http://www.lipidmaps.org/). The reconstruction, interaction and pathway analysis of potential biomarkers was performed with MetPA software based above database source to identify the metabolic pathways. The possible biological roles were evaluated by the enrichment analysis of MetaboAnalyst.
2.6. Statistical analyses
All statistical analyses were performed using the Student's t-test. Differences with a P-value of 0.05 or less were considered significant. Assays were performed in triplicate, and the results are expressed as mean ± SD.
3. Results
3.1. LC-MS analysis of metabolic profiling
Using the optimal reversed-phase UPLC-MS conditions described above, the representative BPI chromatograms of urine obtain from UPLC/ESI-Q-TOF/MS analysis for continuous eight days are shown in ESI Fig. 2.† All the data containing the retention time, peak intensity and exact mass were imported in the MasslynxTM software for multiple statistical analyses. Both PCA and PLS-DA often can be taken, because of their ability to cope with highly multivariate, noisy, colinear and possibly incomplete data. PCA is an unsupervised pattern recognition method initially used to discern the presence of inherent similarities in spectral profiles. Typically, the trajectory analysis of PCA score plots for the CCl4 treatment in positive mode can really reflect the differences between the model and control groups, and showed metabolic profiles in the control and model group were separated clearly (Fig. 1). Therefore, PCA can effectively demonstrate the differences between the treated and control groups. Fig. 1 demonstrates a clear separation between the treated and control groups. The PCA plot of the model group shows similar behaviours during the early stage of the experiment, but then they gradually deviate from one another, and on day 6 reach the maximum trend, then day 7 and day 8 gradually come back to the normal group, coinciding with the classic CCl4 induced liver injury. The tracks of the metabolic profiles at different time points also clearly demonstrate the time dependent changes in the urine metabolites. The corresponding PLS-DA loadings plot indicated that differentiating metabolites were attributable to the clustering observed in the scores plot. The farther away from the origin, the higher the VIP value of the ions was. Five ions that showed significant difference in abundance between the control and treated animals and contributed to the observed separation were selected from the loading plot of PLS-DA (Fig. 2). PCA score plot for the liver injury rats after scoparone treatment in the positive model showed no significant differences between samples (Fig. 3). Combining the results of the PLS-DA analysis with PCA plots, the UPLC-MS analysis platform provided the retention time, precise molecular mass and MS/MS data for the structural identification of biomarkers.
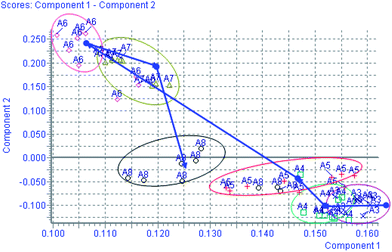 |
| | Fig. 1 Trajectory analysis of PCA score plots for the CCl4 treatment in positive mode. (×:the 1–3rd day; □: the 4th day; +: the 5th day; ◇: the 6th day; △: the 7th day; ○: the 8th day). | |
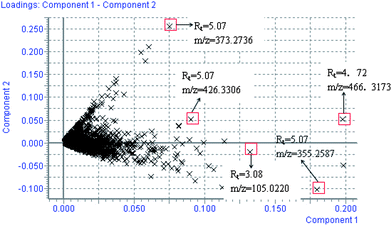 |
| | Fig. 2 Loading plot of the metabolome in rat urine from model group. The loading plot represents the impact of the metabolites on the clustering results. PLS-DA loading plots displayed variables positively correlated with score plots. Statistically and significantly different metabolites responsible for the discrimination of the two groups were identified between the control and model group. Red data points indicate that ions most responsible for the variance in the score plot. | |
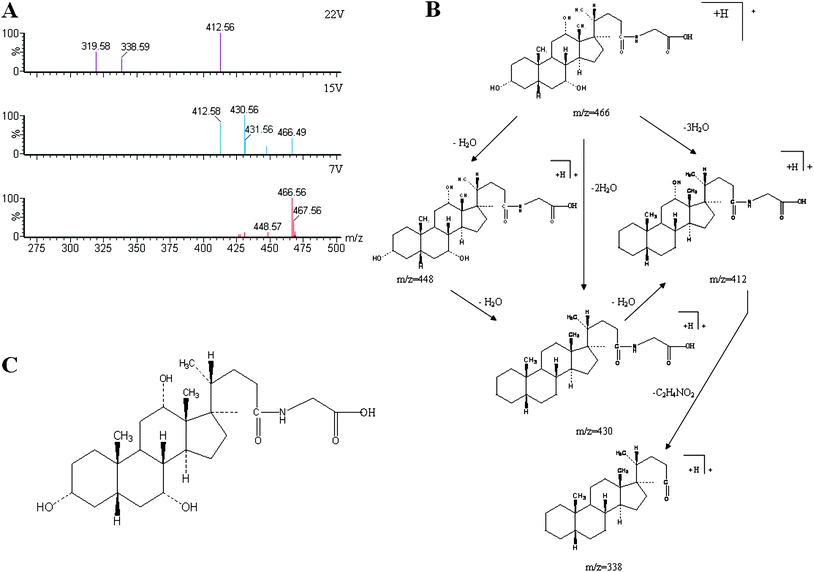 |
| | Fig. 3 Typical identification of potential biomarker glycocholate in urine using UPLC-ESI-QTOFMS-based metabolomics. (A) Mass spectrum of full scan and product ion scan of determined biomarkers. (B): possible fragmentation pathway; (C): chemical structure of glycocholate. | |
3.2. Identification of metabolite candidates
All collected samples were analyzed and low molecular weight metabolites were represented as the chromatographic peaks in the TIC chromatograms. The information including the retention time, the exact mass and the MS/MS data were supplied by the robust UPLC-MS platform. The precise molecular mass was determined within a reasonable degree of measurement error using Q-TOF, and the potential element composition, degree of unsaturation and fractional isotope abundance of the compounds were also obtained. The loading plot from the PCA based on UPLC/MS data (11846 variables) was shown in Fig. 2. The distance of an ion from the origin represents the contribution to the clustering of different groups on the PCA. We searched for the presumed molecular formula in ChemSpider, the Human Metabolome Database, KEGG, and Small Molecule Pathway Database to confirm possible chemical compositions, and the MS/MS data helped to identify the potential biomarkers. The collision induced dissociation experiment was implemented to get fragmentation patterns of these potential biomarkers. Furthermore, metabolite identification was conducted with high resolution MS and MS/MS fragments, as well as database analyses. This list of annotated ions facilitates the identification of compounds in metabolomic studies, specifically for the interpretation of the structures of fragment ions and adduct ions. For example, the postulated elemental compositions for the ions of glycocholate are given in Fig. 3. The metabolites, which gave an elemental composition of C26H43NO6, and molecular mass of [M + H]466.5638, were identified. The [M + H]466.5638 demonstrated an odd number of nitrogens, the product spectra such as m/z 448, 430, 412, and 338 contributed to [M − H2O + H]+, [M − 2H2O + H]+, [M − 3H2O + H]+, and [M − 3H2O − C2H4NO2 + H]+ when subjected to MS/MS analysis, and the retrieved corresponding literature. Finally, it was speculated as glycocholate after searching in the database. According to the protocol described above, glycocholate and 2-hydoxybutanoic acid were identified and summarized in Table 1.
Table 1 A list of potential urinary biomarkers of urine samples from rats treated with CCl4 in positive ion mode
| No. |
Retention time |
Measured mass |
Calculated [M + H]+ |
Elemental composition |
Identified metabolites |
Trend |
Related pathway |
| 1 |
4.72 |
466.3173 |
466.3169 |
C26H43NO6 |
Glycocholate |
↑ |
Primary bile acid biosynthesis |
| 2 |
5.07 |
354.240631 |
355.2597 |
C19H34N2O4 |
— |
↑ |
— |
| 3 |
3.08 |
105.0220 |
105.0188 |
C3H4O4 |
2-Hydoxybutanoic acid |
↓ |
Pyrimidine metabolism |
| 4 |
5.07 |
425.3505 |
426.3372 |
C28H43NO2 |
— |
↑ |
— |
| 5 |
5.07 |
372.150757 |
373.2743 |
C24H36O3 |
— |
↑ |
— |
3.3. Changes of relative intensity of biomarkers
According to the protocol detailed above, 5 endogenous metabolites contributing to the separation of the model group and control group were detected in the urine samples. The ions identified by UPLC-MS are summarized in Table 1 with their corresponding retention time, m/z, ion mode, and related trends. Fig. 4 showed a score plot of PCA for the acute livery injury after scoparone treatment in positive mode. The relative mean height intensities of different metabolites were graphed in Fig. 5. Monitoring changes of these metabolites may predict the development of liver injury. Additionally, the relative concentration of 5 endogenous metabolites was significantly affected by scoparone treatment. Interestingly, compared with the alterations of liver injury-related metabolites, most of them were reset to a normal state after scoparone administration.
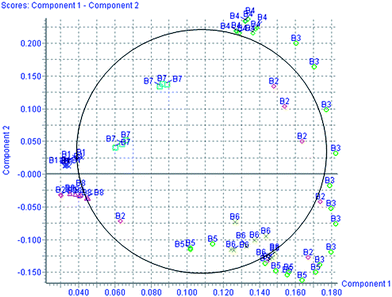 |
| | Fig. 4 PCA score plot for the acute livery injury after scoparone treatment in positive mode. | |
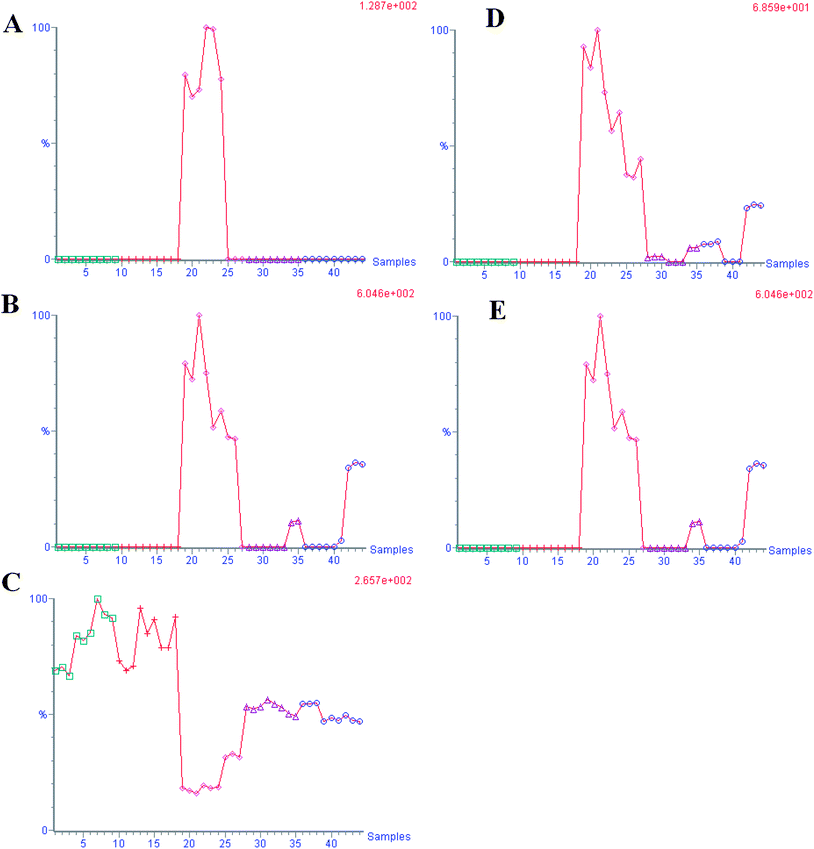 |
| | Fig. 5 The trend plot of intensity for potential urine biomarker in the urine samples. A: glycocholate; B: C19H34N2O4; C: 2-hydoxybutanoic acid; D: C28H43NO2; E: C24H36O3. (1–9 control group, 10–27 model group, 28–44 DME group). | |
3.4. Biomarker network and metabolic pathway reconstruction
With pattern recognition analysis of metabolites, a clear separation of the model and control groups was achieved, and the scoparone group was located with the control group. Metabolite profiling focuses on the analysis of a group of metabolites related to a specific metabolic pathway in biological states. To determine whether our observations of changes in the metabolites in the setting of liver injury in fact reflected coordinate changes in defined metabolic pathways, we used MetPA software to identify a network pathway. This software was based on the high-quality KEGG metabolic pathways as the backend knowledgebase to help researchers identify the most relevant pathways involved in the conditions under study. Metabolic pathway analysis with MetPA revealed that potential biomarkers were identified from glycolysis or gluconeogenesis, biosynthesis of unsaturated fatty acids, fatty acid biosynthesis and purine metabolism that changed specifically in the setting of liver injury. Of two distinct metabolites identified from these pathways, many were in various progress stages of liver injury. The detailed construction of the metabolism pathways with higher score was shown in Fig. 6. Results suggested that these target pathways showed the marked perturbations over the time-course of liver injury and could contribute to the development of liver injury.
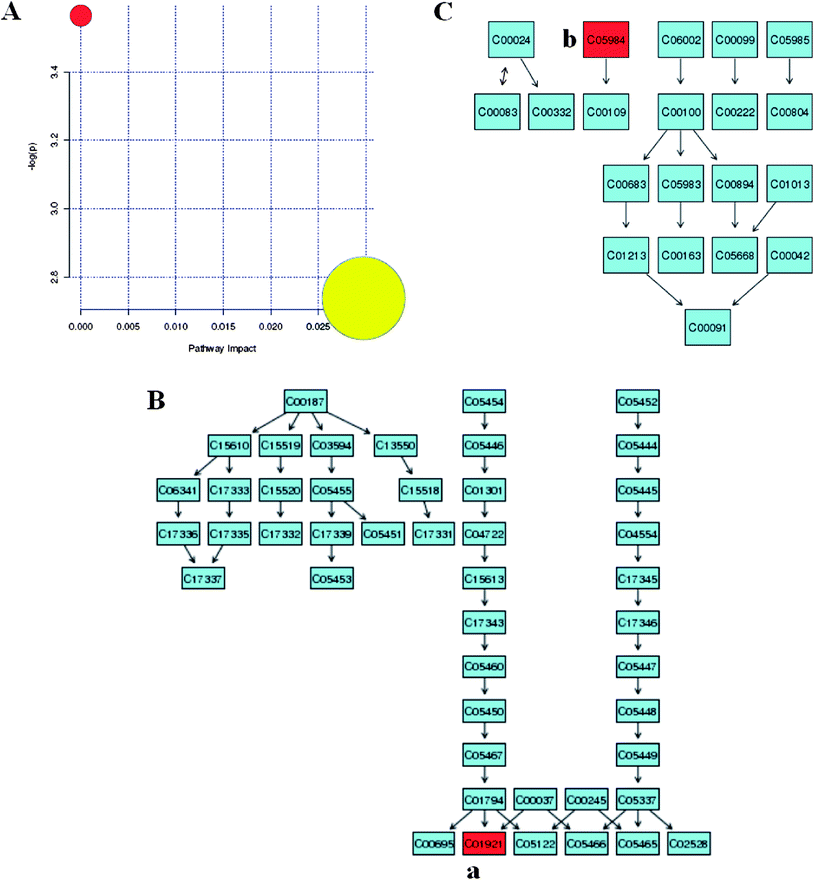 |
| | Fig. 6 Biomarker network reconstruction disturbed in response to CCl4 treatment. Identifying the network pathway by MetPA software (A). Putative metabolic pathways of primary bile acid biosynthesis (B), propanoate metabolism (C), were inferred in the CCl4-dosed rats from changes in the urine levels of intermediates during substance metabolism. Red denotes affected metabolites related to the pathway. The map was generated using the reference map by KEGG. (a), Glycocholate; (b), 2-hydoxybutanoic acid. | |
4. Discussion
Metabolomics is a branch of “omics” research primarily concerned with the high-throughput identification and quantification of small molecule metabolites in the metabolome.19,20 It has recently demonstrated significant potential in many fields such as toxicology, nutrition, disease diagnosis, drug mechanism and development, new targets and natural product discovery.21 Efficient separation techniques, coupled with high-resolution MS, are appropriate to deal with high numbers of samples that need to be handled simultaneously and in short times, and that have to be combined to produce extended subsets of metabolites profiles, both for quantification and identification. With hundreds of metabolites that are more closely related to the phenotype of an whole organism, metabolomics can help us in understanding the detailed analysis of complex reaction networks and uncovering new drug targets. Here, we applied the metabolomics approach based on the UPLC/Q-TOF/MS system to investigate scoparone for its hepatoprotective effect in CCl4-induced experimental liver damage.
The liver has the important function of metabolizing and eliminating biological and xenobiotic compounds. Liver injury is considered to be a serious health problem leading to acute hepatitis, cholestasis, and cirrhosis. For several decades, CCl4, a hepatotoxin, has been used extensively to result in liver injury in various animal models. In the present study, we investigated the metabolic changes of the molecular mechanism by which coparone conferred a hepatoprotective effect, using rats with CCl4-induced acute liver injury. Of note, a novel metabolomic approach confirmed that scoparone exhibited therapeutic efficacies for liver injury. Therefore, scoparone may be useful as a hepatoprotective agent against chemical-induced liver damage in vivo. We have also built a metabolomic feature network of scoparone in protecting against liver injury. Results showed that scoparone had protective effects on liver injury by reversing 5 potential metabolites to control levels. Interestingly, scoparone exhibited a hepatoprotective role in liver injury and kept animals in the normal situation, because there were no distinct clustering differences between the control and scoparone groups. In order to more clearly characterize the treatment effects of scoparone, the intensity level of 5 markers in the different groups was analyzed (Fig. 5) and scoparone may regulate the metabolism of these markers for efficiently use for liver injury disorder. Network reconstruction has led to the integration of metabolites associated with the caused perturbation pathways including primary bile acid biosynthesis, and pyrimidine metabolism. Levels of 2-hydoxybutanoic acid, glycocholate in liver injury rats after scoparone treatment were significantly downregulated. These metabolites demonstrated that an abnormal metabolism occurred in the model animals and metabolic analysis of liver injury was inferred from changes in the intermediates during substance metabolism. The levels of 5 metabolites exhibited marked changes compared with those of control rats. Glycocholate is an acyl glycine and a bile acid–glycine conjugate. It is a secondary bile acid produced by the action of enzymes existing in the microbial flora of the colonic environment. In hepatocytes, both primary and secondary bile acids undergo amino acid conjugation at the C-24 carboxylic acid on the side chain, and almost all bile acids in the bile duct therefore exist in a glycine conjugated form. More specifically, glycocholate or cholylglycine, is a crystalline bile acid involved in the emulsification of fats. It occurs as a sodium salt in the bile of mammals. As the glycine conjugate of cholic acid, this compound acts as a detergent to solubilize fats for absorption and is itself absorbed. Urinary excretion of these metabolites was also shown to have high specificity and sensitivity as markers. It indicated that these metabolites may be the biomarkers which were related to the action mechanism of scoparone. These markers and pathway components may prove useful as a noninvasive means of diagnosing liver injury diseases and to suggest novel therapeutic approaches.
In our study, the continuous, dynamic, and noninvasive detection of metabolites in the urine of rats treated with CCl4 was successfully demonstrated in real time. The application of metabolomic technologies for the study of liver injury will increase our understanding of the pathophysiological processes involved and this should help us to identify potential biomarkers to develop new therapeutic strategies. Metabolic network provides a unified platform to integrate all the biological information on genes, proteins, metabolites, drugs and drug targets for a comprehensive system level study of the relationship between metabolism and disease.22–25 System analysis of metabolic networks will help us in generating a more in-depth understanding of the mechanism of diseases and thus provide better guidance for drug discovery. In this article, our data showed that scoparone works by adjusting multiple metabolic pathways to the normal state. Additionally, we suggest that the application of metabolite profiling tools can provide an efficient means for the early diagnosis of liver injury and provide a practical method for monitoring therapeutic intervention.
5. Conclusion
Metabolomics is an emerging medium to high-throughput technology that can automatically identify, quantify and characterize hundreds to thousands of low molecular weight biochemicals simultaneously, using targeted or global analytical approaches, yielding a metabolic fingerprint and understanding of biochemical pathway perturbations. Herein, we illustrate how metabolomics can be utilized to explore the mechanisms of action of xenobiotics which affect different ‘key pathways’ contributing to the mode(s) of action. This paper was designed to study the metabonomic characters of the hepatotoxicity induced by CCl4 and the intervention effects of scoparone. It is the first demonstration of metabolomic approach to delineate metabolic changes in liver injury after dosed scoparone treatment. In this study, a model of liver injury in rats was constructed, and dynamic metabolic profiles were investigated with UPLC-MS combined with multivariate statistical analysis, 5 potential biomarkers of significant contribution were characterized in positive mode. Scoparone could have a hepatoprotective effect and keep animals in the normal situation via multiple pathways including primary bile acid biosynthesis, pyrimidine metabolic pathways. Thus, using a metabolomic approach, this study also exemplifies that metabolomics could provide a very promising way to elucidate therapeutic mechanisms of scoparone.
Competing financial interests
The authors declare no competing financial interests.
Acknowledgements
This work was supported by grants from the Key Program of Natural Science Foundation of State (Grant no. 90709019), the National Specific Program on the Subject of Public Welfare (Grant no. 200807014), National Key Subject of Drug Innovation (Grant no. 2009ZX09502-005).
References
- X. Wang, A. Zhang, Y. Han, P. Wang, H. Sun, G. Song, T. Dong, Y. Yuan, X. Yuan, M. Zhang, N. Xie, H. Zhang, H. Dong and W. Dong, Urine metabolomics analysis for biomarker discovery and detection of jaundice syndrome in patients with liver disease, Mol. Cell. Proteomics, 2012, 11(8), 370–380 Search PubMed.
- A. Zhang, H. Sun, Y. Han, Y. Yuan, P. Wang, G. Song, X. Yuan, M. Zhang, N. Xie and X. Wang, Exploratory urinary metabolic biomarkers and pathways using UPLC-Q-TOF-HDMS coupled with pattern recognition approach, Analyst, 2012, 137(18), 4200–4208 RSC.
- X. Wang, H. Wang, A. Zhang, X. Lu, H. Sun, H. Dong and P. Wang, Metabolomics study on the toxicity of aconite root and its processed products using ultraperformance liquid-chromatography/electrospray-ionization synapt high-definition mass spectrometry coupled with pattern recognition approach and ingenuity pathways analysis, J. Proteome Res., 2012, 11(2), 1284–1301 CrossRef CAS.
- H. Sun, B. Ni, A. Zhang, M. Wang, H. Dong and X. Wang, Metabolomics study on Fuzi and its processed products using ultra-performance liquid-chromatography/electrospray-ionization synapt high-definition mass spectrometry coupled with pattern recognition analysis, Analyst, 2012, 137(1), 170–185 RSC.
- L. Lin, Q. Yu, X. Yan, W. Hang, J. Zheng, J. Xing and B. Huang, Direct infusion mass spectrometry or liquid chromatography mass spectrometry for human metabonomics? A serum metabonomic study of kidney cancer, Analyst, 2010, 135(11), 2970–2978 RSC.
- X. Wang, B. Yang, H. Sun and A. Zhang, Pattern recognition approaches and computational systems tools for ultra performance liquid chromatography-mass spectrometry-based comprehensive metabolomic profiling and pathways analysis of biological data sets, Anal. Chem., 2012, 84(1), 428–439 CrossRef CAS.
- B. Yang, A. Zhang, H. Sun, W. Dong, G. Yan, T. Li and X. Wang, Metabolomic study of insomnia and intervention effects of suanzaoren decoction using ultra-performance liquid-chromatography/electrospray-ionization synapt high-definition mass spectrometry, J. Pharm. Biomed. Anal., 2012, 58, 113–124 CrossRef CAS.
- A. Zhang, H. Sun, P. Wang, Y. Han and X. Wang, Modern analytical techniques in metabolomics analysis, Analyst, 2012, 137(2), 293–300 RSC.
- H. Dong, A. Zhang, H. Sun, H. Wang, X. Lu, M. Wang, B. Ni and X. Wang, Ingenuity pathways analysis of urine metabolomics phenotypes toxicity of chuanwu in wistar rats by UPLC-Q-TOF-HDMS coupled with pattern recognition methods, Mol. BioSyst., 2012, 8(4), 1206–1221 RSC.
- A. Derenne, M. Verdonck and E. Goormaghtigh, The effect of anticancer drugs on seven cell lines monitored by FTIR spectroscopy, Analyst, 2012, 137(14), 3255–3264 RSC.
- X. Wang, H. Sun, A. Zhang, W. Sun, P. Wang and Z. Wang, Potential role of metabolomics apporoaches in the area of traditional Chinese medicine: as pillars of the bridge between Chinese and Western medicine, J. Pharm. Biomed. Anal., 2011, 55(5), 859–868 CrossRef CAS.
- A. Zhang, H. Sun, Z. Wang, W. Sun, P. Wang and X. Wang, Metabolomics: towards understanding traditional Chinese medicine, Planta Med., 2010, 76(17), 2026–2035 CrossRef CAS.
- X. Wang, H. Sun, A. Zhang, G. Jiao, W. Sun and Y. Yuan, Pharmacokinetics screening for multi-components absorbed in the rat plasma after oral administration traditional Chinese medicine formula Yin-Chen-Hao-Tang by ultra performance liquid chromatography-electrospray ionization/quadrupole-time-of-flight mass spectrometry combined with pattern recognition methods, Analyst, 2011, 136(23), 5068–5076 RSC.
- A. Zhang, H. Sun, Y. Yuan, W. Sun, G. Jiao and X. Wang, An in vivo analysis of the therapeutic and synergistic properties of Chinese medicinal formula Yin-Chen-Hao-Tang based on its active constituents, Fitoterapia, 2011, 82(8), 1160–1168 CrossRef CAS.
- Y. Chen, S. P. Ip, K. M. Ko, T. C. Poon, E. W. Ng, P. B. Lai, Q. Q. Mao, Y. F. Xian and C. T. Che, A proteomic approach in investigating the hepatoprotective mechanism of Schisandrin B: role of raf kinase inhibitor protein, J. Proteome Res., 2011, 10(1), 299–304 CrossRef CAS.
- T. Shimada, T. Nakanishi, A. Toyama, S. Yamauchi, A. Kanzaki, H. Fujiwake, T. A. Sato and M. Ikegawa, Potential implications for monitoring serum bile acid profiles in circulation with serum proteome for carbon tetrachloride-induced liver injury/regeneration model in mice, J. Proteome Res., 2010, 9(9), 4490–4500 CrossRef CAS.
- C. Henkel, M. Roderfeld, R. Weiskirchen, M. L. Berres, S. Hillebrandt, F. Lammert, H. E. Meyer, K. Stühler, J. Graf and E. Roeb, Changes of the hepatic proteome in murine models for toxically induced fibrogenesis and sclerosing cholangitis, Proteomics, 2006, 6(24), 6538–6548 CrossRef CAS.
- M. Atmaca, H. M. Bilgin, B. D. Obay, H. Diken, M. Kelle and E. Kale, The hepatoprotective effect of coumarin and coumarin derivates on carbon tetrachloride-induced hepatic injury by antioxidative activities in rats, J. Physiol. Biochem., 2011, 67(4), 569–576 CrossRef CAS.
- X. Wang, H. Sun, A. Zhang, P. Wang and Y. Han, Ultra-performance liquid chromatography coupled to mass spectrometry as a sensitive and powerful technology for metabolomic studies, J. Sep. Sci., 2011, 34(24), 3451–3459 CrossRef CAS.
- X. Wang, A. Zhang and H. Sun, Future perspectives of Chinese medical formulae: chinmedomics as an effector, OMICS, 2012, 16(7–8), 414–421 CrossRef CAS.
- A. Zhang, H. Sun, P. Wang, Y. Han and X. Wang, Metabonomics for discovering biomarkers of hepatotoxicity and nephrotoxicity, Pharmazie, 2012, 67(2), 99–105 CAS.
- P. N. Brown, C. E. Turi, P. R. Shipley and S. J. Murch, Comparisons of large (Vaccinium macrocarpon Ait.) and small (Vaccinium oxycoccos L., Vaccinium vitis-idaea L.) cranberry in British Columbia by phytochemical determination, antioxidant potential, and metabolomic profiling with chemometric analysis, Planta Med., 2012, 78(6), 630–640 CrossRef CAS.
- A. Zhang, H. Sun and X. Wang, Serum metabolomics as a novel diagnostic approach for disease: a systematic review, Anal. Bioanal. Chem., 2012, 404(4), 1239–1245 CrossRef CAS.
- K. L. Christensen, M. S. Hedemann, H. Jørgensen, J. Stagsted and K. E. Knudsen, Liquid chromatography-mass spectrometry based metabolomics study of cloned versus normal pigs fed either restricted or Ad libitum high-energy diets, J. Proteome Res., 2012, 11(7), 3573–3580 CrossRef CAS.
- J. Wei, G. Xie, S. Ge, Y. Qiu, W. Liu, A. Lu, T. Chen, H. Li, Z. Zhou and W. Jia, Metabolic transformation of DMBA-induced carcinogenesis and inhibitory effect of salvianolic acid b and breviscapine treatment, J. Proteome Res., 2012, 11(2), 1302–1316 CrossRef CAS.
Footnote |
| † Electronic supplementary information (ESI) available. See DOI: 10.1039/c2an36382h |
|
| This journal is © The Royal Society of Chemistry 2013 |
Click here to see how this site uses Cookies. View our privacy policy here. ![[thin space (1/6-em)]](https://www.rsc.org/images/entities/char_2009.gif) 000 rpm at 4 °C for 5 min, and the supernatants were stored frozen at −20 °C until metabolomic analysis. All animal care and experimental procedures were performed in compliance with the policies on the care and use of animals of the Ethical Committee of Heilongjiang University of Chinese Medicine. All efforts were made to ameliorate the suffering of the animals.
000 rpm at 4 °C for 5 min, and the supernatants were stored frozen at −20 °C until metabolomic analysis. All animal care and experimental procedures were performed in compliance with the policies on the care and use of animals of the Ethical Committee of Heilongjiang University of Chinese Medicine. All efforts were made to ameliorate the suffering of the animals.


