DOI:
10.1039/C2AN36055A
(Paper)
Analyst, 2013,
138, 278-283
Zr(H2O)2EDTA modulated luminescent carbon dots as fluorescent probes for fluoride detection
Received 18th June 2012, Accepted 16th October 2012
First published on 19th October 2012
Abstract
A novel fluorescent probe (Zr(CDs–COO)2EDTA) has been designed for fluoride ion (F−) content detection based on the competitive ligand reactions carried out between the carboxylate groups (–COOH) on the surface of the luminescent carbon dots (CDs) and F− coordinated to Zr(H2O)2EDTA. The strong and stable fluorescence signal of this probe was quenched upon the addition of F− as a result of the formation of the non-fluorescent complex Zr(F)2EDTA, due to the stronger affinity of F− than the –COOH in the CDs to Zr(IV). The fluorescence change (ΔF) in this process was linear with respect to the content of F−, ranging from 0.10 μM to 10 μM. The probe has been applied to F− detection in toothpaste and water samples with satisfactory results. Moreover, the mechanism of this Zr(H2O)2EDTA modulated fluorescent probe for the detection of F− was also discussed.
1. Introduction
Fluoride plays an important role in human health, medical and industrial processes. An appropriate amount of fluoride is essential to dental care and clinical treatment for osteoporosis.1,2 However, excess fluoride is not only toxic to aquatic organisms and plants,3 but also causes serious health problems to human beings, such as acute gastric and kidney disorders, dental and skeletal fluorosis4 and DNA damage.5 The maximum permissible limit of F− in drinking water is set at 1.5 mg l−1 by the World Health Organization, while this value is 1.0 mg l−1 in China.6 In view of these facts, the continuous monitoring of the presence and movement of F− is of great importance and research value to treat clinical diseases and protect the environment.Up to now, a variety of available methods for F− detection have been reported, such as ion chromatography (IC),619F NMR,7 fluoride selective electrodes,8 fluorescence capillary electrophoresis,9 colorimetry based on La(III), Ce(III) and Zr(IV) complexes with dye compounds,10–16 fluoride sensors based on fluorescence resonance energy transfer17 and so forth. Unfortunately, the low sensitivity of fluorescence capillary electrophoresis and colorimetry, the poor reproducibility of IC and fluoride selective electrodes, the high cost of 19F NMR, the inevitable use of organic solvents as the detection medium, the instability of colorimetry15 and the environmental pollution caused by the used organic dyes and semiconductor quantum dots seriously limits their application and development. Therefore, undertaking the challenge to further develop a simple, sensitive, cost-effective and unpolluted method for F− detection is worthwhile. Compared with conventional quantum dots and organic dyes, CDs exhibit the several promising advantages of a tunable emission wavelength, a high stability against photobleaching and blinking.18 In recent years, the research on the synthetic methods and the analytical applications of CDs has aroused much attention from scientists.19,20 Previous reports have demonstrated that although the Zr(H2O)2EDTA complex is fairly stable without the hydrolysis of the Zr(IV) ion over a wide pH range, two water molecules can be substituted by other suitable ligands to make ternary complexes, such as F−, –COOH and carbonyl groups.10,21 On account of the stronger affinity of F− than –COOH to coordinate to Zr(IV), a fluorescent probe has been designed for F− detection. This sensitive, selective, simple and non-polluted probe is suitable for fast F− detection in real samples, which not only provides a new technology for protecting human health and the environment, but also expands the application of CDs and fluorescent probes, and promotes the development of fluorometry.
2. Experimental
2.1 Reagents and apparatus
A microwave oven (Galanz) and an AE240 electronic analytical balance (Mettler–Toledo Instruments Shanghai Company) were used. The fluorescence spectra were recorded using a Varian Cary Eclipse fluorescence spectrophotometer with a 1.0 cm quartz cell (Ex slit 10 nm, Em slit 20 nm). The acidity of all the systems were measured by the pHS-3B precision acidometer (Mettler–Toledo Instruments Shanghai Company) with a glass electrode. Transmission electron microscope (TEM) observations were performed on a JEM-1230 electron microscope (JEOL, Ltd., Japan) at 300 kV.Preparation of the F− working solution: NaF was dried at 140 °C for 48 h before use and a 1.0 × 10⁻² M F− stock solution was prepared with water. Then the solution was diluted to 1.0 × 10⁻⁴ M and 1.0 × 10⁻⁶ M before use. Glucose, acetic acid (HAc, >99.5%) and sodium acetate (NaAc, >99%) were purchased from the Sinopharm Group Chemical Reagent Limited Corporation. Poly(ethylene glycol)-200 (PEG-200), ZrOCl2·8H2O (>99%), ethylenediamine tetraacetate (EDTA, >99%) and NaF were obtained from the Guangdong Shantou Xilong chemical plant. All reagents were of analytical grade. Doubly distilled water (18.2 MΩ) was used throughout.
2.2 Experimental method
2.2.1 Synthesis of CDs. According to ref. 22, 2.000 g glucose and 10.00 ml PEG-200 were mixed and dissolved into 3.00 ml water to form a clear solution. The mixture was put into a 540 W microwave oven for 2 min, and the yellow CDs solution was obtained. Finally, the CDs were dialyzed overnight using dialysis membranes of 1000 cutoffs, diluted to 100.00 ml with water and stored at 4 °C for use. 2.2.2 Preparation of Zr(H2O)2EDTA. According to the reported procedure in ref. 23, 0.010 mol ZrOCl2·8H2O was added into 100.00 ml of hot water containing 0.010 mol EDTA with vigorous stirring and the solution kept below the boiling point. After the complete formation of white crystalline precipitates, the water dried up and Zr(H2O)2EDTA was obtained. 1.0 × 10⁻² M Zr(H2O)2EDTA stock solution was prepared with water and stored at 4 °C for future use. 2.2.3 Construction of the Zr(CDs–COO)2EDTA on–off fluorescent probe and the detection procedure. 0.50 ml CDs solution, 1.00 ml HAc–NaAc buffer solution (pH 4.0) and 1.00 ml of 1.0 × 10⁻³ M Zr(H2O)2EDTA working solution were added to a 10 ml colorimetric tube, and the mixture was vortexed thoroughly and incubated at 70 °C for 15 min. Then the mixture was cooled with an ice bath for 5 min. Subsequently, the appropriate amount of F− solution was added, the solution was diluted to the total volume of 10.00 ml, vortex-mixed and placed at 70 °C for 10 min. The solution was cooled with an ice bath for 5 min before the measurements. Meanwhile, a reagent blank test was conducted. Finally, the fluorescence intensity of the test solution (F1) and the blank solution (F0) were recorded, and ΔF (= F1 − F0) was calculated.
2.2.4 Analysis of F− in toothpaste and tap water. 1.000 g toothpaste was accurately weighed and dissolved in 30.0 ml water and stirred at 70 °C for 3 h in a polypropylene vessel. The resulting solution was cooled to room temperature and then filtered with a membrane filter (pore size 0.45 μm) to eliminate solids in suspension. The insoluble part was washed several times with water, and the resulting solution was diluted to 200 ml with water for use.1.00 ml of 1.0 × 10⁻² M EDTA was added to 10.00 ml tap water to eliminate the interference from metal ions, and then the solution was diluted to 200 ml with water for use. Finally, the F− content of the test solution was separately detected by the developed probe and IC. Meanwhile, the reliability of the analytical results were assessed by the F-test and the t-test.
The toothpaste composition was analysed by the Zhangzhou Municipal Quality Supervision Bureau and the water sample was tested by the Zhangzhou Municipal Environmental Protection Agency, and the results are presented in Tables 1 and 2, respectively.
Table 1 Composition of the toothpaste samples
| Material | Silicon dioxide | Carboxyl methyl cellulose | Xanthan gum | Sorbitolum | Polyethylene glycol | Sodium dodecyl sulfate | Flavour |
|---|
| Content (%) | 20 | 0.5 | 0.60 | 62.5 | 3.5 | 1.8 | 0.80 |
| Material | Flavour | Saccharin sodium | Sodium benzoate | Pigment | Additive | Deionized water | |
| Content (%) | 0.80 | 0.15 | 0.25 | 0.10 | 0.10 | 9.5 | |
Table 2 Natural components of the water sample (mg l−1)
| Sample | pH | Chloride | Oxide | Nitrate | Total dissolved solids | Total hardness (calculated by CaCO3) | Volatile phenols (calculated by phenol) | Anionic detergents | Chemical oxygen consumption |
|---|
| Tap water 1 | 7.25 | 86.8 | 0.42 | 4.6 | 147 | 195 | <0.001 | 0.0044 | 0.32 |
| Tap water 2 | 7.30 | 86.2 | 0.45 | 4.3 | 143 | 193 | <0.001 | 0.0040 | 0.36 |
3. Results and discussion
3.1 Fluorescence characteristics of the CDs–Zr(IV)–EDTA–F− system
As shown in Fig. 1, the CDs emit strong and stable fluorescence signals (Curve a, λmaxem = 444.0 nm, F = 460.3) and stay invariable in a HAc–NaAc buffer solution of pH = 4.0 (Curve b, λmaxem = 446.0 nm, F = 463.7). However, when 1.00 ml of 1.0 × 10⁻³ M Zr(H2O)2EDTA was added, the F of the system was sharply enhanced with the λmaxem red-shifting by 11.9 nm (Curve c, λmaxem = 457.9 nm, F = 572.1). The observed phenomena were attributed to the formation of the Zr(CDs–COO)2EDTA fluorescent probe, due to the Zr(IV) ion in Zr(H2O)2EDTA coordinating to the –COOH on the surface of the CDs. What is more, compared with the –COOH on the surface of the CDs, the EDTA on the outermost layer of the Zr(CDs–COO)2EDTA possessed more negative charges at a pH of 4.0, which was more favorable for the dissociation of the luminescent molecules in the solution. Upon the addition of 10 μM F− in Zr(CDs–COO)2EDTA solution, the F of the system was quenched (Curve e, λmaxem = 448.0 nm, F = 519.9) with the λmaxem blue-shifting by 9.9 nm. These changes can apparently be attributed to the formation of the non-fluorescent complex Zr(F)2EDTA and CDs–COO−, due to the replacement of the –COOH coordinating to Zr(H2O)2EDTA by F−. Moreover, the ΔF of the system was linearly correlated with the content of F−. These observations enabled us to construct a fluorescent probe for F− detection.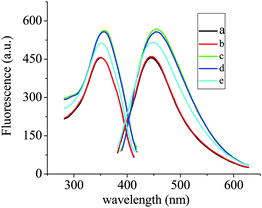 |
| | Fig. 1 Fluorescence spectra for the CDs–Zr(IV)–EDTA–F− system under the optimal conditions. The components related to each of the curves are as follows: a: 0.50 ml CDs; b: a + 1.00 ml HAc–NaAc; c: b + 1.00 ml Zr(H2O)2EDTA; d: c + 0.10 μM F−; e: c + 10.0 μM F−. The F of the emission spectra of a, b, c, d and e were 460.3, 463.7, 572.1, 562.4 and 519.9, respectively, and the corresponding RSD% (n = 6) were 2.3, 2.1, 1.2, 1.5 and 1.8. | |
3.2 Optimization of the experimental conditions
3.2.1 Effect of the pH. It should be noted that the proposed fluorescent probe is pH-dependent due to the –COOH on the surface of the CDs. Thus, the variation in F of the system against the pH both in the absence and in the presence of 0.50 μM F− were investigated. As shown in Fig. 2, a pH spanning from 2.0 to 8.0 was suitable for the ligand exchange between –COOH and F−, and the largest ΔF could be obtained when the pH was 4.0, where the exchange reaction most effectively took place. This was because a small amount of F− could be hydrolyzed to HF at a low pH, while the Zr(H2O)2EDTA, a hard acid, can still partly complex with the hard base OH− to form insoluble Zr(OH)4 at a high pH, which was against the ligand exchange reaction between the –COO− in Zr(CDs–COO)2EDTA and F−. As a result, the HAc–NaAc buffer of pH = 4.0 was chosen for the future study.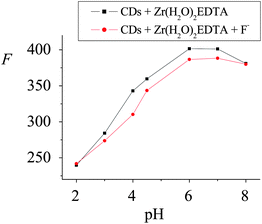 |
| | Fig. 2 Effect of pH on the on–off fluorescent probe for F− detection. The ΔF of the system at pHs ranging from 2.00 to 8.00 were 2.2, 10.5, 32.8, 16.1, 15.0, 12.9 and 0.10, respectively, and the corresponding RSD% (n = 6) were 3.5, 4.2, 2.3, 3.5, 3.7, 4.0 and 4.9. | |
3.2.2 Effect of the reaction temperature and time. The effects of the reaction temperature and time on the ΔF of the system were investigated according to the experimental method. As shown in Fig. 3 and 4, the ΔF of the system was dependent on both the reaction temperature and time. Results show that upon the addition of 0.50 μM F−, the ΔF increased with the increase of the reaction temperature and reached the maximum at 70 °C, while ΔF decreased at temperatures over 70 °C, which might be associated with the stability of Zr(F)2EDTA at high temperatures. On the other hand, at a fixed reaction temperature of 70 °C, the ΔF of the system reached the maximum when the incubation time was 10 min. Thus, the incubation was carried out at 70 °C for 10 min.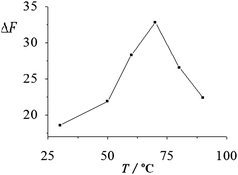 |
| | Fig. 3 Effect of the reaction temperature on the ΔF of the system. The ΔF of the system at reaction temperatures ranging from 30 °C to 90 °C were 18.7, 21.9, 28.3, 32.8, 26.6 and 22.4, respectively, and the corresponding RSD% (n = 6) were 3.1, 2.9, 2.3, 2.1, 2.5 and 2.7. | |
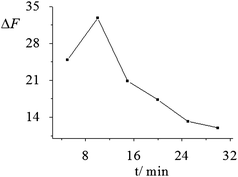 |
| | Fig. 4 Effect of reaction time on the ΔF of the system. The ΔF of the system at reaction times ranging from 5 to 30 min were 24.9, 32.8, 20.8, 17.3, 13.2 and 12.0, respectively, and the corresponding RSD% (n = 6) were 2.7, 2.2, 2.9, 3.2, 3.6 and 3.9. | |
3.2.3 Stability of the fluorescence emission. Under the optimum conditions described above, when the standing times were 5, 10, 15 and 20 min after being cooled for 5 min with water, the ΔF of the system was 32.8 (RSD was 2.2%), 32.4 (RSD was 2.6%), 32.6 (RSD was 2.4%) and 32.9 (RSD was 2.1%), respectively. These results show that the ΔF of the system almost stayed stable and had a good repeatability within 20 min.
3.3 Interference effect of foreign ions
To assess the selectivity of the Zr(CDs–COO)2EDTA probe, the effects of foreign ions on the F− detection were investigated. The interfering effect is defined as the concentration of interfering ions that can change the probe toward F−, when the relative error was more than ±5%. In the detection process, 0.50 μM F− was added to each sample and the other interfering ions were added subsequently, and the results are presented in Table 3.
Table 3 Tolerance ratios of foreign ions for the detection of 0.50 μM F− under the optimal conditions (tolerance ratio is the quotient of the concentration of each foreign ion and F−)
| Foreign ions | Tolerance ratio | Relative error (%) | Foreign ions | Tolerance ratio | Relative error (%) |
|---|
| Cl− | 1000 | 0.79 | PO43− | 100 | 2.2 |
| I− | 100 | 3.7 | Cu2+ | 10 | 2.1 |
| Br− | 100 | 4.1 | Fe3+ | 2 | 4.8 |
| NO3− | 800 | 0.47 | Cd2+ | 20 | 0.32 |
| HCO3− | 100 | 0.46 | Al3+ | 5 | 3.7 |
| H2PO4− | 200 | 2.8 | Mg2+ | 30 | 3.1 |
| HPO42− | 400 | 4.4 | Ca2+ | 10 | 3.0 |
As shown in Table 3, the anions did not interfere with the high tolerance ratio. Among the cations studied, most ions had little interference at a low tolerance ratio except Fe3+ and Al3+. The interference of the cations at higher concentrations may be due to the complexing ability of EDTA and –COOH on the surface of the CDs with these metal ions, or the formation of metal–fluoride complexes. However, the addition of EDTA before the detection can effectively mask these ions to some extent. The results indicated that the proposed on–off fluorescent probe is highly selective to F−.
3.4 Analytical characteristics of the proposed probe for F− detection
The fluorescence variations of Zr(CDs–COO)2EDTA in the presence of different concentrations of F− and its working curve were investigated under the optimal conditions (Fig. 5). Results show that the linear regression equation was ΔF = 11.70 + 0.03856CF− (μM) with a correlation coefficient (r) of 0.9952. The linear range, RSD% and LD of this method were compared with those in ref. 6, 8, 9 and 15, and the results are listed in Table 4. Obviously, the proposed probe is responsive to F− in a wide linear range with high sensitivity and precision, and it is simple, non-polluted and suitable for F− detection.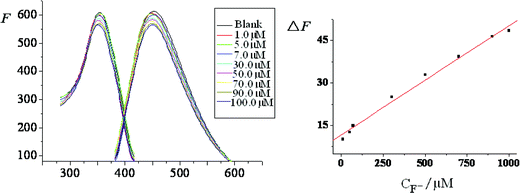 |
| | Fig. 5 Fluorescence linear spectra for the system and its working curve. | |
Table 4 The analytical parameters; RSD% was calculated by the determined results for the samples containing 0.10 μM F− and 10 μM F− 7 times, respectively. The LD was calculated from 3Sb/ k, wherein, 3Sb/ k referred to the quotient between triple of the blank reagent's standard deviation and the slope of the working curve; Sb referred to the standard deviation of 11 parallel analysis of the blank reagent. Sb is 0.040%
| Method | Linear range (μM) | RSD (%) | LD (μM) |
|---|
| The method | 0.10–10 | 2.9–4.3 | 0.031 |
| Ion chromatography6 | 0.53–105.3 | | 0.20 |
| Selective electrode method of F− (ref. 8) | 4.2–10![[thin space (1/6-em)]](https://www.rsc.org/images/entities/char_2009.gif) 500 500 | | 4.2 |
| Fluorescence capillary electrophoresis method9 | 47.4–800 | | 8.9 |
| Colorimetry based on Zr(IV) complexes with dye compounds15 | 3.0–50 | | 2.8 |
3.5 Application of the probe to real samples
To evaluate the potential applicability of the assembled probe, F− detection in 1.00 ml real sample solutions was performed according to the described procedures in Section 2.2.3. As well as this, standard recovery experiments were also carried out. The results have been compared with those obtained by IC and are listed in Table 5. The significant difference in the analysis between the designed probes and IC for the determination of F− is shown in Table 6.
Table 5 Determination of F− in the toothpaste and tap water samples (n = 6)
| Sample | Average found (μM) | F− added (μM) | F− found (μM) | Recovery (%) | R.S.D. (%) | F− found by IC (μM) |
|---|
| Toothpaste 1 | 392.0 | 40 | 40.3 | 100.8 | 1.2 | 387.4 |
| Toothpaste 2 | 409.7 | 45 | 45.2 | 100.4 | 1.1 | 405.6 |
| Tap water 1 | 28.8 | 15 | 15.7 | 104.7 | 2.9 | 27.9 |
| Tap water 2 | 29.5 | 15 | 14.4 | 96.0 | 3.9 | 30.3 |
Table 6 Analysis of the significant differences for determining results (P = 90%, f = n1 + n2 − 2 = 9, F0.90, 9 = 6.3, t0.90, 9 = 1.8)
| Sample | The designed probe (μM, n = 6) | IC (μM, n = 5) | Statistical analysis |
|---|
![[X with combining macron]](https://www.rsc.org/images/entities/i_char_0058_0304.gif) 1 1 | S1 | ![[X with combining macron]](https://www.rsc.org/images/entities/i_char_0058_0304.gif) 2 2 | S2 | F | ![[S with combining macron]](https://www.rsc.org/images/entities/i_char_0053_0304.gif) | t |
|---|
| Toothpaste 1 | 392.0 | 4.3 | 387.4 | 4.6 | 1.1 | 4.5 | 1.7 |
| Toothpaste 2 | 409.7 | 4.5 | 405.6 | 2.3 | 3.9 | 3.4 | 1.8 |
| Tap water 1 | 28.8 | 0.8 | 27.9 | 1.0 | 1.4 | 0.9 | 1.1 |
| Tap water 2 | 29.5 | 1.2 | 30.3 | 1.8 | 2.4 | 1.5 | 0.80 |
As can be seen from Tables 5 and 6, the F was 1.1 and 3.9 for the two toothpaste samples and 1.4 and 2.4 for the two tap water samples, respectively, indicating that there was no significant difference between S1 and S2. The corresponding values for t were 1.7, 1.8 and 1.1, 0.8, respectively, indicating that there was also no significant difference between ![[X with combining macron]](https://www.rsc.org/images/entities/i_char_0058_0304.gif) 1 and
1 and ![[X with combining macron]](https://www.rsc.org/images/entities/i_char_0058_0304.gif) 2. Obviously, the results obtained by the proposed probe tallied well with those obtained by the IC method, indicating that the designed probe was sensitive, accurate and reliable to the detection and monitoring of F− in the environment.
2. Obviously, the results obtained by the proposed probe tallied well with those obtained by the IC method, indicating that the designed probe was sensitive, accurate and reliable to the detection and monitoring of F− in the environment.
3.6 Mechanism of the fluoride detection
As illustrated in Scheme 1, the –COOH on the surface of the obtained CDs was substituted for the two water molecules in Zr(H2O)2EDTA to form the Zr(CDs–COO)2EDTA fluorescent probe with the fluorescence signal of the system enhancing and the λmaxem red-shifting (Fig. 1, Curve c). The possible reason for this phenomena was that the formation of Zr(CDs–COO)2EDTA not only reduced the surface defects of the CDs, but also benefited the existence of the free luminescent molecules in the solution, due to the more negative charges of EDTA on the outermost layer of the new coat layer than –COOH at a pH of 4.0.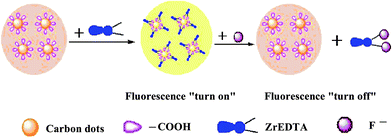 |
| | Scheme 1 A schematic illustration of the designed fluorescent probe for F− detection. | |
However, it is worthwhile to note that the F of the system was gradually quenched with the increasing addition of F− (Fig. 1, curves d and e). These observations could be ascribed to the stronger affinity of F− to Zr(H2O)2EDTA (log K1 = 4.7, log K2 = 2.8)24 compared with the –COOH on the surface of CDs. The significant shift of the 19F-NMR peaks (122.38 ppm, 131.57 ppm) relative to the location of the free F− upon the addition of F− to the Zr(H2O)2EDTA aqueous solution7 and the ΔF of the system not only confirmed the formation of Zr(F)2EDTA, but also demonstrated the properties of this automatic on–off fluorescent probe.
On the other hand, Fig. 6 shows the morphological evolution of the CDs; the formation of CDs–Zr(IV)–EDTA and its transformation to CDs–Zr(F)2EDTA upon the addition of F−. The diameter of the CDs was 5 nm (Fig. 2A) and the corresponding diameter of the formed CDs–Zr(IV)–EDTA in the absence and in the presence of F− was 12 nm (Fig. 2B) and 8 nm (Fig. 2C), demonstrating the presence of a coat of Zr(H2O)2EDTA and Zr(F)2EDTA on the surface of the CDs, respectively. Moreover, the corresponding content of Zr in the CDs–Zr(H2O)2EDTA and CDs–Zr(F)2EDTA was 2.14% and 2.25% and the content of F in CDs–Zr(F)2EDTA was 4.53%. Besides, the ΔF of the system was linear to the concentration of F−. Therefore, the concentration of F− could be detected with the designed Zr(CDs–COO)2EDTA on–off fluorescent probe based on the above facts.
 |
| | Fig. 6 TEM images of the on–off process. (A) CDs alone; (B) CDs–Zr(IV)–EDTA; (C) CDs–Zr(IV)–EDTA in the presence of F−. | |
4. Conclusion
In summary, based on the ligand exchange reaction between F− and the –COOH on the surface of CDs, a novel Zr(CDs–COO)2EDTA fluorescent probe has been designed and successfully applied to F− detection in real samples. The probe exhibits the advantages of rapid and sensitive responses to F−, pollution-free, simplicity and specificity, which is good for the protection of the environment and human health. The research results expand the designing ideas of a fluorescent probe, and demonstrate that CDs with appropriate modification have a broad application in the fields of analytical determination and environmental monitoring.Acknowledgements
This work was supported by the Fujian Province Natural Science Foundation (Grant no. 2010J01053 and JK2010035), Fujian Province Education Committee (JA11164, JA11311, JA10203 and JA10277), Fujian provincial bureau of quality and technical supervison (FJQI 2011006) and the Scientific Research Program of Zhangzhou Institute of Technology Foundation (Grant no. ZZY 1106 and ZZY 1014).References
- M. Kleerekoper, Endocrinol. Metab. Clin. North Am., 1998, 27, 441–452 CAS.
- X. F. Yang, S. J. Ye, Q. Bai and X. Q. Wang, J. Fluoresc., 2007, 17, 81–87 CrossRef CAS.
- J. A. Camargo, Chemosphere, 2003, 50, 251–264 CrossRef.
- G. Whitford, Fluoride Toxicology and Health Effects Chapter 10, in Fluoride in Dentistry, ed. O. Fejerskov, J. Ekstrand and B. Burt, Munksgaard, Copenhagen, 2nd edn, 1996, pp. 167–186 Search PubMed.
- Y. Zhang, X. Sun, G. Sun, S. Liu and L. Wang, AFS Res. Rep., 2006, 39, 191–194 CAS.
- H. Yiping and W. Caiyun, Anal. Chim. Acta, 2010, 661, 161–166 CrossRef.
- D. A. P. Tanaka, S. Kerketta, M. A. L. Tanco, T. Yokoyama and T. M. Suzuki, Sep. Sci. Technol., 2002, 37, 877–894 CrossRef CAS.
- P. Sharma and S. Songara, Rev. Anal. Chem., 2006, 25, 241–256 CAS.
- I. C. Guimaraes, C. C. Rezende, J. A. Fracassi da Silva and D. Pereira de Jesus, Talanta, 2009, 78, 1436–1439 CrossRef CAS.
- T. Balaji and H. Matsunaga, Anal. Sci., 2005, 21, 973–977 CrossRef CAS.
- R. Belcher, M. A. Leonard and T. S. West, J. Chem. Soc., 1959, 3577–3579 RSC.
- X. Gao, H. Zheng, G. Q. Shang and J. G. Xu, Talanta, 2007, 73, 770–775 CrossRef CAS.
- T. L. Har and T. S. West, Anal. Chem., 1971, 43, 136–139 CrossRef CAS.
- H. Matsunaga, C. Kanno, H. Yamada, Y. Takahashi and T. M. Suzuki, Talanta, 2006, 68, 1000–1004 CrossRef CAS.
- P. Xie, F. Guo, W. Wang and X. Liu, Chem. Pap., 2010, 64, 723–728 CrossRef CAS.
- S. S. Yamamura, M. A. Wade and J. H. Sikes, Anal. Chem., 1962, 34, 1308–1312 CrossRef CAS.
- M. Xue, X. Wang, H. Wang, D. Chen and B. Tang, Chem. Commun., 2011, 47, 4986–4988 RSC.
- S. C. Ray, A. Saha, N. R. Jana and R. Sarkar, J. Phys. Chem. C, 2009, 113, 18546–18551 CAS.
- S. N. Baker and G. A. Baker, Angew. Chem., Int. Ed., 2010, 49, 6726–6744 CrossRef CAS.
- J. C. G. E. D. Silva and H. M. R. Gonçalves, TrAC, Trends Anal. Chem., 2011, 30, 1327–1336 CrossRef.
- Y. Takahashi, D. A. P. Tanaka, H. Matsunaga and T. M. Suzuki, J. Chem. Soc., 2002, 2, 759–762 Search PubMed.
- H. Zhu, X. L. Wang, Y. Li, Z. J. Wang, F. Yang and X. R. Yang, Chem. Commun., 2009, 5118–5120 RSC.
- H. G. Langer and J. Inorg, J. Inorg. Nucl. Chem., 1964, 26, 59–72 CrossRef CAS.
- M. L. Li, X. M. Pu, C. S. Zhou and G. Zhou, Data Quick Reference to Analytical Chemistry, Chemical Industry Press, Beijing, 2009, p. 85 Search PubMed.
|
| This journal is © The Royal Society of Chemistry 2013 |
Click here to see how this site uses Cookies. View our privacy policy here. 


![[X with combining macron]](https://www.rsc.org/images/entities/i_char_0058_0304.gif) 1
1![[X with combining macron]](https://www.rsc.org/images/entities/i_char_0058_0304.gif) 2
2![[S with combining macron]](https://www.rsc.org/images/entities/i_char_0053_0304.gif)
![[X with combining macron]](https://www.rsc.org/images/entities/i_char_0058_0304.gif) 1 and
1 and ![[X with combining macron]](https://www.rsc.org/images/entities/i_char_0058_0304.gif) 2. Obviously, the results obtained by the proposed probe tallied well with those obtained by the IC method, indicating that the designed probe was sensitive, accurate and reliable to the detection and monitoring of F− in the environment.
2. Obviously, the results obtained by the proposed probe tallied well with those obtained by the IC method, indicating that the designed probe was sensitive, accurate and reliable to the detection and monitoring of F− in the environment.


![[thin space (1/6-em)]](https://www.rsc.org/images/entities/char_2009.gif) 500
500