A novel fluorescence method for determination of pFe3+
Yongmin
Ma
a,
Yuanyuan
Xie
b and
Robert C.
Hider
*a
aInstitute of Pharmaceutical Science, King's College London, Franklin-Wilkins Building, 150 Stamford Street, London, SE1 9NH, UK. E-mail: Robert.hider@kcl.ac.uk
bKey Laboratory for Green Pharmaceutical Technologies and Related Equipment of Ministry of Education, College of Pharmaceutical Sciences, Zhejiang University of Technology, Hangzhou 310014, P. R. China
First published on 15th October 2012
Abstract
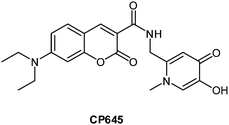
The fluorescence intensity of probe CP645 in the presence of iron and a competing ligand is associated with pFe3+ of the competing ligand. A linear correlation was found to exist between the fluorescence and pFe3+ values. The pFe3+ values of well studied ligands calculated from the standard curve are consistent with reported values. This novel fluorescence method can be used to determine the pFe3+ values of ligands which are difficult to measure using conventional spectrophotometric or potentiometric methods.
Generally, the pFe3+ value, defined as the negative logarithm of the concentration of the free iron(III) in solution, is a more useful parameter than conventional stability constants when iron affinities at physiologically relevant pH values are compared.1 The concept of pM was originally articulated by Chaberck and Martell2 and it has been widely adopted since its introduction. The comparison of ligand pFe3+ values, unlike the stability constants log K or log β3, takes into account the effects of ligand protonation, metal hydrolysis as well as differences in iron–ligand stoichiometries.3–5 pFe3+ values are determined based on acid dissociation constants of the free ligands (pKas) and stability constants of the iron–ligand complexes (log β3). pFe3+ values of dozens of 3-hydroxypyridin-4-ones have been calculated, using HySS program.6 However, it is sometimes difficult using the conventional spectrophotometric or potentiometric methods to determine and correctly assign pKa values when the ligands contain multiple titratable groups, for example with hexadentate and dendrimer ligands.7,8 The pKa values of the chelating groups of bidentate ligands are sometimes difficult to correctly assign, for example some fluorinated 3-hydroxypyridin-4-ones.9 Such circumstances render pFe3+ values difficult to calculate. In such situations, it would be useful to have an alternate method for the determination of pFe3+ values. There are no such alternate methods currently available. Herein we report a novel fluorescence-based method for pFe3+ determination which in principle could be applied to other metal cations.
All of the chelators used in this study and the fluorescent probe CP645 were synthesized as previously described and stored desiccated at room temperature.9–14
 | ||
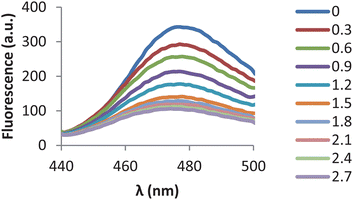
| Fig. 1 Emission spectra of CP645 (6 µM) (λex = 435 nm) in the presence of increasing concentrations of iron(III) (Fe–NTA). | ||
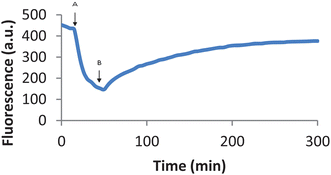
The addition of other ligands to a preformed probe–iron(III) complex led to removal of iron(III) from the probe, therefore releasing the iron-free probe which was accompanied by an increase of fluorescence. Thus, after the fluorescence of CP645 (6 µM) was completely quenched by iron(III) (2 µM), the addition of L5 (60 µM) led to partial recovery of CP645 fluorescence forming a plateau after 5 hours (Fig. 2).
 | ||
| Fig. 2 Fluorescence of CP645 (6 µM) quenched by an addition of iron (2 µM) and recovered by the addition of L5 (60 µM). Fluorescence of CP645 in MOPS buffer (pH 7.4) was traced at a 5 min intervals; after 18 min, iron (2 µM) was added to the cuvette (A), followed by L5 (60 µM) after 52 min (B). The fluorescence was recorded at λex = 435 nm and λem = 475 nm for 5 hours. | ||
In the competition studies with various ligands, CP645 (6 µM) and Fe–NTA complex (2 µM) were mixed for 30 min prior to the addition of the ligand (60 µM). Nitrilotriacetic acid (NTA) was utilized to prevent the formation of insoluble Fe(OH)3 and the presence of NTA (5 µM) does not interfere with the competition studies. Initially we attempted to use 1![[thin space (1/6-em)]](https://www.rsc.org/images/entities/char_2009.gif) :
:![[thin space (1/6-em)]](https://www.rsc.org/images/entities/char_2009.gif) 1 molar ratio of CP645
1 molar ratio of CP645![[thin space (1/6-em)]](https://www.rsc.org/images/entities/char_2009.gif) :
:![[thin space (1/6-em)]](https://www.rsc.org/images/entities/char_2009.gif) ligand for competition studies. However, the majority of the ligands, especially fluorinated HPOs, failed to increase the fluorescence by an appreciable level under these conditions. Thus in order to increase the sensitivity of the method, a 10-fold higher concentration of the competing ligands was used. After the ligand addition, the mixture was incubated in a sealed 4-clear side cuvette for 1 day at room temperature before measuring the fluorescence intensity. The maximum fluorescence intensities of CP645 (6 µM) and CP645–Fe complex (6 µM
ligand for competition studies. However, the majority of the ligands, especially fluorinated HPOs, failed to increase the fluorescence by an appreciable level under these conditions. Thus in order to increase the sensitivity of the method, a 10-fold higher concentration of the competing ligands was used. After the ligand addition, the mixture was incubated in a sealed 4-clear side cuvette for 1 day at room temperature before measuring the fluorescence intensity. The maximum fluorescence intensities of CP645 (6 µM) and CP645–Fe complex (6 µM![[thin space (1/6-em)]](https://www.rsc.org/images/entities/char_2009.gif) :
:![[thin space (1/6-em)]](https://www.rsc.org/images/entities/char_2009.gif) 2 µM) were set at 100% and 0% respectively. Based on this, the relative fluorescence intensity of CP645–Fe with various ligands could be calculated.
2 µM) were set at 100% and 0% respectively. Based on this, the relative fluorescence intensity of CP645–Fe with various ligands could be calculated.
We selected twelve 3-hydroxypyridin-4-ones containing two pKas (assigned to the 3-hydroxy and 4-oxo functions respectively) and with pFe3+ values covering a wide range in order to perform a correlation. The relative fluorescence was calculated based on a combination of the fluorescence intensities of the free probe and the probe–Fe complex. The data are presented in Table 1.
|
|
||||||
|---|---|---|---|---|---|---|
| Cpd | R1 | R2 | R5 | R6 | pFe3+ | Fl (%) |
| L1 | H | CONHMe | H | Me | 22.8 | 101 ± 3 |
| L2 | Me | CONHMe | H | Me | 21.61 | 85 ± 3 |
| L3 | Me | H | H | H | 21.20 | 84 ± 4 |
| L4 | Me | CONHEt | H | Me | 20.70 | 79 ± 3 |
| L5 | Me | Me | H | H | 20.6 | 69 ± 4 |
| L6 | Et | Et | H | H | 20.5 | 61 ± 3 |
| L7 | H | Et | H | H | 20.28 | 63 ± 4 |
| L8 | Me | Me | H | Me | 20.09 | 64 ± 3 |
| L9 | CH(Me)2 | Me | H | H | 19.89 | 69 ± 2 |
| L10 | H | Me | H | H | 19.59 | 66 ± 2 |
| L11 | H | Me | Me | H | 18.78 | 55 ± 3 |
| L12 | H | H | F | H | 17.80 | 39 ± 2 |
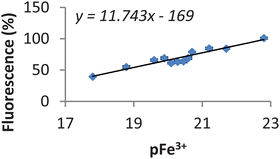
In general, a ligand possessing a higher pFe3+ value is able to mobilise more iron from the CP645–iron complex and therefore has a higher relative fluorescence. The relative fluorescence of these ligands was plotted against their corresponding pFe3+ values and a clear linear relationship was obtained (Fig. 3). We have not been able to determine the pKa values of CP645 due to its instability over the pH range 3–7. However we have determined the pKa values and hence derived the pFe3+ values of a number of close analogues12,15 which lack the fluorescent chromophore and as a result estimate the pFe3+ value for CP645 is in the region 21 ± 1.
 | ||
Fig. 3 Correlations between previously reported pFe3+ values of 12 ligands determined by spectrophotometric titration and the relative fluorescence of CP645 in the presence of iron and corresponding ligands. The fluorescence of CP645 (6 µM) only in MOPS buffer (pH 7.4) was set up at 100% and CP645–Fe (6 µM![[thin space (1/6-em)]](https://www.rsc.org/images/entities/char_2009.gif) : :![[thin space (1/6-em)]](https://www.rsc.org/images/entities/char_2009.gif) 2 µM) at 0%. The relative fluorescence of pre-incubated CP645–Fe (6 µM 2 µM) at 0%. The relative fluorescence of pre-incubated CP645–Fe (6 µM![[thin space (1/6-em)]](https://www.rsc.org/images/entities/char_2009.gif) : :![[thin space (1/6-em)]](https://www.rsc.org/images/entities/char_2009.gif) 2 µM) in the presence of various ligands (60 µM) was calculated based on this setting. 2 µM) in the presence of various ligands (60 µM) was calculated based on this setting. | ||
In order to investigate the accuracy of the standard curve, we selected a few well studied iron chelators for comparison of the reported pFe3+ values with data calculated based on the standard curve. In order to obtain a significant fluorescence response, all the selected chelators should have pFe3+ values within the range of the chelators for standard curve (Fig. 3). These include 8-hydroxyquinoline (8HQ), deferasirox, hydroxyethyl ethylenediamine triacetic acid (HEDTA), ethylenediamine tetraacetic acid (EDTA) and rhizoferrin. These chelators have either no fluorescence or extremely weak fluorescence under these experimental conditions and therefore do not interfere the fluorescence measurement. The result is shown in Table 2. It demonstrates that the pFe3+ values obtained from the fluorescence method are consistent with the reported values.
| Chelator | Chelator type | Fl (%)a | pFe3+ | Lit. pFe3+ |
|---|---|---|---|---|
| a The incubation of different type of ligands with CP645–Fe complex was carried in sealed cuvettes for 3 days rather than 1 day for the chelators in Table 1. b Ref. 16. c Ref. 3. d pFe3+ was calculated based on the pKa values at 2.6, 5.3, 9.7 (ref. 17) and K1 at 19.8 (ref. 18) using the HySS program. e Ref. 19. | ||||
| 8HQ | Bidentate | 69 ± 4 | 20.3 ± 0.3 | 20.6b |
| Deferasirox | Tridentate | 102 ± 3 | 23.1 ± 0.3 | 22.5c |
| HEDTA | Pentadentate | 56 ± 1 | 19.2 ± 0.1 | 18.4d |
| Rhizoferrin | Hexadentate | 53 ± 5 | 18.9 ± 0.4 | 20.0e |
| EDTA | Hexadentate | 104 ± 1 | 23.3 ± 0.1 | 23.4c |
Based on the equation relating to this calibration curve, the pFe3+ values of a range of fluorinated HPOs can be calculated using their relative fluorescence values. Comparison of the pFe3+ values obtained from spectrophotometric measurements and the values calculated from the relative fluorescence studies again demonstrates a good correlation. The difference of pFe3+ values determined by the two methods falls in the range 0–1.1, with the largest difference being associated with L32 (Table 3).
|
|
|||||||
|---|---|---|---|---|---|---|---|
| Cpd | R1 | R2 | R5 | R6 | Fl (%) | pFe3+ (FM)a | pFe3+ (SM)b |
| a Fluorescence method. b Spectrophotometric method (estimated error of pFe3+ values is ±0.5). c Data presented in ref. 9 was incorrectly calculated. d The pFe3+ values of L26–L28 as determined by the spectrophotometric method and reported in ref. 9 were found to be inconsistent with the values obtained using the fluorescence method. Careful re-measurement of these values by spectrophotometric titration led to the corrected values presented in this table. | |||||||
| L13 | Me | COCF3 | H | Me | 50 ± 1 | 18.6 ± 0.1 | 18.7 |
| L14 | H | F | H | H | 61 ± 3 | 19.6 ± 0.3 | 18–20 |
| L15 | Me | F | H | H | 70 ± 2 | 20.4 ± 0.2 | 19.4 |
| L16 | Et | F | H | H | 69 ± 4 | 20.3 ± 0.3 | 19.6 |
| L17 | n-Pr | F | H | H | 68 ± 5 | 20.2 ± 0.4 | 19.5 |
| L18 | n-Bu | F | H | H | 65 ± 5 | 20.0 ± 0.4 | 20.1 |
| L19 | H | F | H | Me | 40 ± 1 | 17.8 ± 0.1 | 17–19 |
| L20 | H | F | Me | H | 43 ± 1 | 18.1 ± 0.1 | 16.5–18.5 |
| L21 | H | F | Me | Me | 43 ± 2 | 18.1 ± 0.2 | 16.5–18 |
| L22 | Me | F | Me | H | 72 ± 3 | 20.6 ± 0.2 | 20.5c |
| L23 | H | Me | F | H | 44 ± 1 | 18.2 ± 0.1 | 18.9 |
| L24 | Me | Me | F | H | 51 ± 1 | 18.8 ± 0.1 | 18.5 |
| L12 | H | H | F | H | 39 ± 1 | 17.8 ± 0.1 | 17.8 |
| L25 | H | H | F | Me | 41 ± 1 | 17.9 ± 0.1 | 18.6 |
| L26 | Me | H | F | H | 46 ± 2 | 18.4 ± 0.2 | 18.5d |
| L27 | Et | H | F | H | 45 ± 2 | 18.3 ± 0.2 | 18.6d |
| L28 | n-Pr | H | F | H | 44 ± 2 | 18.2 ± 0.2 | 18.7d |
| L29 | H | F | F | F | 44 ± 3 | 18.2 ± 0.3 | 18.8 |
| L30 | H | F | H | F | 55 ± 4 | 19.1 ± 0.3 | 19.8 |
| L31 | H | CF3 | H | H | 70 ± 4 | 20.4 ± 0.3 | 20–21 |
| L32 | Me | CF3 | H | H | 34 ± 1 | 17.3 ± 0.1 | 16.2 |
In conclusion, this is the first time a competition study based on fluorescence has been used to determine the pFe3+ of ligands. This method is unprecedented and represents a completely new concept for such determinations. A related technique, based on the displacement of fluorescent indicators has been reported for anion sensing, but this method is not dependent on fluorescence quenching.20,21 Although the pFe3+ values obtained by this method are dependent on the existence of a standard curve which in turn is based on known values of other ligands determined by different methods and therefore are relative, the sequence of iron affinities for the group is precisely determined. This method is a practical alternative for the determination of pFe3+ values of complicated chelators associated with several species, which can lead to difficulty in the accurate determination of pFe3+ by spectrophotometric or potentiometric methods. In principle, the bidentate probe CP645 could be extended for use with large range of chelator groups. Practically it will be ideal to use this probe for the competition study with ligands possessing pFe3+ values falling in the range of 17–23 in order to achieve a good fluorescence response. Weaker ligands such as maltol (pFe3+, 15) and 1-hydroxypyridin-2-one (pFe3+, 16) cannot compete iron from CP645–iron complex and therefore the fluorescence recovery is below 10%. At the other extreme, stronger chelators such as desferrioxamine-B (pFe3+, 26) completely removes iron from the CP645–iron complex and leads to a full fluorescence recovery. Thus, a fluorescent probe possessing a pFe3+ value in the same range as the ligands under investigation is required. In principle, this method can also be applied to the determination of pM for other metals of the targeted ligands, rendering the method a broad application. Currently we are investigating a hexadentate probe with high pFe3+ value for such studies and will offer a ready means of determining pFe3+ values for natural siderophores.
Acknowledgements
We thank Yu-Lin Chen for helpful discussion and the recalculated pFe3+ value of L22 using HySS program from pKa and log β3 values determined by spectrophotometric method.Notes and references
- Z. D. Liu and R. C. Hider, Med. Res. Rev., 2002, 22, 26–64 CrossRef CAS.
- S. A. Chaberck and A. E. Martell, Organic Sequestering Agents, John Wiley & Sons, Inc., New York, 1959 Search PubMed.
- Z. D. Liu and R. C. Hider, Coord. Chem. Rev., 2002, 232, 151–171 CrossRef CAS.
- Z. D. Liu, H. H. Khodr, D. Y. Liu, S. L. Lu and R. C. Hider, J. Med. Chem., 1999, 42, 4814–4823 CrossRef CAS.
- V. M. Nurchi, G. Crisponi, T. Pivetta, M. Donatoni and M. Remelli, J. Inorg. Biochem., 2008, 102, 684–692 CrossRef CAS.
- L. Alderighi, P. Gans, A. Ienco, D. Peters, A. Sabatini and A. Vacca, Coord. Chem. Rev., 1999, 184, 311–318 CrossRef CAS.
- T. Zhou, H. Neubert, D. Y. Liu, Z. D. Liu, Y. M. Ma, X. Le Kong, W. Luo, S. Mark and R. C. Hider, J. Med. Chem., 2006, 49, 4171–4182 CrossRef CAS.
- T. Zhou, Z. D. Liu, H. Neubert, X. Le Kong, Y. M. Ma and R. C. Hider, Bioorg. Med. Chem. Lett., 2005, 15, 5007–5011 CrossRef CAS.
- Y. M. Ma, S. Roy, X. L. Kong, Y. L. Chen, D. Y. Liu and R. C. Hider, J. Med. Chem., 2012, 55, 2185–2195 CrossRef CAS.
- Y. M. Ma, W. Luo, P. J. Quinn, Z. D. Liu and R. C. Hider, J. Med. Chem., 2004, 47, 6349–6362 CrossRef CAS.
- P. S. Dobbin, R. C. Hider, A. D. Hall, P. D. Taylor, P. Sarpong, J. B. Porter, G. Xiao and D. van der Helm, J. Med. Chem., 1993, 36, 2448–2458 CrossRef CAS.
- S. Piyamongkol, Y. M. Ma, X. L. Kong, Z. D. Liu, M. D. Aytemir, D. van der Helm and R. C. Hider, Chem.–Eur. J., 2010, 16, 6374–6381 CrossRef CAS.
- Z. D. Liu, R. Kayyali, R. C. Hider, J. B. Porter and A. E. Theobald, J. Med. Chem., 2002, 45, 631–639 CrossRef CAS.
- M. K. Patel, R. Fox and P. D. Taylor, Tetrahedron, 1996, 52, 1835–1840 CrossRef CAS.
- L. S. Dehkordi, Z. D. Liu and R. C. Hider, Eur. J. Med. Chem., 2008, 43, 1035–1047 CrossRef CAS.
- R. C. Hider, S. Roy, Y. M. Ma, X. L. Kong and J. Preston, Metallomics, 2011, 3, 239–249 RSC.
- J. H. Holloway and C. N. Reilley, Anal. Chem., 1960, 32, 249–256 CrossRef CAS.
- R. M. Smith and A. E. Martell, Critical Stability Constants, Plenum Press, New York, 1989, vol. 1–6 Search PubMed.
- R. C. Hider and X. Kong, Nat. Prod. Rep., 2010, 27, 637–657 RSC.
- B. T. Nguyen and E. R. Anslyn, Coord. Chem. Rev., 2006, 250, 3118–3127 CrossRef CAS.
- M. Boiocchi, M. Bonizzoni, L. Fabbrizzi, G. Piovani and A. Taglietti, Angew. Chem., Int. Ed., 2004, 43, 3847–3852 CrossRef CAS.
| This journal is © The Royal Society of Chemistry 2013 |


