Multiplexed detection of aquaculture fungicides using a pump-free optofluidic SERS microsystem
Soroush H.
Yazdi
and
Ian M.
White
*
Fischell Department of Bioengineering, University of Maryland, College Park, MD 20742, USA. E-mail: ianwhite@umd.edu; Fax: +1 301-405-9953; Tel: +1 301-405-6230
First published on 24th October 2012
Abstract
In this work, an optofluidic SERS device optimized for on-site analytics in the field is utilized for the multiplexed detection of three fungicides that are highly regulated in aquaculture. The optofluidic SERS microsystem does not require a bulky pump for sample loading, which significantly improves its portability; the sample is simply loaded into the device by applying negative pressure using a pipette. Moreover, integrated fiber optic cables automate sample excitation and signal collection without the need for alignment on a traditional Raman microscope. The detection zone of the device consists of a porous matrix of packed silica microspheres that accumulates silver nanoparticles and adsorbed analyte molecules. This passive concentration matrix has been shown to boost the SERS signal by up to four orders of magnitude as compared to SERS in an open microfluidic channel. We were able to detect as low as 5 ppm methyl parathion, 0.1 ppb malachite green, and 5 ppb thiram simultaneously.
Surface enhanced Raman spectroscopy (SERS) is a vibrational spectroscopy technique that has been proven to be highly sensitive for trace chemical detection. The power of SERS detection is the label-free detection capabilities, due to the highly specific Raman scattering fingerprint, combined with the high sensitivity, which results from the localized plasmonic enhancement of noble metal nanostructures. SERS has been used to detect a wide range of targets, including DNA,1,2 proteins,3,4 pesticides,5,6 and metabolites.7 Additionally, the Raman scattered fingerprint spectrum is a narrow band signal compared to fluorescence; this highly specific and narrow band characteristic of SERS implies that it can be used to detect multiple analytes simultaneously.2,8,9
In spite of these capabilities, SERS has been limited to research labs due to stationary equipment and high cost substrates. However, the emerging field of optofluidic SERS has the potential to enable SERS to be practical for real-world applications.10,11 Optofluidics is the synergistic integration of microfluidics and photonics, and may lead to the development of portable, automated, and sensitive optical detection systems.10–14 Several optofluidic SERS devices reported in the literature improve the SERS signal by concentrating the target analyte molecules and/or silver nanoparticles (AgNPs) within the optical detection region.15–21 The combination of optofluidic SERS microsystems with portable spectrometers and laser diodes can be the key to leveraging SERS for on-site detection of a variety of analytes.
Previously we reported the development of a porous microchannel to passively concentrate AgNPs and analyte molecules.6 The increase in the number of analyte molecules and SERS active “hot spots” trapped in the detection volume leads to an increase in the SERS signal of up to four orders of magnitude as compared to SERS in an open microfluidic channel. In addition, two fiber optic cables are inserted into the PDMS device via microchannels and aligned to the detection zone, which eliminates the need for a bulky microscope and for manual optical alignment before detection.
In the present work, we report the multiplexed detection of three highly regulated aquaculture fungicides while greatly improving the portability and practicality of the system. We have eliminated the need for a syringe pump for sample loading by simply using a pipette and applying negative pressure from the outlet to load the sample droplet from the inlet. Fig. 1 presents the schematic of the device. The sample is drawn into the microsystem in a few seconds, which greatly improves the time for analysis as compared to using a syringe pump (2 minutes). As shown in the figure, all that is necessary for on-site analysis with the optofluidic device is a pipette and a portable spectrometer system with a fiber optic interface.
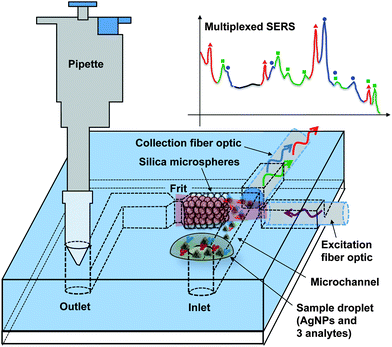 | ||
| Fig. 1 Concept of the pump-free optofluidic SERS device. Negative pressure from a pipette draws the sample into the channel. Packed silica microspheres trap and concentrate AgNPs and adsorbed analytes. Integrated fiber optic cables eliminate the need for a microscope. | ||
To demonstrate a practical use of the optofluidic SERS microsystem for on-site analytics, we simultaneously detected methyl parathion, thiram, and malachite green. These fungicides have been used to control fungal infections in fish. However, their use is highly regulated due to potential toxicity to fish, as well as toxicity and carcinogenicity in humans.22–24 As a result, there is a clear motivation to develop an on-site analytical tool that can simultaneously identify the presence of each of these fungicides in a single measurement. With our simple-to-operate SERS microsystem, we were able to detect simultaneously 0.1 ppb malachite green, 5 ppb thiram, and 5 ppm methyl parathion. While individual detection of these three fungicides using SERS has been reported in literature,25–31 to our knowledge this is the first report of multiplexed detection of the fungicides with a SERS microsystem.
The detection region of the device is shown in Fig. 2. The optofluidic microsystem was fabricated with polydimethylsiloxane (PDMS, Dow Corning) by standard photolithography techniques using silicon as the mold. The PDMS device was bonded to glass to seal the microchannels using a corona surface treatment. A frit is formed by narrowing the microchannel width from 125 μm to 20 μm in order to trap silica microspheres (15 μm, Kisker Biotech GmbH & Co), which form a porous matrix to concentrate AgNPs and adsorbed analyte molecules. The surface of the silica microspheres was modified using 3-mercaptopropyltrimethoxysilane (3-MTS, Sigma) in order to improve AgNP capture within the detection zone. The 3-MTS modified silica microspheres were loaded into the device by placing a droplet of silica beads at the inlet and applying vacuum at the outlet. Two multimode fiber optic cables were inserted into PDMS through microchannels (125 μm in height) and aligned to the detection zone, as shown in Fig. 2. We have shown previously that the use of multimode fiber optic cables aligned with the detection region reduces signal variability from device to device because there are a large number of silver nanoparticle aggregates within the detection region, making the device less vulnerable to the high variability of SERS “hot spots.”6
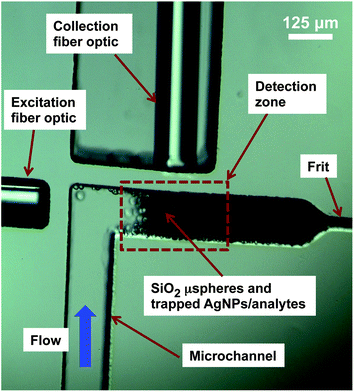 | ||
| Fig. 2 Image of the detection region of the optofluidic SERS device. | ||
Silver nanoparticles were synthesized using the Lee–Meisel method.32 Sodium chloride (20 mM) was added to the AgNP colloid and mixed by vortexing the tube before the experiments to promote aggregation. Rhodamine 6G (Exciton), thiram (Sigma), malachite green oxalate (Sigma), and methyl parathion (Cerilliant) were used as the analytes. For the SERS measurements, a 15 mW 785 nm laser diode was used for sample excitation and an iHR550 Horiba JY modular spectrometer was used to detect Raman scattered photons. An exposure time of five seconds was used in the measurements.
For each experiment AgNPs were mixed with selected concentrations of analytes and introduced into the channel. Mixing was done by vortexing the solution in a microtube for a few seconds. As conceptually illustrated in Fig. 1, sample introduction was performed by placing a 4 μL droplet at the inlet and then applying a vacuum at the outlet simply by using a 1000 μL pipette. Immediately after loading the sample, the Raman spectrum was acquired.
While it is visually evident that pipette-based sample injection pulls the sample through the device as effectively as the slow but systematic loading of a motorized syringe pump, the ultimate measure of comparability is in the detection performance and repeatability. In order to compare sample loading by a pipette versus a syringe pump, R6G was mixed with AgNPs and loaded into the device by either using a syringe pump or a pipette. For the syringe pump experiment, the sample was introduced into the channel at a flow rate of 2 μL min−1; the SERS signal was recorded until it reached a maximum, which took 2 minutes (i.e., 4 μL sample passed through the silica bead matrix). In the pipette experiments, a 4 μL sample droplet was placed on the inlet and the sample was drawn into the device by applying negative pressure from the outlet using pipette. A 1000 μL pipette was used to ensure enough pressure for loading. The experiments were repeated three times, each on a different device.
Average SERS spectra for each sample loading procedure are shown in Fig. 3. The intensity of the measured SERS signal is quite similar for each case. Furthermore, we investigated the repeatability of the detection performance using the pipette. The error bars on three prominent R6G Raman peaks show the standard deviation of the peak intensity. Across three trials, the relative standard deviation of the height of the three Raman peaks was only 7.4% (1310 cm−1), 7.5% (1360 cm−1), and 7.7% (1508 cm−1). This indicates that pipette-based loading of the optofluidic SERS device results in a repeatable SERS signal. Finally, in addition to being highly repeatable and as effective as the syringe pump, the analysis time was reduced from 2 minutes (using the syringe pump) to approximately 5 seconds (using the pipette).
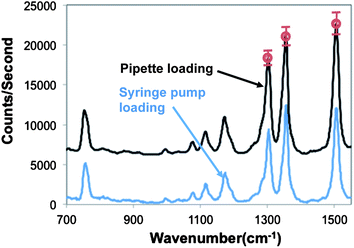 | ||
| Fig. 3 Representative SERS spectra acquired when loading R6G samples either by pipette or syringe pump. Error bars represent the standard deviation of the intensity of the peaks. Spectra are shifted vertically for clarity. | ||
To demonstrate the simple-to-operate optofluidic SERS device for practical on-site analytical applications, we assessed the device's performance for detecting three highly regulated aquaculture fungicides. Before performing multiplexed detection of the fungicides, each fungicide was detected separately to investigate its SERS spectra. Methyl parathion, malachite green oxalate, or thiram was mixed with AgNP colloid and a 4 μL droplet was placed at the inlet and drawn into the microchannel using a pipette. Fig. 4 shows the SERS spectra of each fungicide. The major peaks of each fungicide are denoted in the spectrum. The major SERS peaks for malachite green oxalate are 902, 1162, 1208, 1286, 1359, 1387, 1585, and 1614 cm−1. Methyl parathion is identified with peaks at 844, 1100, 1153, 1337, and 1583 cm−1. The thiram peaks are located at 911, 1133, 1375, 1430, and 1508 cm−1. Using our optofluidic SERS device, we are able to detect malachite green oxalate, methyl parathion, and thiram down to concentrations as low as 0.1 ppb, 5 ppm, and 1 ppb respectively.
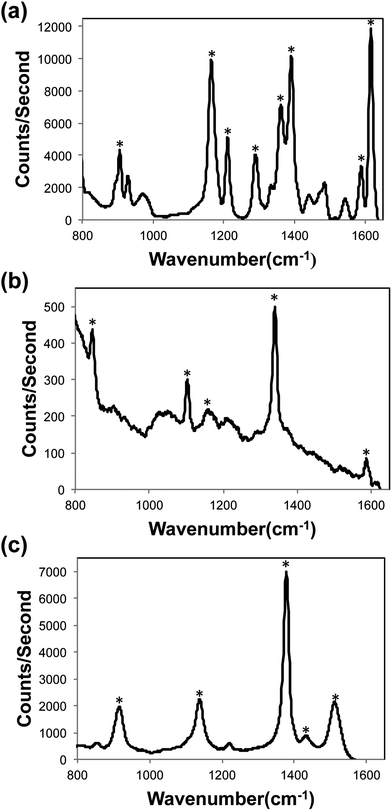 | ||
| Fig. 4 SERS spectra of (a) 50 ppb malachite green, (b) 10 ppm methyl parathion, (c) 50 ppb thiram. | ||
Finally, the respective concentrations of the three fungicides were mixed together, added to the aggregated silver colloid, and pipetted into the device. The SERS spectrum for 0.1 ppb malachite green oxalate, 5 ppm methyl parathion, and 5 ppb thiram is shown in Fig. 5. Although the spectral peaks for thiram were visible at 1 ppb when detected alone, its presence at 1 ppb could not be confirmed in the multiplexing experiment because its most prominent peak, 1375 cm−1, is masked by the malachite green spectral peaks at 1359 and 1387 cm−1. However, at a concentration of 5 ppb, the thiram peaks at 1375 and 1508 cm−1 become apparent (Fig. 5), thus enabling detection of all three fungicides simultaneously. This detection performance for each analyte is comparable to or better than current reports in the literature for the SERS-based detection of each fungicide individually,25–29,31 with the exception of the report by Lee, et al., in which methyl parathion was detected down to 100 ppb30 (a superior optical system and larger integration times were used in that work).
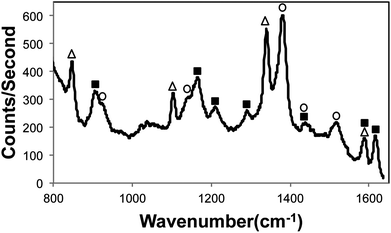 | ||
| Fig. 5 Multiplexed SERS spectrum of 0.1 ppb malachite green oxalate (■), 5 ppm methyl parathion (△), and 5 ppb thiram (○). | ||
To our knowledge, this represents the first report of multiplexed detection of these three fungicides using SERS. Moreover, our detection system is optimized for the on-site analysis of water samples to detect these and other fungicides at aquafarms. The user simply needs the microfluidic chip, a pipette, a sample vial, and a portable spectrometer system with a fiber optic interface. A microscope and a syringe pump, which are typically utilized in other microfluidic SERS reports, are not necessary.
In the future, the optofluidic SERS microsystem can be extended to many other applications that can benefit from on-site analysis, including pesticide detection in water sources, antibiotics detection in food and drinking products, and chemical analysis for forensics. In moving towards these and other applications, a number of practical considerations can be explored. First, although we are able to demonstrate simultaneous detection of three analytes by the identification of Raman peaks unique to each analyte, the use of principal component analysis can enable us to increase the number of targeted analytes while also improving the detection limit. In addition, as the number of analytes increases, or as the sample matrix complexity increases, additional filtering and separation may need to be performed. For example, a membrane filter can be inserted at the inlet to remove particulates or microorganisms. Furthermore, the microfluidic channel could be designed to provide chromatographic separation as well. One can envision an extension of the device reported here such that packed silica beads in the microfluidic channel are not only used to concentrate nanoparticles, but are employed as a chromatographic separation column to provide at least coarse separation of the molecular components of the sample.
Ultimately, we expect that the development of powerful yet portable and simple-to-operate devices are the key to differentiating SERS from traditional chemical analysis techniques used in central lab facilities. Optofluidic SERS devices, such as the one reported here, can enable low-cost measurements in the field, thus opening many new analytical applications. As a result, SERS may finally realize its potential as a highly sensitive and specific analytical technique for trace chemical and biomolecule detection.
Notes and references
- N. R. Isola, D. L. Stokes and T. Vo-Dinh, Anal. Chem., 1998, 70, 1352–1356 CrossRef CAS.
- Y. C. Cao, R. Jin and C. Mirkin, Science, 2002, 297, 1536–1540 CrossRef CAS.
- T. Li, L. Guo and Z. Wang, Anal. Sci., 2008, 24, 907–910 CrossRef CAS.
- D. S. Grubisha, R. J. Lipert, H. Y. Park, J. Driskell and M. D. Porter, Anal. Chem., 2003, 75, 5936–5943 CrossRef CAS.
- J. Vongsvivut, E. G. Robertson and D. McNaughton, J. Raman Spectrosc., 2010, 41, 1137–1148 CrossRef CAS.
- S. H. Yazdi and I. M. White, Biomicrofluidics, 2012, 6 CrossRef , 014105(1)–014105(9).
- L. Seballos, J. Z. Zhang and R. Sutphen, Anal. Bioanal. Chem., 2005, 383, 763–767 CrossRef CAS.
- K. Faulds, R. Jarvis, W. E. Smith, D. Graham and R. Goodacre, Analyst, 2008, 133, 1505–1512 RSC.
- A. MacAskill, D. Crawford, D. Graham and K. Faulds, Anal. Chem., 2009, 81, 8134–8140 CrossRef CAS.
- X. Fan and I. M. White, Nat. Photonics, 2011, 5, 591–597 CrossRef CAS.
- C. Monat, P. Domachuk and B. Eggleton, Nat. Photonics, 2007, 1, 106–114 CrossRef CAS.
- Y. Yin, T. Qiu, W. Zhang and P. K. Chu, J. Mater. Res., 2011, 26, 170–185 CrossRef CAS.
- D. Psaltis, S. R. Quake and C. Yang, Nature, 2006, 442, 381–386 CrossRef CAS.
- I. M. White, S. H. Yazdi and W. W. Yu, Microfluid. Nanofluid., 2012, 12, 205–216 CrossRef.
- J. Liu, I. White and D. L. DeVoe, Anal. Chem., 2011, 83, 2119–2124 CrossRef CAS.
- I. Choi, Y. S. Huh and D. Erickson, Lab Chip, 2011, 11, 632–688 RSC.
- H. Hwang, D. Han, Y.-J. Oh, Y.-K. Cho, K.-H. Jeong and J.-K. Park, Lab Chip, 2011, 11, 2518–2525 RSC.
- H. Cho, B. Lee, G. L. Liu, A. Agarwal and L. P. Lee, Lab Chip, 2009, 9, 3360–3363 RSC.
- B. Han, N. Choi, K. H. Kim, D. W. Lim and J. Choo, J. Phys. Chem. C, 2011, 115, 6290–6296 CAS.
- M. Wang, N. Jing, I.-H. Chou, G. L. Cote and J. Kameoka, Lab Chip, 2007, 7, 630–632 RSC.
- Y. Guo, M. K. Khaing Oo, K. Reddy and X. Fan, ACS Nano, 2012, 6, 381–388 CrossRef CAS.
- D. A. Monteiro, F. T. Rantin and A. L. Kalinin, Comp. Biochem. Physiol., Part C: Toxicol. Pharmacol., 2009, 149, 40–49 CrossRef.
- S. Srivastava, R. Sinha and D. Roy, Aquat. Toxicol., 2004, 66, 319–329 CrossRef CAS.
- EPA, R.E.D. FACTS Thiram.
- A. M. Alak and T. Vo-Dinh, Anal. Chem., 1987, 59, 2149–2153 CrossRef CAS.
- F. Yan and T. Vo-Dinh, Sens. Actuators, B, 2007, 121, 61–66 CrossRef.
- B. Saute and R. Narayanan, Analyst, 2011, 136, 527–532 RSC.
- B. Han, N. Choi, K. H. Kim, D. W. Lim and J. Choo, J. Phys. Chem. C, 2011, 115, 6290–6296 CAS.
- S. Sanchez-Cortes, C. Domingo and J. Garcia-Ramos, Langmuir, 2001, 17, 1157–1162 CrossRef CAS.
- D. Lee, S. Lee, G. H. Seong, J. Choo, E. K. Lee, D.-G. Gweon and S. Lee, Appl. Spectrosc., 2006, 60, 373–377 CrossRef CAS.
- S. Lee, J. Choi, L. Chen, B. Park, J. B. Kyong, G. H. Seong, J. Choo, Y. Lee, K.-H. Shin, E. K. Lee, S.-W. Joo and K.-H. Lee, Anal. Chim. Acta, 2007, 590, 139–144 CrossRef CAS.
- P. C. Lee and D. Meisel, J. Phys. Chem., 1982, 86, 3391–3395 CrossRef CAS.
| This journal is © The Royal Society of Chemistry 2013 |
