Evaluation of macroporous blood and plasma scaffolds for skeletal muscle tissue engineering†
Linda
Elowsson
*a,
Harald
Kirsebom
b,
Virginie
Carmignac
a,
Bo
Mattiasson
b and
Madeleine
Durbeej
a
aMuscle Biology Unit, Department of Experimental Medical Science, Lund University, Lund, Sweden. E-mail: linda.elowsson@med.lu.se; Fax: +46 46 222 08 55
bDepartment of Biotechnology, Lund University, Lund, Sweden
First published on 3rd January 2013
Abstract
The field of tissue engineering has a growing need for suitable scaffold materials to become attractive as a clinical therapy. To use a completely autologous construct to repair a damaged or diseased tissue is an appealing thought. As a model system, two types of scaffolds were prepared from biological fluids: blood and plasma. The prepared scaffolds formed a macroporous structure with elastic mechanical properties that were further evaluated with myoblast cell line (C2C12) cultivation and transplantation into mouse skeletal muscle. The cells were found to attach, proliferate, and migrate through all the different scaffolds. Moreover, the cells underwent myogenic differentiation, showing typical cell morphology aligned in a parallel fashion. An increased level of myogenin mRNA was found with the time of culture. Furthermore, myogenic markers MyoD1, desmin, myogenin and myosin, as well as β-dystroglycan and the laminin α2 chain, were found to be expressed. In vivo data indicated that the scaffolds degraded and were replaced with regenerated muscle fibres. We conclude that the two types of macroporous scaffolds based on blood or plasma have potential in the field of skeletal muscle tissue engineering.
Introduction
There is an increasing need for new treatments of severely injured and diseased tissues. Tissue engineering offers an attractive alternative, where the patient's own cells could be used to regenerate and replace the damaged tissue. The basic theory behind tissue engineering is to pre-culture isolated cells from a small biopsy in vitro on a load-bearing scaffold prior to implantation.1,2 The scaffold has to support cell attachment3,4 and proliferation, as well as differentiation of the specific cell phenotype.5,6 In their natural environment, the cells are surrounded by an extracellular matrix (ECM) and it is well known that the interaction between the cells and the ECM is essential for their function.7 Several different types of scaffold materials of natural and synthetic origin or a combination of the two have been investigated.8 Materials such as polyglycolic acid, polylactic acid,9 and collagen hydrogels10,11 have been approved by the U.S. Food and Drug Administration (FDA) and are being used in different medical applications. Ideally the scaffold should mimic the characteristics of the ECM of the tissue with similar structure and physical properties. Even though there are a number of FDA approved natural materials that can be used for scaffold fabrication, many of these are derived from animals such as bovine collagen,12 which introduces the risk of cross-contamination of diseases13 (a risk that also exists for allogeneic transplantation14). For scaffolds to be attractive in the clinic, it is essential to find materials that avoid any such risks.The use of autologous materials in medical applications is an attractive thought to avoid immune rejections of a transplanted tissue construct. Blood and plasma are materials that are readily available from most patients. Whole blood consists of blood cells (45%) and plasma (55%). The blood cells are primarily erythrocytes (99%), while plasma is an aqueous solution (91% water) mainly containing proteins such as albumins, globulins and fibrinogen.15 Through centrifugation it is easy to separate the plasma from blood. Both blood- and plasma-based materials would have the advantage of being materials that the body would recognise.
Not only is the material important for the design of the scaffold, but also for the architecture and physical properties.16,17 Parameters such as pore size18,19 and elasticity7,20,21 have been shown to influence the differentiation, morphology and migration of cells. Methods including electro-spinning,12 freeze drying,22 and lithographic micro-patterning23,24 have been used to control and modify the properties of the scaffold material.
Recently, we utilised a cryogelation technique for the formation of macroporous scaffolds.25 It is a simple and reproducible technique, which does not require long preparation times. The technique is based on the concept that freezing of a solution or suspension results in a two-phase system, a solid and a liquid phase, where the forming ice crystals expel solutes and particles into a non-frozen phase surrounding the formed crystals. In this non-frozen phase, reactions can take place to form a stable network and as a result the prepared sample can be thawed at room temperature to yield a macroporous material.26 Cryogelation has previously been used by a number of groups to prepare scaffold materials for tissue engineering applications. However, mainly animal derived proteins,27 such as polysaccharides25,28 or synthetic precursors,29 have been used as starting materials for cryogels. In the current study we exploit different biological fluids that readily can be obtained from patients as a potential source of autologous material. As a model system two types of scaffolds were developed based on the cryogelation of either blood or plasma and evaluated in vitro using a myoblast cell line (C2C12). The scaffolds were also transplanted into mice for evaluation of biocompatibility.
Materials and methods
Blood- and plasma-based cryogels
Glass bottles with acid citrate dextrose anticoagulant (ACD) were cooled on ice. Fetal bovine blood was collected from the local abattoir (Team Ugglarp AB), added (4 ml of blood for 1 ml of ACD) to the bottles and gently mixed in. The blood mixture was stored on ice for <2 h until further use.Whole blood was used either undiluted or mixed with phosphate buffered saline (PBS) in a ratio of 1![[thin space (1/6-em)]](https://www.rsc.org/images/entities/char_2009.gif) :1 (v/v) and stored on ice. Thereafter glutaraldehyde (50% w/v) was added to each sample to a final concentration of 0.25% (w/v) and aliquots of 0.5 ml were transferred to glass tubes (inner diameter 7 mm) and frozen at −12 °C in an ethanol cooled cryostat. The samples were kept at −12 °C for 16 hours and then thawed at room temperature and washed with water, treated with 50 mM sodium borohydride in 0.1 M carbonate buffer (pH 9.2) followed by rinsing with degassed water to remove any trapped bubbles and to return pH to neutrality. The cryogels were then stored in water at 4 °C until further use.
:1 (v/v) and stored on ice. Thereafter glutaraldehyde (50% w/v) was added to each sample to a final concentration of 0.25% (w/v) and aliquots of 0.5 ml were transferred to glass tubes (inner diameter 7 mm) and frozen at −12 °C in an ethanol cooled cryostat. The samples were kept at −12 °C for 16 hours and then thawed at room temperature and washed with water, treated with 50 mM sodium borohydride in 0.1 M carbonate buffer (pH 9.2) followed by rinsing with degassed water to remove any trapped bubbles and to return pH to neutrality. The cryogels were then stored in water at 4 °C until further use.
The whole blood was centrifuged at 2000g for 20 min to separate out the plasma. Cryogels from plasma were prepared using the same protocol as described for blood above.
Characterisation of cryogels
The solid content of the produced cryogels was determined by drying the samples at 60 °C until constant weight. Solid content was then reported as the dry weight per ml of wet gel (triplicates were performed for each sample).The swelling degree of the cryogels was determined in order to investigate the water uptake of the produced material. The swelling was calculated according to:
| Sw = (mwet − mdry)/mdry |
In order to study the elastic modulus the samples were compressed up to 80% using a TA-XT2 instrument (Stable Micro Systems, Goldalming, Surrey, U.K.). A compression speed of 1 mm s−1 and a 25 mm diameter plunger were used. The elastic modulus was calculated at 40% compression, which was in the linear range of the system, according to the following equation:
| E = (F/A)/(Δl/l) |
Cell culture
Mouse myoblasts (cell line C2C12) were expanded in numbers using a proliferative medium containing Dulbecco's modified Eagle high glucose medium (DMEM Glutamax™-1; Gibco, Invitrogen), 10% fetal bovine serum (FBS; Gibco, Invitrogen), and 1% penicillin–streptomycin (Pen/Strep: Gibco, Invitrogen). The myoblasts were maintained below 70% confluency and passaged every 2–3 days with 0.05% trypsin-EDTA (Gibco, Invitrogen). The prepared cryogels were cut into 1 mm thin discs (ø = 7 mm) and sterilised in iso-propanol for 15 minutes and washed with PBS. Prior to cell seeding the cryogel discs were equilibrated in proliferative medium for 30 minutes. The cryogels were transferred to 6-well plates coated with 1% agarose (Sigma-Aldrich) to prevent cell migration. A volume of 20 μl containing 0.5 × 10⁶ myoblasts were seeded per construct, and incubated for 2 hours to allow cell attachment before the addition of 3 ml of proliferative medium. After 24 hours, the cryogel constructs were cultured on a rocking table (rotating speed 5 min−1) for improved gas and nutrient exchange for the rest of the time. On day 3, the proliferative medium was exchanged for a differentiation medium containing DMEM Glutamax™-1, 2% horse serum (Gibco, Invitrogen) and 1% Pen/Strep. The medium was changed every 2–3 days. When the cryogels were seeded, the same amount of cells were seeded in 6-well plates and maintained as monolayer cultures and used as controls.Cell viability, proliferation and distribution
The cell proliferation was assessed on day 1, 3, 7, and 14 of culture by the incorporation of 5-bromo-2′-deoxy-uridine (BrdU) for the detection of cellular DNA synthesis using a labelling and detection kit (BrdU Labelling and Detection Kit III; Roche). The cryogel constructs and monolayer cultures were incubated during agitation (5 min−1) overnight with a BrdU labelling solution at 37 °C, 5% CO2, fixed in cooled 70% ethanol in HCl (0.5 M) for 30 minutes at −20 °C. The samples were partially digested with a nuclease solution for 30 minutes in a CO2-free environment prior to incubation with anti-BrdU monoclonal antibody conjugated with peroxidase for 30 minutes at 37 °C. The peroxidase substrate was incubated for 20 minutes at room temperature to yield a cleaved coloured product by the peroxidase, which was directly correlated to the amount of incorporated BrdU. The absorbance at 405 nm was measured with a spectrophotometer (ASYS HITECH). Each data point was performed in quadruplicate.Cell viability was assessed on day 1, 7, and 14 by an XTT (2,3-bis-(2-methoxy-4-nitro-5-sulfophenyl)-2H-tetrazolium-5-carboxanilide, Invitrogen) assay. The assay was carried out in phenol-free DMEM (HyClone, Nordic Biolabs) containing 0.2 mg ml−1 XTT and 0.025 mM phenazine methosulphate (Sigma-Aldrich), prepared fresh and sterilised by filtration (0.2 μm cellulose acetate membrane filter; Sigma-Aldrich) immediately before use. From each group, 4 samples were transferred to 0.5 ml XTT medium in a 24-well plate and incubated for one hour. 3 × 100 μl aliquots were transferred to a micro-titer plate and the colour change was measured in a spectrophotometer (ASYS Expert Plus) at 450 nm.
The cell distribution was estimated at two time points, 2 and 14 days, by counting the number of cells between the edge and the centre of the cryogel construct divided into four equal surface areas. This was done on cryosections (8 μm) stained with haematoxylin and eosin that had been cut from constructs embedded in O.C.T compound (Tissue-Tek) and frozen in liquid nitrogen. The sections were cut with a cryostat (Microm HM 560) and mounted on microscope slides. Four constructs per group were counted.
Scanning electron microscopy
The prepared cryogels were analysed with scanning electron microscopy (SEM). Two mm discs were fixed in 2.5% (w/v) glutaraldehyde in 0.1 M phosphate buffer (pH 7.4) overnight at 4 °C and then stepwise dehydrated in ethanol (0, 25, 50, 75, 96, 99.6%) and finally critically point dried. The dried samples were sputter-coated with gold/palladium (40/60) and examined using a JEOL JSM-5000LV SEM.The cryogel constructs with cultured cells were fixed in freshly prepared 2.5% glutaraldehyde (in phosphate buffer pH 7.4, warmed to 37 °C) for 3 hours. The samples were washed in buffer and post-fixed in 1% osmium tetroxide for 1 hour and then dehydrated in ethanol and treated as described above.
RNA extraction, reverse transcription, and quantitative real-time PCR
Total RNA was extracted from homogenised samples (cryogel constructs and monolayer cultures collected after 2 and 14 days) by using the RNeasy Mini Kit (Qiagen), including a step with proteinase K digestion (Fermentas). From 1 μg of total RNA complementary DNA was synthesised using random primers and SuperScriptII reverse transcriptase (Invitrogen) following the manufacturer's protocol. Quantitative real-time PCR was carried out using Light cycler (Roche) and the Maxima™ SYBR Green/ROX qPCR Master Mix (Fermentas) with primers against the following molecules: MyoD1 (forward: ACTTTCTGGAGCCCTCCTGGCA; reverse: TTTGTTGCACTACACAGCATG), myogenin (forward: CTAAAGTGGAGATCCTGCGCAGC; reverse: GCAACAGACATATCCTCCACCGTG), and α-tubulin (forward: GATCATTGACCTTGTCCTGGACA; reverse: GAGCCGCTCCATCAGCAG) (Roche). Four samples per group were used and pipetted in triplicates. The calculations were performed using formula E−ΔCt. The expression levels were calculated relative to the reference gene (α-tubulin) expression and normalised to a control sample from the monolayer cultures at a time point of 14 days.Immunofluorescence
After 2 days of culture in proliferative medium and after another 12 days in differentiation medium (14 days in total), cryogel constructs were embedded in O.C.T. compound and frozen in liquid nitrogen. Cryosections (8 μm) were fixed in 4% formaldehyde at room temperature for 40 minutes, then blocked and permeabilised for 40 minutes with PBS containing 3% bovine serum albumin (BSA; Sigma) together with 0.04% saponin (Sigma Life Science, BioChemika) or 0.1% Triton X-100 (Sigma). The following primary antibodies were used: myosin (MF20, mouse monoclonal antibody (1:50); Developmental Studies Hybridoma Bank), myogenin (F5D, mouse monoclonal antibody (1:50); Developmental Studies Hybridoma Bank), myogenic differentiation factor 1 (MyoD1, mouse monoclonal antibody (1:100); Dako), β-dystroglycan (Vimsa, rabbit polyclonal antibody (1:10)30), laminin α2 chain (4H8-2 clone, rat (1:100); Alexis Biochemicals), desmin (rabbit monoclonal anti-desmin (1:500); Sigma), laminin γ1 chain (rabbit monoclonal antibody (1:500) generously provided by Dr T. Sasaki30), CD68 (rat monoclonal antibody (1:100)), and tenascin-C (MTn15 (undiluted), Vendor, rat monoclonal antibody26). Primary antibodies were diluted in PBS containing 3% BSA and incubated on sections for 2 hours. Next, sections were incubated with the secondary antibodies (goat anti-mouse and goat anti-rabbit conjugated IgG, Alexa 488; goat anti-rabbit and goat anti-rat conjugated IgG, Alexa 546, Invitrogen) diluted in PBS containing 3% BSA for 1 hour. Finally, the sections were counterstained with nuclear dye DAPI (Sigma) for 3 minutes and mounted with FluoroSave (Calbiochem). Images were acquired with a Zeiss Axioplan fluorescence microscope and captured using an ORCA 1394 ER digital camera with the software program Openlab.3
Western blot analyses
Cryogel constructs and monolayer cultures were collected after 2 and 14 days. As reference, the expression of tubulin was analysed. For desmin analysis, homogenised samples were incubated with an SDS buffer (80 mM Tris-HCl, pH 6.8; 10% SDS; 0.12 M sucrose; 5 mM EDTA, protease inhibitors (Complete; Roche)) at 56 °C during agitation at 700 rpm, then sonicated and quantified using a BCA assay (Pierce). For β-dystroglycan analysis, a glycoprotein extraction was performed. Homogenised samples were incubated with a homogenisation buffer (Tris buffered saline, pH 7.6; 1% Triton X-100 (Sigma); 4% protease inhibitors (Roche)), rotating for 60 minutes at 4 °C. 200 μl suspended wheat germ agglutinin beads (Vector) were added per sample and incubated rotating overnight at 2 °C. Beads were spun down, re-suspended twice in an elution buffer (Tris buffered saline; 1% Triton X-100; 4% protease inhibitors; 0.3 M N-acetyl-glucoseamine (Sigma)) and incubated rotating for 10 minutes at 4 °C. Beads were spun down and the supernatant containing the glycoproteins was saved. 20 μg of proteins were loaded on 10% acrylamide SDS gels (Clearpage; CBC Scientific) and blotted onto nitrocellulose membranes (Hybond-C; Amersham). The membranes were blocked with PBS-Tween (0.01% Tween-20) containing 5% milk for 1 hour and incubated with primary antibody for the detection of desmin (Sigma) or β-dystroglycan (Vimsa30) overnight at 4 °C. The horseradish peroxidase-conjugated secondary antibody (Santa Cruz Biotechnology) was incubated on the membranes for 1 hour at room temperature. ECL (Amersham Biosciences) was applied to the membranes prior to exposure to Hyperfilm (Amersham Biosciences) that was lastly developed (AGFA, Curix 60). Afterwards the membranes were washed in PBS-Tween and re-hybridised with anti-tubulin (Sigma) as reference. ImageJ 1.40 software was used for quantification (http://rsb.info.nih.gov/ij/download.html).Animal experiments
Two-month-old Balb/c mice were used and animals were housed according to animal care guidelines and all mouse experimentation was approved by the Malmö/Lund (Sweden) ethical committee for animal research (permit number M42-11). Scaffolds for the animal experiments were produced from mouse blood. Altogether 0.5 ml blood was gently mixed with 0.5 M EDTA and stored on ice for <2 h until further use. For plasma separation, the blood was centrifuged at 3000 rpm for 15 minutes. Cryogels were then prepared with the same method as described above.A 3 mm long incision was made in the quadriceps muscle of the right hind leg. Approximately 3 mm3 muscle was removed and replaced with a piece of scaffold of the same size and shape. The muscle was closed around the scaffold with coated vicryl suture (Ethicon). In the control group, animals were subjected to the same injury where a 3 mm3 piece of muscle was removed from the quadriceps and then sutured together. Also a non-treated muscle was used as control. The animals were sacrificed after 2 or 4 weeks. The allotransplanted quadriceps muscle was dissected after euthanasia, embedded in O.C.T. compound and frozen in liquid nitrogen. Four animals per group were used (two per time point).
Histology of tissue sections
Cryosections of explanted tissues were stained with haematoxylin and eosin following standard procedures.30Statistical analysis
Data are presented as means ± standard deviation of the mean. Statistical significance between groups and between time points was analysed using one-way or two-way ANOVA followed by post multiple test Bonferroni in the software program GraphPad Prism 2.01.Results
Blood and plasma cryogels
Two main model systems, blood and plasma, were used in the study to prepare scaffolds through cryogelation. Blood and plasma were diluted using PBS, or left undiluted. Addition of glutaraldehyde and subsequent freezing at −12 °C caused the proteins and other solutes including the glutaraldehyde to accumulate in the non-frozen phase. Glutaraldehyde then crosslinked the proteins present in the non-frozen phase through the formation of Shiff bases and thus a protein-based gel network was formed.30 Thawing the sample after the reaction caused the ice to melt while the protein network retained its shape due to the covalent crosslinks. Hence a macroporous network was produced with pores that were formed due to the presence of ice crystals during the reaction. For the preparation of cryogels it is important that the ice formation occurs before the reaction takes place to form the material. This was a problem when undiluted blood was used where the high content of blood cells and proteins initiated the crosslinking before freezing, thus no cryogel could be formed. However, dilution of the blood using PBS lowered the protein content and decreased the reaction speed, which allowed for the sample to freeze prior to forming a gel. This resulted in spongy cryogels with flow through properties characteristic of cryogels.31 SEM analysis of the material clearly demonstrated that the structure was heterogeneous with large macropores in the range of 10–50 μm, as a result of the formed ice crystals during the preparation (Fig. 1).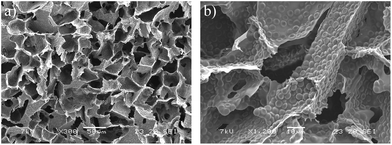 | ||
| Fig. 1 Scanning electron micrographs of cryogel prepared by crosslinking bovine blood: (a) at low magnification illustrating the macroporous structure and (b) at high magnification illustrating the uneven pore wall surface due to the presence of red blood cells. | ||
Cryogels based on plasma were prepared from undiluted plasma or diluted 1:1 (v/v) using PBS. Undiluted plasma yielded cryogels with a higher solid fraction and a higher elastic modulus compared to diluted plasma (Table 1). The degree of swelling decreased with increasing solid content – compare plasma and blood. Diluted plasma with PBS resulted in the formation of cryogels that were elastic and permeable to water and this type of plasma-based cryogels were selected for further biological testing since it exhibited better permeability. SEM analysis of the plasma-based cryogels demonstrated that the macropores were found to be in the range of 10–80 μm with pore walls that were thin and smooth, composed of crosslinked proteins (Fig. 2). Thus, the morphology of the pore walls differed significantly from that of the cryogels prepared from blood (Fig. 1 and 2).
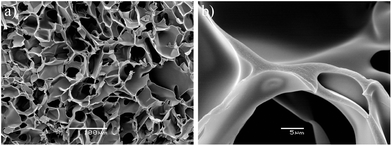 | ||
| Fig. 2 Scanning electron micrographs of cryogel prepared by crosslinking plasma: (a) at low magnification illustrating the macroporous structure and (b) at high magnification illustrating the smooth pore wall surface. | ||
The physical characteristics between blood and plasma cryogels clearly showed that there was a significant difference depending on whether blood or plasma was used. Cryogels based on blood contained approximately twice as much solid content as cryogels from diluted plasma (Table 1). This reflected the difference in composition between blood and plasma, where blood cells contributed to the solid fraction.15 The cryogel formed from blood differed significantly from the plasma cryogel with a much lower swelling and a higher elastic modulus, which most likely was attributed to the composition of proteins and the presence of blood cells. This was in conjunction with the higher solid content present in the blood cryogel compared to the plasma cryogel. It can be noted that the mechanical strength of the undiluted plasma gels (Table 1) was less than the blood-based cryogels even if the solid fraction was more comparable. This was most likely attributed to the blood cells embedded in the pore walls, which improve the mechanical properties of the material.
Cell cultivation: viability, morphology, and differentiation
The blood and plasma cryogels were evaluated for their potential as scaffolds in tissue engineering with the cultivation of C2C12 myoblasts. The C2C12 cells were also placed in a monolayer culture (control culture), which was analysed at the same time points.The number of proliferating cells, analysed with a BrdU assay, increased significantly after two days of culture in a proliferative medium (Fig. 3a). The medium was changed to a differentiation medium on day 3 with no noticeable change in the number of proliferating cells for the cryogel constructs between day 3, day 7 and day 14. Cell viability was tested on day 1, day 7, and day 14 with an XTT assay that measures the activity of mitochondrial enzymes in live cells.32 A significantly higher viability after 7 and 14 days of culture compared to 1 day (Fig. 3b) was noted, indicating that the increased number of cells were viable and active.
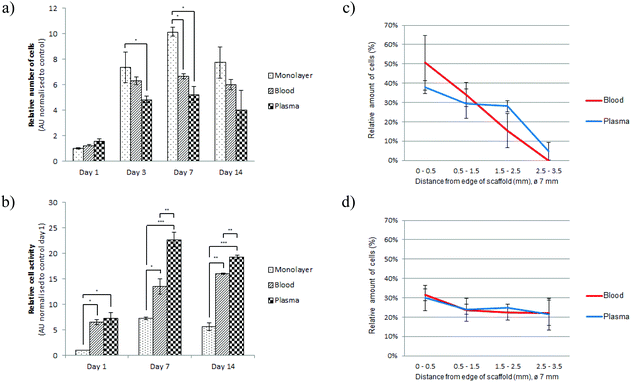 | ||
| Fig. 3 (a) Cell proliferation was measured by a BrdU assay and carried out on day 1, 3, 7 and 14. (b) Cell viability was measured by an XTT assay and carried out on day 1, 7 and 14. Each value represents the mean ± SEM of 4 samples and presented as arbitrary unit (AU) normalised to control cultures (monolayer – day 1). Statistical significance: *p < 0.05, **p < 0.01, ***p < 0.001. Significance between each time point was also analysed (not presented in the graphs). (a) Statistical significance was found for all groups between day 1 and 3. (b) Statistical significance was found for all groups between day 1 and 7, and between day 1 and 14. The cell distribution was evaluated after 2 days (c) and 14 days (d) by dividing the constructs into four areas between the edge and the centre. No significant difference was found between the groups. | ||
We next analysed the cell distribution between the two groups of scaffolds. There was no significant difference, although the blood scaffold seemed to have a larger proportion of cells at the very edge compared to the plasma scaffold after 2 days of culture (Fig. 3c). Initially a majority of the cells were distributed closer to the edge of the construct for both groups, while after 14 days of culture the cells were more evenly distributed throughout the constructs (Fig. 3d). The same observation was made in the z-axis, analysing sections of scaffold constructs from top to bottom (data not shown).
The SEM micrographs further confirmed that the cells had attached and migrated into the cryogels. On the surface of the cryogel constructs the myoblasts were stretched out and formed a layer on the cryogels (Fig. 4). Most cells found inside the cryogel scaffolds had an elongated morphology organised parallel to each other.
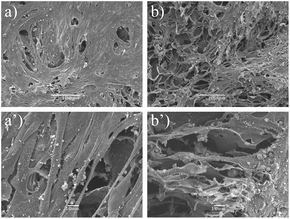 | ||
| Fig. 4 SEM micrographs of myoblasts cultured on (a) blood and (b) plasma cryogels. The cryogel constructs had been cultured for 14 days. The upper lane illustrates myoblasts on the surface of the constructs (a, b). Scale bars equal 100 μm. The lower lane illustrates the inside of the constructs (a′, b′). Scale bars equal 10 μm. | ||
The gene expression level of transcription factors MyoD1 and myogenin was investigated at an early time point (2 days) and a late time point (14 days). After two days of culture, the cells in the cryogel constructs expressed more MyoD1 mRNA than myogenin mRNA (Fig. 5a). This was expected as the expression of myogenin is only up-regulated late in the differentiation process. After 14 days of culture, the myogenin mRNA levels had increased (Fig. 5b), which confirmed that the cells cultured on the two types of cryogels were undergoing myogenic differentiation. Immunofluorescent stainings were carried out to visualise the expression of myogenic markers at the protein level (Fig. 6). MyoD1, which has been found to be essential for initiating myoblast fusion,33,34 was only expressed in a few of the cells after 14 days of culture. In contrast, myogenin, involved in the terminal differentiation of myoblasts,33,34 was expressed in most cells. Myosin, an ATP dependent motor protein (detected with antibody MF20 that recognises the heavy chain of myosin35), was expressed in approximately half of the cells and it was clearly seen that these cells were fused myoblasts with several nuclei. No apparent difference in protein expression was noted between the two different cryogels. Moreover, double staining using an antibody against the transmembrane protein β-dystroglycan and the extracellular matrix protein laminin α2 chain illustrated that the myoblasts had produced extracellular matrix in the form of laminin that co-localised with its receptor dystroglycan.
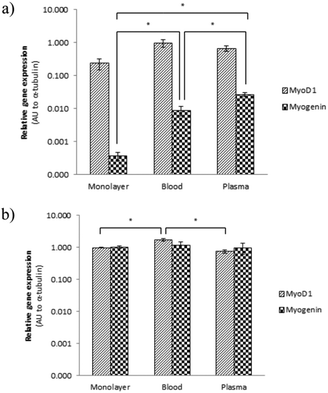 | ||
| Fig. 5 MyoD1 and myogenin gene expression was evaluated after (a) 2 days and (b) 14 days of culture by quantitative real-time PCR. Each value represents the relative expression mean ± SEM to α-tubulin of 4 samples and normalised to a control sample from a monolayer cultured for 14 days. Arbitrary unit (AU) on a logarithmic scale. | ||
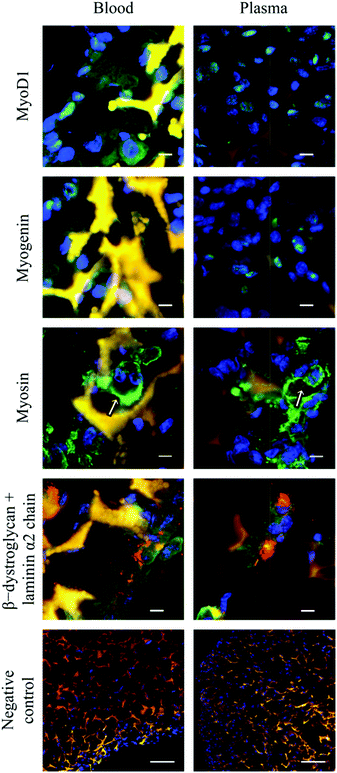 | ||
| Fig. 6 Immunofluorescence micrographs demonstrating expression of MyoD1 (green), myogenin (green), myosin (green), β-dystroglycan (green), and laminin α2 chain (red) in myoblasts cultured for 14 days on blood and plasma cryogels. Sections were counterstained with DAPI (nuclear dye, blue). All cryogels were autofluorescent at wavelengths of around 488 nm (green) and 546 nm (red), which gave rise to an orange-like colour when merged. Arrows indicate cells with several nuclei. Negative controls, presented at a lower magnification to illustrate cell distribution, were incubated with the secondary antibody only. Scale bars on rows 1–4 equal 10 μm, and 100 μm on row 5 (negative control). | ||
Additionally, β-dystroglycan was localised around the nuclei. Despite being a transmembrane protein, it has been demonstrated that C2C12 myoblasts express β-dystroglycan inside the cells as well as in the plasma membrane.36 To analyse whether the produced laminin α2 chain is a constituent of a heterotrimeric molecule composed of α, β and γ chains,37 we performed a double labelling using antibodies against the laminin α2 chain and the laminin γ1 chain. Indeed, the laminin γ1 chain was found to be localised in the same regions as the laminin α2 chain (data not shown). The expression of desmin, an intermediate filament that links the sarcomeres, organelles and plasma membranes,38 was also evaluated by immunofluorescence (data not shown) and found to be expressed homogenously in cells cultured on both scaffolds.
Western blot analyses further confirmed a myogenic phenotype of cells cultured for 2 and 14 days on the blood and plasma cryogels. Both desmin and β-dystroglycan were expressed after 2 days of culture with increased levels after 14 days (ESI Fig. S1†).
Finally, the scaffolds prepared with mouse blood and plasma, respectively, were allotransplanted into mouse quadriceps. The histology indicated that both scaffolds were still present after two weeks and filled with mononucelated cells seen by the staining of nuclei (Fig. 7). After 4 weeks, both scaffolds had disappeared and were replaced with regenerated muscular tissue identified as fibres with centrally located nuclei (Fig. 7). An early immune response could be seen with the presence of mononuclear cells (stained with anti-CD68) and positive staining for fibrous tissue (tenascin-C), but disappeared with time (ESI Fig. S2†).
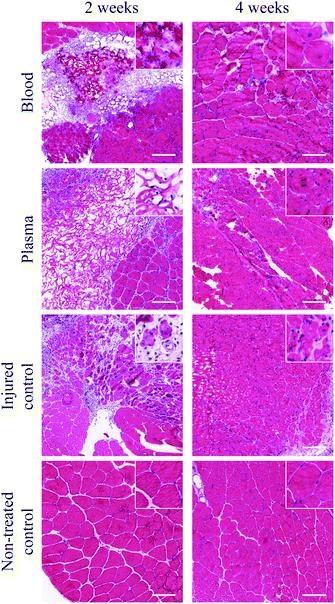 | ||
| Fig. 7 Histology (stained with haematoxylin and eosin) of transplanted scaffolds into mouse quadriceps muscles. The upper right corner illustrates scaffold area/tissue at a 10× higher magnification. Scale bars equal 50 μm. | ||
Discussion
Blood and plasma cryogels were successfully formed with glutaraldehyde as a crosslinking agent and created highly macroporous scaffolds that were evaluated in vitro and in vivo. Both blood and plasma were diluted with PBS to achieve a lower concentration of proteins suitable for the crosslinking reaction. Physical properties were found to differ between the cryogels. The blood-based cryogel had a higher solid fraction and a much higher elastic modulus compared to the plasma-based cryogel. On the other hand, the plasma cryogel had a higher swelling degree compared to the blood cryogel. The inner walls of the blood cryogel had an uneven surface due to the presence of blood cells, while the plasma-based cryogel had smooth inner walls.We decided to use blood and plasma cryogels for further in vitro evaluation. Both were found to be suitable as scaffolds for myoblast culture and differentiation. The cells proliferated over the first 3 days during the expansion phase shown with the BrdU assay. The XTT data corresponded well with the proliferative data, showing that with an increasing number of proliferating cells, there was also an increasing number of active cells. Between day 7 and day 14 the cells remained at a constant level, demonstrating that the cells stayed alive and active for the whole culture period. Furthermore, the cryogels supported the myogenic phenotype during the differentiation phase when the myoblasts were cultured in differentiation medium. Gene and protein expression demonstrated that the myoblasts had entered the differentiation process. It was surprising that the blood cryogels did not show a greater difference in cell response compared to the plasma-based cryogels. Surface chemistry, topography, stiffness and architecture of the material are known factors that influence the behaviour and phenotype of cells7,19,20 and were clearly different between the scaffolds. Only a small difference was seen in gene and protein expression at the different time points. Cells cultured on the blood-based cryogel had a higher gene expression of MyoD1 after 14 days of culture, but there was no difference in the expression of myogenin. Compared to control cultures (monolayer), both of the cryogel constructs either had a similar expression level or a significantly higher level of myogenic markers. Myoblast fusion is a complicated multi-step process where several parameters play a role, including the culture medium, the 3D environment, and inter-cellular signaling.38 Key transcription factors known to be present during the myogenic differentiation process, such as MyoD1 and myogenin, were expressed in cells cultured on both cryogel constructs. Moreover, multi-nucleated cells with myosin expression were found in all samples, which further indicated that the cells were committed to the myogenic differentiation program. Also the increased expression of desmin, which is essential for the differentiation process,37,38 and β-dystroglycan, which is important for muscle function,26,27 demonstrated that both blood- and plasma-based cryogels are suitable for skeletal muscle tissue engineering by supporting the myogenic phenotype and promoting myoblast fusion.
In order to evaluate biocompatibility and the ability of the scaffolds to promote skeletal muscle regeneration, we next decided to allotransplant the blood and plasma cryogels into the quadriceps muscle of mice. Although an inflammatory response was seen initially, it appeared to be less compared to the injured controls where the removed muscle was not replaced with any scaffold and instead a fibrous tissue was seen to a larger extent. This suggests that the scaffolds improved the healing capacity.
Conclusions
To conclude, two systems based on blood or plasma were developed for use in tissue engineering applications. It was demonstrated that blood can be used to produce a macroporous scaffold material, either as it is or as the plasma phase of blood. Blood derived from a patient could therefore potentially be used for easy and cost efficient production of a scaffold with the cryogelation technique described to produce a completely autologous system. Cells, isolated from a biopsy taken from the patient, could be cultured on the cryogel scaffold and form a construct that could be transplanted back to the same patient. We have demonstrated that myoblasts cultured on the cryogels based on blood or plasma attached, migrated and proliferated on the materials. The cells maintained their myogenic phenotype and started to organise themselves parallel to each other. The cells expressed typical markers for myoblasts undergoing differentiation on both mRNA and protein levels. In vivo studies showed promising results where both types of scaffolds degraded and were replaced with regenerated skeletal muscle fibres. There is on-going work aimed at creating a macroporous structure with directed pores along one axis to make the scaffolds even more suitable for skeletal muscle tissue engineering.Acknowledgements
We thank R. Wallén for help with sample preparation and assistance at the scanning and transmission electron microscopes; Cibely Fontes Oliveira and Zandra Körner for help with blood collection; Dr T. Sasaki for gifts of reagents and Dr J. Holmberg for valuable comments on the manuscript. This work was financially supported by the Swedish Research Council (VR).References
- A. P. Hollander, S. C. Dickinson, T. J. Sims, P. Brun, R. Cortivo, E. Kon, M. Marcacci, S. Zanasi, A. Borrione, C. D. Luca, A. Pavesio, C. Soranzo and G. Abatangelo, Tissue Eng., 2006, 12, 1787–1798 CrossRef CAS.
- R. Langer, J. P. Vacanti, C. A. Vacanti, A. Atala, L. E. Freed and G. Vunjak-Novakovic, Tissue Eng., 1995, 1, 151–161 CrossRef.
- L. A. Culp, Curr. Top. Membr. Trans., 1978, 327–396 Search PubMed.
- M. Lydon, T. Minett and B. Tighe, Biomaterials, 1985, 6, 396–402 CrossRef CAS.
- T. Masuko, N. Iwasaki, S. Yamane, T. Funakoshi, T. Majima, A. Minami, N. Ohsuga, T. Ohta and S. I. Nishimura, Biomaterials, 2005, 26, 5339–5347 CrossRef CAS.
- J. W. Lapworth, P. V. Hatton, R. L. Goodchild and S. Rimmer, J. R. Soc. Interface, 2012, 9, 362–375 Search PubMed.
- M. Levy-Mishali, J. Zoldan and S. Levenberg, Tissue Eng. Part A, 2009, 15, 935–944 Search PubMed.
- S. Ibusuki, Y. Fujii, Y. Iwamoto and T. Matsuda, Tissue Eng., 2003, 9, 371–384 CrossRef CAS.
- L. E. Freed, J. C. Marquis, A. Nohria, J. Emmanual, A. G. Mikos and R. Langer, J. Biomed. Mater. Res., 1993, 27, 11–23 CrossRef CAS.
- H. Keshaw, N. Thapar, A. J. Burns, N. Mordan, J. C. Knowles, A. Forbes and R. M. Day, Acta Biomater., 2010, 6, 1158–1166 Search PubMed.
- Y. Stark, K. Suck, C. Kasper, M. Wieland, M. van Griensven and T. Scheper, Exp. Toxicol. Pathol., 2006, 57, 305–311 Search PubMed.
- K. A. Blackwood, R. McKean, I. Canton, C. O. Freeman, K. L. Franklin, D. Cole, I. Brook, P. Farthing, S. Rimmer, J. W. Haycock, A. J. Ryan and S. MacNeil, Biomaterials, 2008, 29, 3091–3104 CrossRef CAS.
- A. F. Hill, S. Joiner, J. Linehan, M. Desbruslais, P. L. Lantos and J. Collinge, Proc. Natl. Acad. Sci. U. S. A., 2000, 97, 10248–10253 Search PubMed.
- M. Bláha, P. Měřička, V. Štěpánová, M. Špliňo, J. Malý, L. Jebavý, P. Žák, M. Cermanová, S. Filip, M. Blažek and V. Řeháček, Folia Microbiol., 2006, 51, 609–613 Search PubMed.
- A. Faller, M. Schünke and G. Schünke, in The Human Body, ed. E. Taub, Georg Thieme Verlag, Stuttgart, New York, 13th edn, 2004, pp. 259–306 Search PubMed.
- E. Carletti, A. Motta and C. Migliaresi, Methods Mol. Biol., 2011, 695, 17–39 CrossRef CAS.
- S. Chung and M.W. King, Biotechnol. Appl. Biochem., 2011, 58, 423–438 Search PubMed.
- V. Karageorgiou and D. Kaplan, Biomaterials, 2005, 26, 5474–5491 CrossRef CAS.
- C. M. Murphy and F. J. O'Brien, Cell Adhes. Migr., 2010, 4, 377–381 Search PubMed.
- M. B. Keogh, F. J. O'Brien and J. S. Daly, Acta Biomater., 2010, 6, 4305–4313 CrossRef CAS.
- D. N. Rockwood, E. S. Gil, S.-H. Park, J. A. Kluge, W. Grayson, S. Bhumiratana, R. Rajkhowa, X. Wang, S. J. Kim, G. Vunjak-Novakovic and D. L. Kaplan, Acta Biomater., 2011, 7, 144–151 Search PubMed.
- S. Concaro, E. Nicklasson, L. Elowsson, A. Lindahl, M. Brittberg and P. Gatenholm, J. Tissue Eng. Regen. Med., 2008, 2, 14–21 Search PubMed.
- J. J. Norman and T. A. Desai, Tissue Eng., 2005, 11, 378–386 CrossRef.
- L. Tsang Valerie, A. Chen Alice, M. Cho Lisa, D. Jadin Kyle, L. Sah Robert, S. DeLong, L. West Jennifer and N. Bhatia Sangeeta, FASEB J., 2007, 21, 790–801 CrossRef.
- D. Berillo, L. Elowsson and H. Kirsebom, Macromol. Biosci., 2012, 12, 1090–1099 Search PubMed.
- V. I. Lozinsky, I. Y. Galaev, F. M. Plieva, I. N. Savina, H. Jungvid and B. Mattiasson, Trends Biotechnol., 2003, 21, 445–451 CrossRef CAS.
- S. Bhat, A. Tripathi and A. Kumar, J. R. Soc. Interface, 2011, 8, 540–554 Search PubMed.
- T. Dispinar, W. Van Camp, L. J. De Cock, B. G. De Geest and F. E. Du Prez, Macromol. Biosci., 2012, 12, 383–394 Search PubMed.
- Y. Hwang, N. Sangaj and S. Varghese, Tissue Eng. Part A, 2010, 16, 3033–3041 Search PubMed.
- K. Gawlik, Y. Miyagoe-Suzuki, P. Ekblom, S. Takeda and M. Durbeej, Hum. Mol. Genet., 2004, 13, 1775–1784 Search PubMed.
- M. B. Dainiak, I. U. Allan, I. N. Savina, L. Cornelio, E. S. James, S. L. James, S. V. Mikhalovsky, H. Jungvid and I. Y. Galaev, Biomaterials, 2010, 31, 67–76 CrossRef CAS.
- D. A. Scudiero, R. H. Shoemaker, K. D. Paull, A. Monks, S. Tierney, T. H. Nofziger, M. J. Currens, D. Seniff and M. R. Boyd, Cancer Res., 1988, 48, 4827–4833 CAS.
- Y. W. Eom, J. E. Lee, M. S. Yang, I. K. Jang, H. E. Kim, D. H. Lee, Y. J. Kim, W. J. Park, J. H. Kong, K. Y. Shim, J. I. Lee and H. S. Kim, Biochem. Biophys. Res. Commun., 2011, 408, 167–173 Search PubMed.
- H. Li, S. K. Choudhary, D. J. Milner, M. I. Munir, I. R. Kuisk and Y. Capetanaki, J. Cell Biol., 1994, 124, 827–841 Search PubMed.
- C. Reggiani, R. Bottinelli and G. J. Stienen, News Physiol. Sci., 2000, 15, 26–33 Search PubMed.
- R. González-Ramírez, S. L. Morales-Lázaro, V. Tapia-Ramírez, D. Mornet and B. Cisneros, J. Cell. Biochem., 2008, 105, 735–745 Search PubMed.
- M. Durbeej, Cell Tissue Res., 2010, 339, 259–268 CrossRef CAS.
- Z. L. Li and D. Paulin, J. Biol. Chem., 1991, 266, 6562–6570R Search PubMed.
Footnote |
| † Electronic supplementary information (ESI) available. See DOI: 10.1039/c2bm00054g |
| This journal is © The Royal Society of Chemistry 2013 |