Ice recrystallisation inhibition by polyols: comparison of molecular and macromolecular inhibitors and role of hydrophobic units†
Robert C.
Deller
ab,
Thomas
Congdon
a,
Mohammed A.
Sahid
a,
Michael
Morgan
a,
Manu
Vatish
c,
Daniel A.
Mitchell
c,
Rebecca
Notman
a and
Matthew I.
Gibson
*a
aDepartment of Chemistry, University of Warwick, Gibbet Hill Road, Coventry, CV4 7AL, UK. E-mail: m.i.gibson@warwick.ac.uk; Fax: +44 (0) 2476 524112
bMolecular Organisation and Assembly in Cells (MOAC) Doctoral Training Centre, University of Warwick, CV4 7AL, Coventry, UK
cClinical Sciences Research Laboratories, University of Warwick, Clifford Bridge Road, Coventry, CV2 2DX, UK
First published on 22nd January 2013
Abstract
The ability of polyols to act as ice recrystallisation inhibitors (IRI), inspired by antifreeze (glyco)proteins are studied. Poly(vinyl alcohol), PVA, a known IRI active polymer was compared to a panel of mono and polysaccharides, with the aim of elucidating why some polyols are active and others show no activity. When corrected for total hydroxyl concentration all the carbohydrate-based polyols displayed near identical activity with no significant influence of molecular weight. Conversely, PVA was several orders of magnitude more active and its activity displays significant dependence on molecular-weight implying that its mechanism of action is not identical to that of carbohydrates. In a second step, the role of hydrophobicity was studied and it is observed that monosaccharide IRI activity is enhanced by alkylation. Dye-quenching assays demonstrated that PVA is able to present a hydrophobic surface without self-aggregation. Therefore, the ability to present a hydrophobic domain is hypothesised to be essential to obtain high IRI activity, which has many biotechnological applications.
Introduction
The development of technologies that inhibit or prevent the growth of ice is a key challenge facing modern science.1–3 In particular, new additives that improve both the long and short-term cryostorage of human cells, tissues and organs are required to meet the ever increasing demands of transplantation and regenerative therapies.4–7 Traditional cryopreservation strategies rely on vitrification (a process of rapid cooling that suppresses the formation of ice crystals) that requires very high cooling rates, substantial amounts of cryopreservative and is unsuitable for large sample volumes.8–11 Furthermore vitrification requires the use of organic solvents at high concentrations that often have associated cytotoxicity at physiologically relevant temperatures.12 Such cryoprotectants are also challenging to remove post thaw; a process which is incompatible with most clinical requirements.13,14 Analysis of the cryopreservation process, however, shows that extensive cell damage actually arises during the thawing process whereby small ice crystals grow in size in a process known as ice recrystallisation (IR), a form of Ostwald ripening.15,16 Antifreeze (glyco)proteins (AF(G)Ps)17 that have arisen by convergent evolution in polar fish species18 have been shown to be highly potent ice recrystallisation inhibitors (IRIs).19 The extraction and purification of AF(G)Ps in commercially viable quantities has had limited success and transgenic approaches are complicated by the essential glycosylated unit.20,21 The total chemical synthesis of AF(G)Ps is also extremely challenging, with few successful synthetic strategies reported.22,23 Studies have also indicated AF(G)Ps to be cytotoxic24 and the introduction of non-native proteins may cause significant immunogenicity issues limiting their widespread application.25,26 Furthermore, the use of functionally similar antifreeze proteins (AFPs) for the cryopreservation of human erythrocytes resulted in increased cell death at higher AFP concentrations due to the secondary effect of dynamic ice shaping (DIS)27 (and thermal hysteresis, TH)28 a property also exhibited by AF(G)Ps. Attempts at using AF(G)Ps as cryoprotectants have also failed to yield notable benefit in the cryopreservation of rat cardiac tissue.29,30 However marginal benefits were observed with an AF(G)P analogue in improving the cryopreservation of rat islet cells.31Considering the above, the design of (scalable) synthetic mimics capable of reproducing the desirable IRI properties but without the potential toxicological and immunological side effect has attracted significant interest.32 Previous work, in particular that of Ben et al.,22,33–38 has focused on making small glycopeptide mimics that have alternative glycoside linkages as well as simpler monosaccharide moieties. These glycopeptides have definite IRI activity, without unwanted TH/DIS but are still challenging to synthesise and only available in small quantities.33,39,40 Gibson et al. have shown that some synthetic polymers can display significant IRI activity which is appealing due to their scalable syntheses and highly tunable structure.41,42 Poly(vinyl) alcohol (PVA) in particular displays significant IRI activity at micromolar concentrations16,41,43 and is strongly molecular-weight dependant. This is remarkable considering the lack of structural similarities to native AF(G)Ps. It has also recently been shown that at relatively high concentrations monosaccharides and disaccharides, which are essentially polyols, also have measurable, if weak, IRI activity. This was tentatively linked to their hydration index;35 the number and density of water molecules associated with a saccharide. It is hypothesised that this ordering of water molecules disrupts the quasi-liquid layer (QLL) at the ice–water interface preventing the exchange of water molecules and hence ice crystal growth.34 This concept, however, does not explain the high IRI activity of PVA, and in particular its molecular-weight dependence as the density of water molecules per monomer unit will not vary with chain length. Recent work has identified that carbohydrate-based surfactants have measurable IRI activity below their critical micelle concentration and analysis of several AF(G)Ps has shown them all to have hydrophobic domains. Therefore, an additional contributor to IRI activity would seem to be the repulsion of water molecules from an inhibitor bound/associated with the ice–water interface.36,44 The aim of this study was to undertake a comparative investigation of PVA and a panel of carbohydrate-based polyols to determine if their IRI activities are linked by the same mechanism of action, with a view to gaining a greater understanding of the IRI mechanism. The role of hydrophobicity/amphiphilicity is also studied through chemical modification of monosaccharides. This will aid in the rational design of even more IRI active compounds as potential cryoprotectants.
Results and discussion
To assess IRI activity a modified splat assay was used. Briefly, a poly-nucleated ice wafer made up of ice crystals with diameters <10 μm is annealed at −6 °C for 30 minutes before being photographed between crossed polarisers. This method separates nucleation from growth process, the latter being of interest here. To assess the degree of recrystallisation (growth) the mean largest grain size (MLGS) is measured from three individual wafers and expressed relative to the crystal size obtained from a PBS control. It is important to note this measurement is slightly different from measuring the average grain area, which inevitably gives lower percentage values (due to decreases in size scaling with radius2), but has the advantage of measuring all samples.37Fig. 1 shows example micrographs of ice crystal wafers grown from PBS solution alone, with a strong inhibitor (PVA 9 kDa) and an extremely weak inhibitor (poly(ethylene glycol), PEG, 8 kDa). The ice crystals obtained using PVA are clearly far smaller than when PBS or PEG are used, highlighting the desirable, but poorly understood RI properties of PVA.
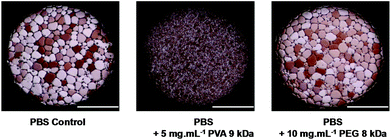 | ||
| Fig. 1 Micrographs of poly-nucleated ice crystals after 30 minutes annealing at −6 °C (scale bars = 500 μm). | ||
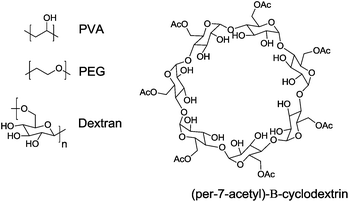 | ||
| Scheme 1 Chemical structure of oligo/polymeric compound used in this study. | ||
Quantitative concentration-dependant IRI activity of several water soluble polymers were measured and shown in Fig. 2 and Scheme 1. As previously discussed, PEG showed no activity that might suggest that hydroxyl groups are essential for activity. This has previously been demonstrated for thermal hysteresis and dynamic ice shaping by AF(G)Ps, but does not prove hydroxyls are an essential feature in all IRI active compounds. The glucose-based polysaccharides dextran and acetyl-β-cyclodextrin were also evaluated for IRI but surprisingly showed very weak activity compared to PVA in the concentration range tested, which implies that presentation of multiple hydroxyl groups does not guarantee that a polymer will have potent IRI properties. This is in agreement with our earlier work using synthetic glycopolymers with pendant monosaccharides that had weak, but measurable, IRI properties.42
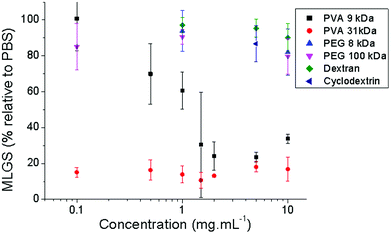 | ||
| Fig. 2 Ice recrystallisation inhibition activity of polymers. MLGS = mean largest grain size relative to phosphate buffered saline control. Error bars represent the standard deviation from the mean. | ||
The above data highlights the lack of understanding about the structural features essential for IRI activity and the challenge associated with the design and application of novel RI active compounds – put simply very few tested materials display any activity. Previous work has suggested precisely spaced hydroxyl groups are essential for interactions with the ice lattice, and hence RI activity.45,46 However, for carbohydrates the hydration index has also been implicated suggesting the local ordering of water, not ice-binding, is crucial. This argument holds for monosaccharides, but fails for disaccharides which have increased IRI activity, but lower hydration indices.38 Furthermore, the hydration index does not explain the anomalously high activity of PVA compared to all polysaccharides. With a view to understanding this process a panel of discrete low-molecular weight poly-hydroxylated compounds were selected and screened for IRI activity to establish structure–property relationships. Fig. 3 summarises the IRI activity in terms of molar concentration for these compounds. For comparison, each panel shows compounds of similar molecular weight; di/tri-ols, monosaccharides, disaccharides and oligosaccharides, plotted across the concentration range 0–1 mol L−1 for all samples for comparative purposes.
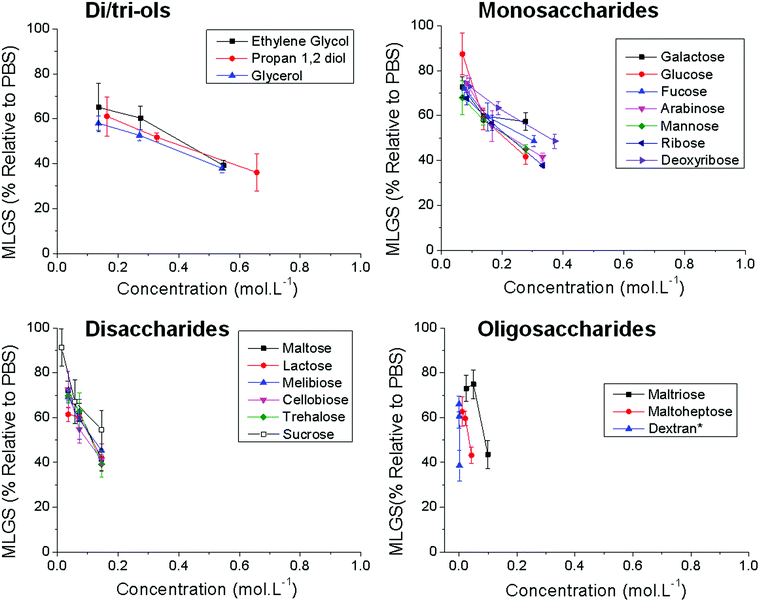 | ||
| Fig. 3 Ice recrystallisation inhibition activity of mono/oligo-saccharides. *The molar concentration of Dextran (∼40 kDa) can only be approximated due to the uncertainties in the molecular weight and molecular weight distribution. Error bars represent the standard deviation from the mean. | ||
On a molar basis, there is clear correlation between increased activity and higher molecular weight. It should be noted that deliberately high concentrations of these compounds were necessary to enable this analysis due to their relatively weak activity. Even higher concentrations lead to melting due to a lowering of the colligative freezing point and could not be tested. While interesting, this molar analysis is not a fair comparison when comparing compounds of difference valency (i.e. number of OH groups) which may benefit from a multivalent enhancement due to clustering effects, similar to for example carbohydrate recognition proteins.47,48 In multivalent systems, data is normally presented as a function of the total number of ligands (in this case hydroxyls). To probe the relative activity of each hydroxyl group, the same data was plotted as a function of the total concentration of OH groups in solution, Fig. 4. Rather remarkably, this analysis showed that all the low molecular weight compounds had near identical activity (within the sensitivity limits of the assay, which cannot detect the minor differences due to stereochemistry but can be resolved with domain recognition software, which is outside of the scope of this manuscript).37 So, for example, sucrose has essentially the same activity as 2 glucose equivalents. This effectively rules out a multivalent-type host–ligand interaction and would appear to suggest that the total mass of carbohydrate present at the ice surface is the key factor. This would most likely occur by ordering of water molecules in the QLL and thus preventing ice crystal growth and diffusion of water molecules as proposed by Ben et al.35 The larger saccharides (cyclodextrin with 9 units) agree with this trend also indicating that an oligomeric structure does not necessarily lead to any enhancement in activity (excluding the benefit of lower molar considerations on osmotic pressure in a cryopreservation application).
![Ice recrystallisation inhibition activity of mono/oligosaccharides expressed in terms of [OH]. PVA 31 kDa data is circled for comparison.](/image/article/2013/BM/c3bm00194f/c3bm00194f-f4.gif) | ||
| Fig. 4 Ice recrystallisation inhibition activity of mono/oligosaccharides expressed in terms of [OH]. PVA 31 kDa data is circled for comparison. | ||
Compared to the activity of the (oligo)saccharides shown in Fig. 4, PVA is significantly more active. At 0.01 mol OH/L PVA (31 kDa) gives an MLGS of ∼20% relative to PBS whereas all the carbohydrates have lost activity at this point. This implies there are unique features in its structure that give rise to its activity and that simple consideration of the number or density of hydroxyl groups is insufficient. This also suggests that hydration alone is not the only contributor to IRI activity and is not a suitable parameter for predicting IRI. A brief analysis of highly active antifreeze proteins reveals that they all have hydrophobic domains, which could act to repel water molecules once the protein is bound to the surface/immobilised in the QLL.42 The monosaccharides tested do not possess large hydrophobic surfaces and cannot easily rearrange the orientation of the hydroxyl groups due to their conformationally restricted cyclic structure. The contribution of hydrophobic components is supported by a recent report indicating that alkylated carbohydrate-based surfactants have measurable IRI activity.36 To probe the role of hydrophobicity we synthesised a series of anomeric position-modified monosaccharides by Fischer glycosidation, Scheme 2. Fischer glycosidation gives rise to a mixture of products (both α and β), but is useful due to its scalability and simple purification that aids throughput. Following isolation, all compounds were identified by mass spectrometry and NMR.
 | ||
| Scheme 2 Fischer glycosidation of monosaccharides. | ||
This series of mono-substituted glucosides, and commercially available octyl glucoside, were screened for activity, Fig. 5. It should again be highlighted here that these molecules are intrinsically weak IRI's. Upon addition of increasingly hydrophobic groups (methyl, ethyl, octyl) there was a small decrease in the MLGS from 72 to 62% relative to PBS. Ethyl and allyl substituents (2 and 3 carbons) had identical activity within the sensitivity of the testing protocol. It should be noted that the alkylated carbohydrates also have 1 less hydroxyl group than glucose, which according to Fig. 2/3, would be expected to lead to a slight decrease in activity. Compared to arabinose (4 hydroxyl groups, 74% MLGS relative to PBS) the alkylated glucose derivatives appear to be more active (4 hydroxyl groups, 62% MLGS for Glu-Oct). This apparently disagrees with the trend shown in Fig. 4, which would suggest that if there is an equal concentration of hydroxyl's, then IRI should be approximately identical. Hence, it would appear that introducing hydrophobicity is a method to attenuate IRI activity and that there are multiple structural features which can contribute to this effect. Representations of the molecules in terms of hydrophilic/hydrophobic domain are also shown in Fig. 5 to illustrate the relative hydrophobic (blue) to hydrophilic (red) within each molecule (see Experimental section for computational details).
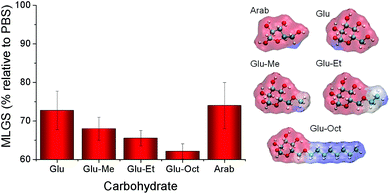 | ||
| Fig. 5 Ice recrystallisation inhibition activity of carbohydrates and alkylated derivatives at 100 mM concentration. Glu = glucose; Arab = arabinose. Molecular structures (shown in “ball and stick” representation) and surface hydrophobicity. Carbon atoms are coloured cyan, hydrogen atoms white and oxygen atoms red. The molecular hydrophobicity potential on the Van der Waals surface is coloured from red (hydrophilic) to blue (hydrophobic). Error bars represent the standard deviation from the mean. Note y-axis does not start at zero due to small differences in activity. | ||
As the data shown in Fig. 5 is not strictly statistically significant, the concentration dependence on the glucose-derivatives was measured revealing the same trend of the hydrophobic groups giving a decrease in the MLGS at any given concentration. Similarly, mannose and ethyl-mannose were compared, with the ethyl-derivative showing higher activity than free mannose. These changes are rather small though, and each individual value is not statistically significant, but still presents a useful tool to aid understanding of IRI activity in our opinion.
Taken together the data presented above suggest that polyols do have measurable IRI activity and implies that the ability to order a large number of water molecules (via hydrogen bonding, and total number [OH]) does contribute to IRI activity as previously suggested.35 However, the addition of hydrophobic residues, at the expense of hydroxyl groups, may enhance activity and may be the dominant factor in the activity of native proteins. Several AFPs, without any glycosylation sites, actually have charged hydrophilic surfaces49 but do retain a significant hydrophobic domain and therefore would not be expected to function in the same manner as polyols. A lipo-polysaccharide has been identified from Upis ceramboides (Alaskan beetle) with potent antifreeze activity which appears to require the hydrophobic lipid for activity, which also supports our hypothesis.50
As the key aim of this work was to understand the anomalously high activity of PVA, compared to polysaccharides, an experiment was devised to probe if it has hydrophobic character based on a dye inclusion assay, which is commonly used to determine block-copolymer self assembly in water.51 Diphenyl hexatriene is an organic dye, which only fluoresces in hydrophobic environments, and is sparingly soluble in water. An aqueous solution of DPH was prepared and PVA, dextran and PEG titrated into this solution with vigorous mixing. The fluorescence emission at 460 nm was measured (excitation at 360 nm) as a function of polymer concentration and shown in Fig. 6. For both PEG and dextran there was no increase in fluorescence upon increasing polymer concentration, which indicated they are not able to solubilise the dye directly, or via self-assembly. Conversely, addition of PVA 9 kDa (the least active PVA in this study) above 5 mg mL−1 led to a large and significant increase in fluorescence demonstrating that PVA does indeed form hydrophobic domains. 15 kDa PVA (obtained by controlled radical polymerization, see ESI†) gave similar results, with the inflection point occurring at slightly lower concentrations which might indicate more hydrophobicity. Dynamic light scattering of the polymer solution without dye showed no micelle/aggregate formation. The observation of DPH solubilisation therefore implies that PVA has local regions of hydrophobicity or it is able to reconfigure in response to the guest molecules. We propose that this hydrophobic character is essential for a polymer to display IRI (although other structural features, including hydroxyl groups, no doubt also play a role) and that PVA is rather unique in that it can present this domain without the onset of micellisation/self-assembly which occurs when traditional surfactants are placed in solution.52 PVA is used extensively as a colloidal stabiliser, based on this property. It should also be noted that high molecular weight PVA forms aggregates upon freeze/thaw hence only relatively short PVA was used here.53 More flexible glycopolymers which have low IRI activity therefore might be too conformationally flexible42 to present this hydrophobic domain and hence they have low activity which correlates with the (oligo)saccharides and hydration index. Octyl glucoside, which has a significant hydrophobic domain was far less active that PVA (even though it is more active than e.g. glucose). Above its critical micelle concentration (∼25 mM)54 it does not expose a hydrophobic domain due to self assembly, sequestering the alkyl chain into the core. Therefore the unique feature of PVA appears to be its ability to present hydrophobic domains/faces, either spontaneously or in response to an additive or surface, without self-aggregation/assembly. This also leads to a cautionary note that this dye inclusion assay is only suitable for probing the presence of hydrophobic domains, rather than predicting IRI activity, due to the secondary effect of self assembly. Future work will focus on studying both the solution and ice-bound conformation of PVA and related polymers to elucidate its mechanism of action and to expand upon this theory.
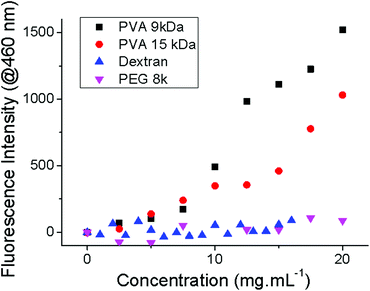 | ||
| Fig. 6 Diphenyl hexatriene inclusion assay. Fluorescence obtained using excitation/emission wavelengths of 360/460 nm. | ||
Conclusions
This report presents initial studies into the role of polyol structure on their ability to inhibit ice recrystallisation. A large series of carbohydrates and low molecular weight compounds presenting multiple hydroxyl groups were evaluated for their IRI activity. It was shown that the IRI activity could be correlated with the total number of hydroxyl groups and that there were only small differences between individual carbohydrates. Polysaccharides also followed this trend. Replacement of anomeric hydroxyl groups with hydrophobic alkyl units resulted in an enhancement in activity, even though the total number of hydroxyl groups was decreased showing that although hydration is important, the presentation of hydrophobic domains is crucial to IRI activity. These results were compared to that for PVA, which is a highly active IRI polymer with no obvious hydrophobic regions. Dye incorporation assays show that PVA was capable of solubilising hydrophobic dyes but without the onset of micellisation, as judged by DLS, providing evidence that it can assume a conformation which present hydrophobic surface and therefore a possible mechanism of action for IRI. These observations will aid the rationale design of new small molecule and macromolecular IRI compounds and also shed light on the fundamental mechanisms of actions of native AF(G)Ps that have many potential biotechnological applications.Experimental section
Materials
Phosphate-buffered saline (PBS) solutions were prepared using preformulated tablets (Sigma-Aldrich) in 200 mL of MilliQ water (>18.2 Ω mean resistivity) to give a buffered pH of 7.4. Dextran (40 kDa (obtained from Leuconostoc spp.)), poly(ethylene glycol) (8 kDa, 100 kDa), poly(vinyl alcohol) (9 kDa (80% hydrolyzed), 31 kDa (98–99% hydrolysed)), 1,6-diphenyl-1,3,5-hexatriene, ethylene glycol, propan-1,2-diol, glycerol, galactose, fucose, glucose, octyl glucopyranoside, fructose, arabinose, mannose, ribose, 2-deoxyribose, maltose, sucrose, lactose, melibiose, cellobiose, trehalose, maltotriose, maltoheptose and acetyl-β-cyclodextrin were purchased from Sigma-Aldrich. All other solvents and reagents were purchased from VWR or Sigma-Aldrich and used without further purification. Ice wafers were annealed on a Linkam Biological Cryostage BCS196 with T95-Linkpad system controller equipped with a LNP95-Liquid nitrogen cooling pump, using liquid nitrogen as the coolant (Linkam Scientific Instruments UK, Surrey, UK).Physical and analytical methods
1H and 13C NMR spectra were recorded on Bruker DPX-300 and DPX-400 spectrometers using deuterated solvents obtained from Sigma-Aldrich. Mass spectral analyses were obtained using Bruker MicroTOF or Bruker MaXis electrospray instruments using positive or negative electrospray mode. The molecular ion and mass fragments are quoted and assigned. Fluorescence spectra were recorded using a Synergy HT multi-mode microplate reader (BioTek UK, Bedfordshire, UK) and clear, flat bottom 96-well plates. Dynamic light scattering was conducted using a Nano-Zs from Malvern Instruments, UK. Scattered light was detected at 173° and the observed count rates recorded. Hydrodynamic radii (where appropriate) were determined using the manufacturer's software. Polymer stock solutions were filtered through 0.45 μm filter before analysis.Graphical representation of surface hydrophobicity
The chemical structures of a selection of molecules (arabinose, glucose, the alkylated glucose derivatives and PVA) were drawn then energy minimised in vacuum using CHARMM force-field parameters. The surface hydrophobicity was calculated using the Platinum web server55 wherein a lipophilicity parameter is assigned to each atom and used to map out the molecular hydrophobicity potential on the van der Waals surface. The images were generated using Visual Molecular Dynamics.56 Note that these models are simply illustrative and by no means claim to represent the global energy minimum structures in solution.Ice recrystallisation inhibition (splat) assay
Ice recrystallisation inhibition was measured using a modified splay assay.43 A 10 μL sample of polymer dissolved in PBS buffer (pH 7.4) was dropped 1.40 m onto a chilled glass coverslip sat on a piece of polished aluminium placed on dry ice. Upon hitting the chilled glass coverslip, a wafer with diameter of approximately 10 mm and thickness 10 μm was formed instantaneously. The glass coverslip was transferred onto the Linkam cryostage and held at −6 °C under N2 for 30 minutes. Photographs were obtained using an Olympus CX 41 microscope with a UIS-2 20×/0.45/∞/0-2/FN22 lens and crossed polarizers (Olympus Ltd, Southend on sea, UK), equipped with a Canon DSLR 500D digital camera. Images were taken of the initial wafer (to ensure that a polycrystalline sample had been obtained) and after 30 minutes. Image processing was conducted using Image J, which is freely available.57 In brief, ten of the largest ice crystals were measured and the single largest length in any axis recorded. This was repeated for at least three wafers and the average (mean) value was calculated to find the largest grain dimension along any axis. The average of this value from three individual wafers was calculated to give the mean largest grain size (MLGS).Measurement of critical micelle concentration
Critical micelle concentration was determined by fluorescence spectrometry using a Synergy HT multi-mode microplate reader (BioTek UK, Bedfordshire, UK). Aqueous 80 μL aliquots of 9 kDa PVA, 40 kDa Dextran and 8 kDa PEG ranging from 0–50 mg mL−1 and 20 μL of 0.01 mg mL−1 DPH were added to a clear flat-bottom 96-well plate and samples incubated at 25 °C for a minimum of 3 minutes. The fluorescence of each sample was then measured with excitation at 360 nm and emission at 460 nm. The critical micelle concentration was defined as the intercept between the two linear regions of the graphs.Synthesis of methyl-glucopyranoside
Concentrated hydrochloric acid (200 μL) was added to a stirred solution of glucose (2.00 g, 11.1 mmol) in methanol (25 mL). The solution was left stirring at room temperature for 18 h, after which sodium carbonate (0.3 g, 2.8 mmol) was added and the solution stirred for 20 min. The solution was filtered and then concentrated in vacuo. The residue was redissolved in methanol (1 mL) and then precipitated into diethyl ether giving a white solid and clear supernatant, which was then decanted after centrifugation. Methyl-glucopyranoside was obtained as a white solid after drying under a high vacuum for 24 h. 1.13 g, 52.7%. 1H-NMR (400 MHz, D2O) 3.40 (s) (CH3O). 13C-NMR (D2O, 100 MHz, 298 K) δ 109.0, 103.1, 95.9, 92.0, 55.8, 55.2. MS (ESI) m/z calculated for C7H14O6 [M + H]+ 195.08 found 195.05.Synthesis of ethyl-glucopyranoside
The same procedure as for methyl-glucopyranoside was used, using ethanol (25 mL) as the reaction solvent. 0.18 g, 7.8% 1H-NMR (400 MHz, D2O) 1.16 (m) (CH3CH2O). 13C-NMR (100 MHz, D2O) δ 107.8, 102.0, 95.9, 92.1, 14.1. MS (ESI) m/z calculated for C8H16O6 [M + Na]+ 231.08 found 231.08.Synthesis of allyl-glucopyranoside
The same procedure as for methyl-glucopyranoside was used, using glucose (0.2 g, 1.1 mmol) and allyl alcohol (3 mL) as the reaction solvent. 0.13 g, 78.3%. 1H-NMR (D2O, 400 MHz) δ 5.90 (m), (CH2CH). MS (ESI) m/z calculated for C9H16O5 [M + Na]+ 243.08 found 243.08.Acknowledgements
Equipment used was supported by the Innovative Uses for Advanced Materials in the Modern World (AM2), with support from Advantage West Midlands (AWM) and part funded by the European Regional Development Fund (ERDF). MIG is a Birmingham Science City Interdisciplinary Research Fellow funded by the Higher Education Funding Council for England (HEFCE). This work was supported by a Research Project Grant from the Leverhulme Trust (RPG-144) and a Research Grant from the Royal Society. RD acknowledges the EPSRC for a studentship from the MOAC Doctoral Training Centre. RN acknowledges the Royal Society for a University Research Fellowship.Notes and references
- J. B. Wareing, IEEE, 1997, 438, v3–v35 Search PubMed.
- R. Carriveau, A. Edrisy, P. Cadieux and R. Mailloux, J. Adhes. Sci. Technol., 2012, 26, 447–461 CAS.
- C. C. Ryerson, Cold Reg. Sci. Technol., 2011, 65, 97–110 CrossRef.
- R. A. Wolfe, E. C. Roys and R. M. Merion, Am. J. Transplant., 2010, 10, 961–972 CrossRef CAS.
- A. Atala, J. Tissue Eng. Regen. Med., 2007, 1, 83–96 CrossRef CAS.
- J. Ringe, C. Kaps, G.-R. Burmester and M. Sittinger, Naturwissenschaften, 2002, 89, 338–351 CrossRef CAS.
- J. O. M. Karlsson and M. Toner, Biomaterials, 1996, 17, 243–256 CrossRef CAS.
- C. Polge, A. U. Smith and A. S. Parkes, Nature, 1949, 164, 666 CrossRef CAS.
- A. Rowe, E. Eyster and A. Kellner, Cryobiology, 1968, 5, 119–128 CrossRef CAS.
- G. M. Fahy, B. Wowk, J. Wu, J. Phan, C. M. Rasch, A. Chang and E. Zendejas, Cryobiology, 2004, 48, 157–178 CrossRef CAS.
- S. Yavin and A. Arav, Theriogenology, 2007, 67, 81–89 CrossRef CAS.
- J. M. Davis, S. D. Rowley, H. G. Braine, S. Piantadosi and G. W. Santos, Blood, 1990, 75, 781–786 CAS.
- K. L. Scott, J. Lecak and J. P. Acker, Transfus. Med. Rev., 2005, 19, 127–142 CrossRef.
- G. B. Quan, Y. Han, M. X. Liu and F. Gao, Cryobiology, 2009, 59, 258–267 CrossRef CAS.
- P. Mazur, Am. J. Physiol., 1984, C125–C142 CAS.
- C. Budke, C. Heggemann, M. Koch, N. Sewald and T. Koop, J. Phys. Chem. B, 2009, 113, 2865–2873 CrossRef CAS.
- A. L. Devries, S. K. Komatsu and R. E. Feeney, J. Biol. Chem., 1970, 245, 2901–2908 CAS.
- L. Chen, A. L. Devries and C. H. C. Cheng, Proc. Natl. Acad. Sci. U. S. A., 1997, 94, 3817–3822 CrossRef CAS.
- C. A. Knight, A. L. Devries and L. D. Oolman, Nature, 1984, 308, 295–296 CrossRef CAS.
- Y. Wu, J. Banoub, S. V. Goddard, M. H. Kao and G. L. Fletcher, Comp. Biochem. Physiol., B: Biochem. Mol. Biol., 2001, 128, 265–273 CrossRef CAS.
- J. W. Larrick and D. W. Thomas, Curr. Opin. Biotechnol., 2001, 12, 411–418 CrossRef CAS.
- B. L. Wilkinson, R. S. Stone, C. J. Capicciotti, M. Thaysen-Andersen, J. M. Matthews, N. H. Packer, R. N. Ben and R. J. Payne, Angew. Chem., Int. Ed., 2012, 51, 3606–3610 CrossRef CAS.
- Y. Tachibana, G. L. Fletcher, N. Fujitani, S. Tsuda, K. Monde and S.-I. I. Nishimura, Angew. Chem., Int. Ed., 2004, 116, 874–880 CrossRef.
- J. Garner and M. M. Harding, ChemBioChem, 2010, 11, 2489–2498 CrossRef CAS.
- A. S. De Groot and D. W. Scott, Trends Immunol., 2007, 28, 482–490 CrossRef CAS.
- H. Schellekens, Clin. Ther., 2002, 24, 1720–1740 CrossRef CAS.
- H. Chao, P. L. Davies and J. F. Carpenter, J. Exp. Biol., 1996, 199, 2071–2076 CAS.
- E. Kristiansen and K. E. Zachariassen, Cryobiology, 2005, 51, 262–280 CrossRef CAS.
- T. Wang, Q. Zhu, X. Yang, J. R. Layne Jr. and A. L. Devries, Cryobiology, 1994, 31, 185–192 CrossRef CAS.
- J. A. Mugnano, T. Wang, J. R. Layne Jr., A. L. Devries and R. E. Lee, Am. J. Physiol., 1995, 269, R474–479 CAS.
- S. Matsumoto, M. Matsusita, T. Morita, H. Kamachi, S. Tsukiyama, Y. Furukawa, S. Koshida, Y. Tachibana, S.-I. I. Nishimura and S. Todo, Cryobiology, 2006, 52, 90–98 CrossRef CAS.
- M. I. Gibson, Polym. Chem., 2010, 1, 1141–1152 RSC.
- S. Liu and R. N. Ben, Org. Lett., 2005, 7, 2385–2388 CrossRef CAS.
- P. Czechura, R. Y. Tam, E. Dimitrijevic, A. V. Murphy and R. N. Ben, J. Am. Chem. Soc., 2008, 130, 2928–2929 CrossRef CAS.
- R. Y. Tam, S. S. Ferreira, P. Czechura, J. L. Chaytor and R. N. Ben, J. Am. Chem. Soc., 2008, 130, 17494–17501 CrossRef CAS.
- C. J. Capicciotti, M. Leclere, F. A. Perras, D. L. Bryce, H. Paulin, J. Harden, Y. Liu and R. N. Ben, Chem. Sci., 2012, 3, 1408–1416 RSC.
- J. Jackman, M. Noestheden, D. Moffat, J. P. Pezacki, S. Findlay and R. N. Ben, Biochem. Biophys. Res. Commun., 2007, 354, 340–344 CrossRef CAS.
- J. L. Chaytor, J. M. Tokarew, L. K. Wu, M. Leclere, R. Y. Tam, C. J. Capicciotti, L. Guolla, E. Moos, C. S. Findlay, D. S. Allan and R. N. Ben, Glycobiology, 2012, 22, 123–133 CrossRef CAS.
- C. Heggemann, C. Budke, B. Schomburg, Z. Majer, M. Wissbrock, T. Koop and N. Sewald, Amino Acids, 2010, 38, 213–222 CrossRef CAS.
- L. Nagel, C. Plattner, C. Budke, Z. Majer, A. L. Devries, T. Berkemeier, T. Koop and N. Sewald, Amino Acids, 2011, 41, 719–732 CrossRef CAS.
- T. Inada and S.-S. Lu, Cryst. Growth Des., 2003, 3, 747–752 CAS.
- M. I. Gibson, C. A. Barker, S. G. Spain, L. Albertin and N. R. Cameron, Biomacromolecules, 2009, 10, 328–333 CrossRef CAS.
- C. A. Knight, J. Hallett and A. L. Devries, Cryobiology, 1988, 25, 55–60 CrossRef CAS.
- A. D. J. Haymet, L. G. Ward and M. M. Harding, J. Am. Chem. Soc., 1999, 121, 941–948 CrossRef CAS.
- C. Budke and T. Koop, ChemPhysChem, 2006, 7, 2601–2606 CrossRef CAS.
- C. P. Garnham, R. L. Campbell and P. L. Davies, Proc. Natl. Acad. Sci. U. S. A., 2011, 108, 7363–7367 CrossRef CAS.
- Y. C. Lee and R. T. Lee, Acc. Chem. Res., 1995, 28, 321–327 CrossRef CAS.
- S.-J. Richards, M. W. Jones, M. Hunaban, D. M. Haddleton and M. I. Gibson, Angew. Chem., Int. Ed., 2012, 51, 7812–7816 CrossRef CAS.
- A. C. Doxey, M. W. F. Yaish, M. Griffith and B. J. McConkey, Nat. Biotechnol., 2006, 24, 852–855 CrossRef CAS.
- K. R. Walters, A. S. Serianni, T. Sformo, B. M. Barnes and J. G. Duman, Proc. Natl. Acad. Sci. U. S. A., 2009, 106, 20210–20215 CrossRef CAS.
- N. Ma, H. Zhang, B. Song, Z. Wang and X. Zhang, Chem. Mater., 2005, 17, 5065–5069 CrossRef CAS.
- R. Zana, Langmuir, 1996, 12, 1208–1211 CrossRef CAS.
- M. Liu, R. Cheng and R. Qian, J. Polym. Sci., Part B: Polym. Phys., 1995, 33, 1731–1735 CrossRef CAS.
- K. Shinoda, T. Yamaguchi and R. Hori, Bull. Chem. Soc. Jpn., 1961, 34, 237–241 CrossRef CAS.
- T. V. Pyrkov, A. O. Chugunov, N. A. Krylov, D. E. Nolde and R. G. Efremov, Bioinformatics, 2009, 25, 1201–1202 CrossRef CAS.
- W. Humphrey, A. Dalke and K. Schulten, J. Mol. Graphics, 1996, 14, 33–38 CrossRef CAS.
- M. Abràmoff, P. Magalhaes and S. J. Ram, Biophotonics Int., 2004, 7, 36–44 Search PubMed.
Footnote |
| † Electronic supplementary information (ESI) available: This includes full characterisation and synthetic details. See DOI: 10.1039/c3bm00194f |
| This journal is © The Royal Society of Chemistry 2013 |
