Nitrogen dioxide at the air–water interface: trapping, absorption, and solvation in the bulk and at the surface
Garold Murdachaew†*ab, Mychel E. Varnerb, Leon F. Phillipsc, Barbara J. Finlayson-Pittsb and R. Benny Gerberab
aInstitute of Chemistry and the Fritz Haber Research Center for Molecular Dynamics, Hebrew University, Jerusalem 91904, Israel
bDepartment of Chemistry, University of California, Irvine, CA 92697, USA
cDepartment of Chemistry, University of Canterbury, Private Bag 4800, Christchurch, New Zealand
First published on 1st November 2012
Abstract
The interaction of NO2 with water surfaces in the troposphere is of major interest in atmospheric chemistry. We examined an initial step in this process, the uptake of NO2 by water through the use of molecular dynamics simulations. An NO2–H2O intermolecular potential was obtained by fitting to high-level ab initio calculations. We determined the binding of NO2–H2O to be about two times stronger than that previously calculated. From scattering simulations of an NO2 molecule interacting with a water slab we observed that the majority of the scattering events resulted in outcomes in which the NO2 molecule became trapped at the surface or in the interior of the water slab. Typical surface-trapped/adsorbed and bulk-solvated/absorbed trajectories were analyzed to obtain radial distribution functions and the orientational propensity of NO2 with respect to the water surface. We observed an affinity of the nitrogen atom for the oxygen in water, rather than hydrogen-bonding which was rare. The water solvation shell was less tight for the bulk-absorbed NO2 than for the surface-adsorbed NO2. Adsorbed NO2 demonstrated a marked orientational preference, with the oxygens pointing into the vacuum. Such behavior is expected for a mildly hydrophobic and surfactant molecule like NO2. Estimates based on our results suggest that at high NO2 concentrations encountered, for example, in some sampling systems, adsorption and reaction of NO2 at the surface may contribute to the formation of gas-phase HONO.
1 Introduction
Nitrogen dioxide is a well-known air pollutant for which air quality standards are set. Photolysis of NO2 is the sole known anthropogenic source of O3 in the troposphere, which is of interest because ozone is also a toxic air pollutant, serves as an oxidant source in the atmosphere, and is a greenhouse gas.1 While the gas phase reactions of NO2 are reasonably well understood, its interactions with water are not. It is known, for example, that NO2 interacts with water on surfaces in the lower atmosphere to generate nitrous acid (HONO).2–6 This is important in air because HONO rapidly photolyzes to form the highly reactive OH radical that drives the chemistry of the atmosphere.1,3 However, despite the importance of this process, the kinetics and mechanisms of the NO2 interaction with water to form HONO are not well understood.One proposed mechanism for HONO formation in the dark involves the heterogeneous hydrolysis of NO2, which stoichiometrically (but certainly not mechanistically) is summarized in eqn (1):
| 2NO2 + H2O → HONO + HNO3. | (1) |
Our objectives were to study the possible adsorption or absorption of an NO2 molecule at the air/water interface and to determine whether such a process is relevant to atmospheric chemistry. Therefore we report here studies of the interaction of NO2 with liquid water through scattering and equilibrium simulations using molecular dynamics (see, e.g., ref. 16–19 for analogous work). For the pairwise interaction of NO2–H2O, we fitted a rigid-monomer non-polarizable intermolecular potential to accurate ab initio NO2–H2O interaction energies obtained using the symmetry-adapted perturbation theory (SAPT) for the intermolecular interactions method. We then selected a suitable H2O–H2O intermolecular potential which is known to correctly describe water structure, hydrogen bond populations, and internal energy, amongst other properties, in both the bulk and at the surface. The SPC/E20 water model fits these requirements at low cost. Both intermolecular potentials can be characterized as effective potentials since the many-body polarization is taken into account by the use of increased values of the dipole moments of H2O and NO2.
The paper is organized as follows. Systems and methods used are described first (Section 2), followed by results (Section 3), implications for atmospheric chemistry (Section 4), and concluding remarks (Section 5).
2 Systems and methods
2.1 Development of the NO2–H2O potential
An initial step was to select a model of water to be used with our NO2–H2O potential in simulations of systems containing multiple water molecules. The SPC/E20 rigid-monomer potential (see Table 1) gives a good and computationally efficient description of bulk and interfacial water. It is of the site–site Lennard-Jones plus electrostatics type, | (2) |
| Site type a | Site type b | qb [au] | ε [kcal mol−1] | σ [Å] |
|---|---|---|---|---|
| a rOH = 1.0 Å and θHOH = 109.47° (the corresponding measured values21 are re,exp = 0.9572 Å, θe,exp = 104.52°). Omitted site–site parameters have a value of zero.b The dipole moments of water with this non-polarizable but effective potential in the gas and in the liquid are the same, μgas = μliq = 2.35 D [the accepted values are μgas = 1.850 D (measured)22 and μliq≈2.65–3 D (estimated23–25 from experiment and ab initio simulation)]. | ||||
| Ow | −0.8476 | |||
| Hw | 0.4238 | |||
| Ow | Ow | 0.155 | 3.166 | |
In calculating the NO2–H2O potential we also took the monomers to be rigid in the ab initio calculations and in the fit. The experimental geometries of NO2 and H2O were used in the ab initio calculations while the SPC/E geometry of H2O was used in the fit. Since the internal bonds are stiff, the use of rigid monomers is a good approximation and moreover has the effect of reducing the necessary sampling for the potential fit from 12 D to 6 D. Thirty-one angular configurations were selected in addition to the Cs symmetry global minimum angular configuration and radial scans were performed at all configurations. The final number of ab initio points used in the fit was 381.
The symmetry-adapted perturbation theory (SAPT) for intermolecular interactions, newly extended to open-shell species, was used to explore the potential energy surface. The efficient implementation used relies on a density-functional theory (DFT) description of the monomers and thus is called SAPT(DFT).28–31 Open-shell SAPT has been used to study atmospherically-relevant complexes with good results, see, e.g., ref. 30. The PBE032 exchange-correlation functional was used for the monomers and the electronic densities of the monomers were corrected using the vertical ionization potentials from the NIST database33 for H2O (I = 0.4638 Hartree) and calculated by us for NO2 with UKS-PBE0/aug-cc-pVQZ using MOLPRO34 (doublet to singlet, Iα = 0.4294 Hartree; doublet to triplet, Iβ = 0.4769 Hartree).
The total (hybrid) SAPT(DFT) interaction energy is composed of the following terms:
| ESAPTint = (E(1)elst) + (E(1)exch) + (E(2)ind + Ẽ(2)exch–ind + δEHFint,resp) + (E(2)disp + Ẽ(2)exch–disp). | (3) |
The fit is based on SAPT(DFT)/aTZ+3322 ab initio points, where the notation indicates that the aug-cc-pVTZ basis set on atoms was supplemented with a set of 3s3p2d2f basis functions on the midpoint between the centers of mass of NO2 and H2O (see ref. 30 for details). We will employ the shortened notation aXZ, where X = 2, 3, and 4 refer to the Dunning basis sets36 aug-cc-pVDZ, aug-cc-pVTZ, and aug-cc-pVQZ, respectively. Adding a midbond basis set is known to accelerate basis set convergence in van der Waals complexes at lower cost than increasing the atomic basis set. The fit form was of the site–site, exp-6 plus electrostatics type,
 | (4) |
| Site type a | Site type b | qb [au] | A [kcal mol−1] | B [Å−1] | C6 [kcal mol−1 Å6] |
|---|---|---|---|---|---|
| a For NO2, we used the experimental geometry26rNO = re,exp = 1.193 Å, θONO = θe,exp = 134.1°. An M site was placed 0.171 Å from the nitrogen atom along the ONO bisector. The H2O molecule is modeled by the SPC/E intermolecular potential as described in Table 1 but we have also placed an Mw site 0.212 Å from the oxygen atom along the HOH bisector for the use of the SPC/E potential with NO2.b The dipole moments of the NO2 molecule with this non-polarizable but effective potential in the gas phase and solvated in water are the same, μgas = μaq = 0.63 D, which was obtained by fitting the NO2 partial charges to the dipole moment of NO2 solvated in a water cluster in the simulations of Galashev and Rakhmanova27 (note that the measured26 gas phase value is 0.33 D). | |||||
| N | 0.28 | ||||
| O | −0.14 | ||||
| M | 0.0 | ||||
| Ow | N | 27956.0585 | 3.5196 | 2493.0559 | |
| Ow | O | 13188.9550 | 3.3825 | 198.9990 | |
| Ow | M | 90474.3281 | 4.1831 | 0.0 | |
| Hw | N | −926.9366 | 2.2456 | 0.0 | |
| Hw | O | 5585.6072 | 4.5674 | 0.0 | |
| Hw | M | 2487.2566 | 2.6495 | 0.0 | |
| Mw | N | 11751.1798 | 2.5409 | 0.0 | |
| Mw | O | 6417.5834 | 3.5139 | 0.0 | |
| Mw | M | −25690.9038 | 2.9305 | 0.0 | |
2.2 Simulations of extended systems
The classical force field simulations were done using the FIST module within the CP2K package.37 The molecular dynamics simulations of scattering were performed in the microcanonical (NVE) ensemble with initial velocities assigned from the Maxwell–Boltzmann distribution at 300 K. The system consisted of a periodic rectangular box with dimensions of 15.00 × 15.00 × 71.44 Å3, with the long axis of the box along the Ẑ direction. A slab of 216 water molecules (thickness of about 30 Å) was located at the center of the box, bound on either surface along the Ẑ direction by vacuum. A single NO2 molecule was introduced in the scattering simulations. Such a water system is sufficient for modeling both bulk and interfacial conditions.38–40 It is known that the SPC/E potential yields a density very close to 1 g cm−3 at the center of the slab, as well as reproducing conditions at the interface.39 Rigid molecule constraints were imposed using the SHAKE algorithm.41 We started with well-equilibrated water configurations from ref. 40 and as in ref. 28 and 39 confirmed that the correct density and hydrogen bond population profiles are obtained for the pure water system. As in ref. 40, the density profile with the height Z from the vertical center of the slab was fitted using | (5) |
For each of the 160 trajectories, the NO2 molecule was released at 10 Å above the water surface but in a different orientation and position in the plane. Additionally, a slightly different equilibrated water structure was used in each case. Smooth particle mesh Ewald summations were used to sum electrostatic contributions. The time step was 1 fs and each trajectory was propagated for 90 ps. The determination of the fate of an NO2 molecule impacting on the surface was based on the average height of the N atom above the center of the water slab in the last 10 ps at the end of a 90 ps simulation: scattered (in the vacuum, Z > ZGDS + 2δ after interacting with the surface for 2 ps or less), adsorbed (ZGDS − 2δ ≤ Z ≤ ZGDS + 2δ), desorbed (in the vacuum, Z > ZGDS + 2δ after first having adsorbed or absorbed for more than 2 ps), or absorbed (in the bulk, Z < ZGDS − 2δ). The N atom was used for convenience; the use of the center-of-mass of NO2 made no discernable difference. The thermal (S) and mass (α) accommodation coefficients were calculated from the numbers of NO2 trajectories with the various outcomes (as recommended in ref. 18): S = (number of impinging molecules equilibrated to liquid temperature)/(number of molecules impinging on the liquid surface), or
 | (6) |
 | (7) |
 | (8) |
 | (9) |
A typical “adsorbed” and a typical “absorbed” trajectory were further extended up to about 0.5 ns in the canonical (NVT) ensemble (with Nosé–Hoover “massive” thermostatting)42,43 at 300 K and used to obtain (equilibrium) structural properties. All other settings were identical to those in the NVE calculations.
3 Results and discussion
3.1 NO2–H2O
![[X with combining tilde]](https://www.rsc.org/images/entities/i_char_0058_0303.gif) 2A1)–H2O complex, either in the gas phase or solvated with additional water molecules.44–46 The global minimum has been found to be a non-hydrogen-bonded Cs structure, with the nitrogen of NO2 closest to the oxygen of water.45,46 The Cs structure of ref. 44 which found the oxygens of NO2 to be closer to the hydrogens of water is likely due to the use of a basis set that was too small. An empirical potential27,47 used in previous molecular dynamics simulations of NO2 molecules in water clusters had an NO2–H2O bond of only −1.07 kcal mol−1 at the C2v symmetry structure and a too-long RN–Ow separation of 3.24 Å.
2A1)–H2O complex, either in the gas phase or solvated with additional water molecules.44–46 The global minimum has been found to be a non-hydrogen-bonded Cs structure, with the nitrogen of NO2 closest to the oxygen of water.45,46 The Cs structure of ref. 44 which found the oxygens of NO2 to be closer to the hydrogens of water is likely due to the use of a basis set that was too small. An empirical potential27,47 used in previous molecular dynamics simulations of NO2 molecules in water clusters had an NO2–H2O bond of only −1.07 kcal mol−1 at the C2v symmetry structure and a too-long RN–Ow separation of 3.24 Å.Our geometry optimization of the NO2–H2O complex at the coupled-cluster singles and doubles level of theory with a perturbative treatment of triples, an unrestricted Hartree–Fock reference wave function, and the basis set aug-cc-pVTZ (UHF-CCSD(T)/aug-cc-pVTZ or CCSD(T)/aTZ for short) also yielded an optimized structure of Cs symmetry with an RN–Ow separation of 2.82 Å. Other levels of theory (HF, MP2, or CCSD; also DFT using BLYP-D2 and B3LYP-D2, where an empirical dispersion correction48 is used, all with the unrestricted reference wave functions, and basis sets of at least aDZ quality) yielded a very similar structure. The Cs global minimum (and a C2v secondary minimum structure, see below) and the interaction energies are presented in Fig. 1(a) and Table 3. Spin-contamination in the unrestricted Hartree–Fock calculations was not severe (S2 values of 0.77). Comparison of relative CCSD(T) energies from unrestricted and restricted open-shell calculations yielded values with differences less than 0.01 kcal mol−1, as Table 3 shows.
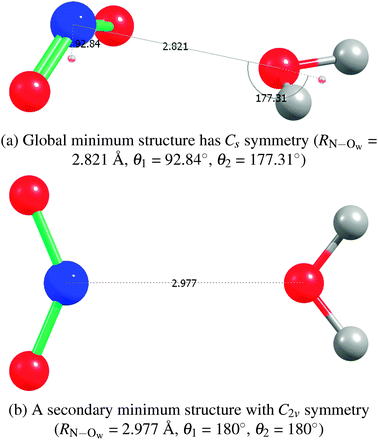 | ||
| Fig. 1 NO2–H2O structures from CCSD(T)/aTZ geometry optimizations. | ||
| Method | (a) Cs | (b) C2v | ||
|---|---|---|---|---|
| RN–Ow [Å] | Eint [kcal mol−1] | RN–Ow [Å] | Eint [kcal mol−1] | |
| a Unless otherwise indicated [e.g., RCCSD(T)], unrestricted open-shell Hartree–Fock or Kohn–Sham reference wave functions are used for the ab initio calculations (but SAPT uses the restricted open-shell Kohn–Sham reference wave function). The ab initio interaction energies are without counterpoise (CP) correction (but the supermolecular portion of the SAPT interactions energy, δEHFint,resp, is CP-corrected; also, all SAPT calculations use the full dimer basis set). The frozen core (fc) approximation was used for the supermolecular ab initio correlation energy calculations [but the correlation part of the SAPT energy is all-electron (ae)]. MP2 and CCSD(T) interaction energies are fc at the CCSD(T)(ae)/aTZ optimized geometries. Geometries are re-optimized with the given method if marked ``opt”. Coupled-cluster geometry optimizations were performed with CFOUR.49 The DFT calculations and geometry optimizations were performed with NWCHEM.50 CP2K37 was used for the empirical fit calculations and rigid-monomer geometry optimizations (using simulated annealing). The fits use rigid monomers with the SPC/E and the experimental monomer geometries for H2O and NO2, respectively.b ECCSD(T)int(CBS) = EHFint(X + 1) + ΔECCSD(T)int(X + 1, X) where the correlated term was extrapolated using the standard X−3 two-point formula51 and the basis sets aug-cc-pV(X + 1, X)Z are aQZ and aTZ. | ||||
| HF/aTZ | 2.821 | −1.45 | 2.977 | −1.24 |
| HF/aQZ | 2.821 | −1.40 | 2.977 | −1.19 |
| MP2/aTZ | 2.821 | −2.22 | 2.977 | −0.96 |
| MP2/aQZ | 2.821 | −2.15 | 2.977 | −0.89 |
| RCCSD(T)/aTZ | 2.821 | −2.38 | 2.977 | −1.35 |
| CCSD(T)/aTZ | 2.821 | −2.38 | 2.977 | −1.36 |
| CCSD(T)/aQZ | 2.821 | −2.30 | 2.977 | −1.27 |
| CCSD(T)(CBS)b | 2.821 | −2.26 | 2.977 | −1.22 |
| SAPT(DFT)/aTZ+3322 | 2.821 | −2.30 | 2.977 | −1.30 |
| Fit (Galashev and Rakhmanova27) | 2.821 | 0.68 | 2.977 | −0.88 |
| Opt | 2.89 | −0.74 | 3.24 | −1.07 |
| Fit (this work) | 2.821 | −2.10 | 2.977 | −2.45 |
| Opt | 2.89 | −2.25 | 2.88 | −2.48 |
| BLYP-D2/DZ | 2.821 | −1.55 | 2.977 | −0.21 |
| BLYP-D2/aDZ | 2.821 | −0.23 | 2.977 | 0.56 |
| Opt | 2.94 | −1.70 | 3.03 | −0.86 |
| B3LYP/aDZ | 2.821 | −1.15 | 2.977 | −0.54 |
| Opt | 2.95 | −1.36 | 3.15 | −0.69 |
| B3LYP-D2/aDZ | 2.821 | −2.08 | 2.977 | −1.13 |
| Opt | 2.86 | −2.19 | 2.97 | −1.22 |
| B3LYP-D2/aTZ | 2.821 | −2.06 | 2.977 | −1.13 |
| Opt | 2.89 | −2.13 | 3.00 | −1.16 |
Extrapolation to the complete basis set (CBS) limit of the CCSD(T) energies was performed using the aTZ and aQZ basis set results. As expected, these interaction energies without the counterpoise correction smoothly approach the CBS limit from below. The NO2–H2O complex is about twice as strongly bound as previously determined, with a binding energy of −2.26 kcal mol−1 as determined by CCSD(T)/CBS. Note that the SAPT interaction energies agree very well with the CCSD(T)/CBS benchmarks. To compare with results using DFT, we performed also DFT geometry minimizations and found that, perhaps fortuitously, B3LYP-D2 with aDZ and aTZ basis sets also closely reproduces the benchmark structures and binding energies. The binding energy of only about −0.90 kcal mol−1 found in ref. 45, where the authors used B3LYP/6-311+G(2d,p), is apparently due to authors' neglect of a dispersion contribution, which is important for this complex.
We found a secondary structure of C2v symmetry that is bound by −1.22 kcal mol−1. See Fig. 1(b) and Table 3 for details. A hydrogen-bonded trans structure ONO–HOH, yet another secondary structure, which the authors of ref. 45 found to be almost of the same depth as their Cs global minimum, we found to also be about 1 kcal mol−1 less attractive than our global minimum. Our further exploration of the NO2–H2O potential energy surface (PES) showed that it is flat in the region of the minimum with respect to a symmetry-breaking wag of the H2O molecule; i.e., in the transition from the Cs to a nearby C1 structure.
Both the Cs and C2v structures optimize electrostatic interactions (based on consideration of the dipole–dipole interaction or interaction of partial charges fitted to the multipole moments). Our SAPT component analysis is presented in Fig. 2, as the total interaction energies from SAPT and CCSD(T)/CBS. Note that the SAPT interaction energy is in very good agreement with CCSD(T). With respect to components of the interaction energy, the electrostatics component is dominant in the bonding and is the reason for the formation of an N–Ow bond (rather than some form of hydrogen bond, e.g., O–Hw). We will see that this bonding has possible implications for NO2 dimerization and the subsequent hydrolysis. The dispersion component is significant in adding to the depth of the PES, as is also confirmed by comparing the interaction energies obtained by B3LYP and B3LYP-D2 methods. Since the electrostatics component, being directional, will be rotationally averaged during the thermal motions of molecules, components that are more isotropic, like dispersion, will continue to be essential in determining the average minimal structures during MD simulations.
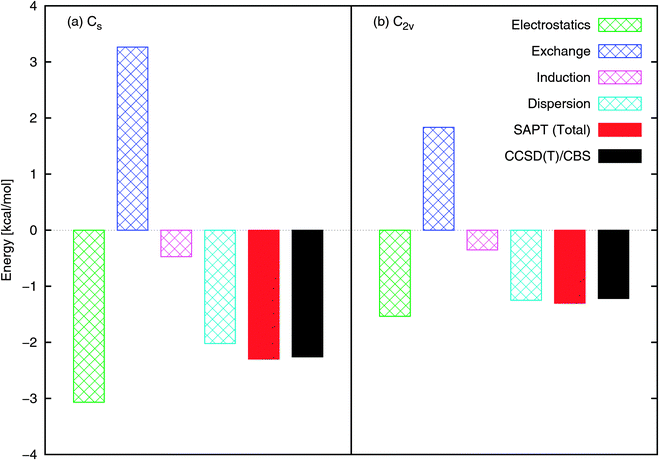 | ||
| Fig. 2 NO2–H2O SAPT interaction energy components at the (a) Cs and (b) C2v configurations shown in Fig. 1. The total SAPT interaction energy is also shown and compares well with that obtained using CCSD(T)/CBS. | ||
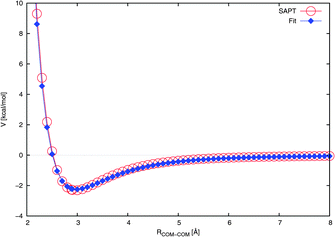 | ||
| Fig. 3 Radial cut through the NO2–H2O potential energy surface at the Cs angular configuration (see Fig. 1(a)). The fit is compared to the ab initio calculated interaction energies. The lines are drawn to guide the eye. | ||
Our potential reproduces the ab initio depth of about 2.3 kcal mol−1 reasonably well, as shown in Table 3. This is in contrast to ref. 27 and 47 where the authors employed a potential with a depth of only ∼1.1 kcal mol−1. However, it must be noted that the NO2–H2O portion of that potential was not explicitly fitted for NO2–H2O, instead being simply a universal force field extended to NO2–H2O.
3.2 Scattering simulations of NO2 at the air–water interface
In Fig. 4 are shown the 160 trajectories generated in this work while Fig. 5 displays typical trajectories for each of the four possible observed outcomes: direct scattering, adsorption, desorption, and absorption. In this work, an NO2 molecule is considered to be directly scattered if it leaves the surface after being resident in the vicinity of the surface for only a short duration of less than 2 ps since this is approximately the time needed for dissipation of kinetic energy of a typical thermal impacting molecule into the water surface.18 An adsorbed molecule is one that remains within the interfacial region for a longer period, for our purposes, about 10 ps. The molecule may later be desorbed from the surface. Such molecules may be considered to be trapped (i.e., not in equilibrium). We consider a molecule to be absorbed if it is in the bulk liquid for 10 ps or more at the end of the 90 ps interval.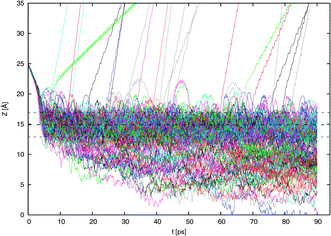 | ||
| Fig. 4 Results of the 160 scattering simulations. The vertical position of the NO2 nitrogen atom relative to the center of the water slab is shown as the simulation proceeds. The position of the Gibbs dividing surface ZGDS and its surrounding interfacial width ±2δ are also shown. | ||
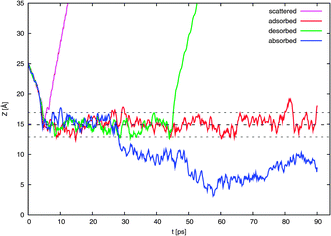 | ||
| Fig. 5 Like Fig. 4 except here are shown only one typical example of a possible outcome: direct scattering, surface trapping in the form of adsorption and possible later desorption, and absorption. | ||
Fig. 6 shows a series of (cumulative) snapshots of the nitrogen atom as NO2 diffuses in the interfacial region (surface and subsurface) of the water slab. It is seen that the whole surface is visited over the course of about 50 ps.
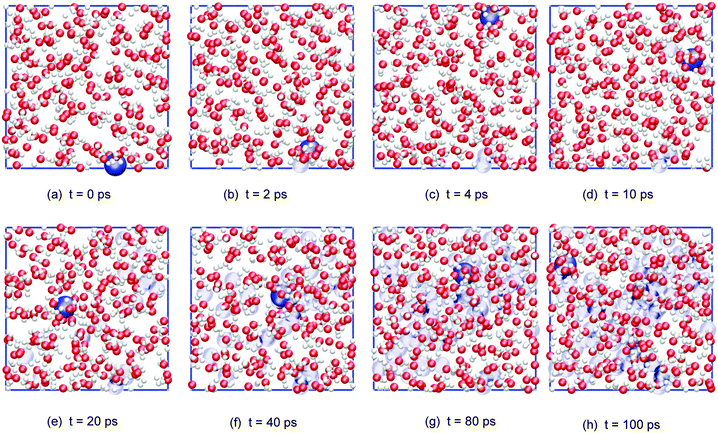 | ||
| Fig. 6 Cumulative snapshots of a typical adsorbed NO2 trajectory diffusing along the surface of the water slab (top view; water molecules and, for clarity, only the NO2 nitrogen atom is shown in dark blue, with its previous positions in light blue). | ||
The average orientation of an NO2 molecule interacting with the surface can be quantified by considering the cosine of the angle between the ONO bisector ![[b with combining circumflex]](https://www.rsc.org/images/entities/i_char_0062_0302.gif) and the normal to the surface Ẑ. Note that the dipole moment of NO2 points in the opposite direction to
and the normal to the surface Ẑ. Note that the dipole moment of NO2 points in the opposite direction to ![[b with combining circumflex]](https://www.rsc.org/images/entities/i_char_0062_0302.gif) . Fig. 7 shows that an adsorbed NO2 has a marked orientational preference, with the oxygens pointing into the vacuum, with 〈cos(θ)〉 = 0.40, corresponding to
. Fig. 7 shows that an adsorbed NO2 has a marked orientational preference, with the oxygens pointing into the vacuum, with 〈cos(θ)〉 = 0.40, corresponding to ![[b with combining circumflex]](https://www.rsc.org/images/entities/i_char_0062_0302.gif) being oriented toward the vacuum at about 66° to the surface normal. As expected, the curve for the absorbed NO2 shows no orientational preference.
being oriented toward the vacuum at about 66° to the surface normal. As expected, the curve for the absorbed NO2 shows no orientational preference.
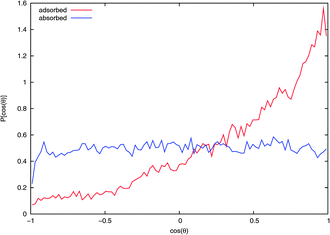 | ||
| Fig. 7 Probability distribution of NO2 orientation with respect to the surface normal from extended NVT trajectories. If the bisector of NO2 is aligned with the surface normal then cos(θ) = 1. Values for NO2 on the water surface and in the bulk from typical adsorbed and absorbed trajectories, respectively, are shown. | ||
The solvation structure of a solute can be examined quantitatively by considering the radial distribution functions (RDFs) and running coordination numbers (CNs) with respect to the solvent. CN was obtained by integrating the respective RDF curve. The ordinate of the CN curve at the position of the first minimum in the RDF is equal to the number of first-shell solvent molecules surrounding the solute. Fig. 8 compares the RDF gN−Ow(r) and the associated CN of adsorbed and absorbed NO2. The adsorbed NO2 has a first solvation shell of waters at a smaller distance than the absorbed NO2, with the first maximum in gN−Ow(r) being at 3.75 Å and 3.85 Å for the adsorbed and absorbed case, respectively. The corresponding CNs were 6.6 for adsorbed NO2 and 7.8 for NO2 in the bulk.
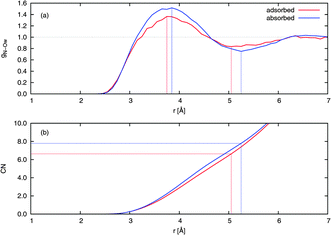 | ||
| Fig. 8 (a) Radial distribution functions (RDFs) and (b) running coordination numbers (CNs) from extended NVT trajectories. Values for NO2 on the water surface and in the bulk from typical adsorbed and absorbed trajectories, respectively, are shown. A normalization has been imposed so that the RDFs equal unity at large distance, and the CNs have been similarly scaled to match. The lines drawn indicate the position of the first maximum and first minimum in the RDF, the latter enabling determination of the number of nearest-neighbor water molecules surrounding an NO2 molecule. | ||
Compared to tetrahedrally coordinated liquid water, the relatively large first shell coordination numbers obtained indicate that NO2 forms a pocket or cavity on the surface and in the bulk, respectively. Since hydrogen bonds are mostly not present, this volume from which water molecules are excluded is of a relatively large extent. Such behavior is expected given that NO2 is mildly hydrophobic.
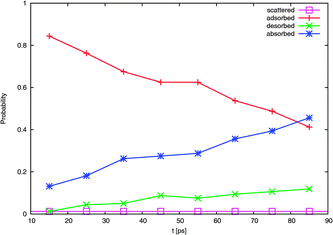 | ||
| Fig. 9 Evolution of probability with time of the four typical outcomes. | ||
A calculated accommodation coefficient for NO2 would be very useful for comparison to the calculated coefficients of other species such as OH obtained in molecular dynamics simulations of similar duration. By counting the fractions of each molecule undergoing these outcomes at the end of the 90 ps period (actually, the average position in the 10 ps interval between 80 and 90 ps), we observed that 2 (or 1% of the 160 trajectories) are directly scattered, 85 (53%) are trapped at the surface [comprised of 66 (41%) adsorbed molecules, with 19 (12%) subsequently desorbed], and 73 (46%) are absorbed. This provides thermal and mass accommodation coefficients of SMD = 0.99 and αMD,upper = 0.87, respectively. With pk = 0.79, we finally obtain αMD = 0.78. With respect to its interaction with water, NO2 is similar in many respects to OH (which has a calculated mass accommodation coefficient of 0.83; see, e.g., ref. 16–18 and 52). Like OH, NO2 behaves as a surfactant on water.
Experimentally measured values of the net uptake coefficient reported previously are summarized in the IUPAC Gas Kinetic Data Evaluation.53 At 298 K, they range from <10−7 to 10−3. This wide range is likely in large part due to varying contributions from reevaporation back into the gas phase on the time scales of the measurements (generally ms or longer). The same issue makes comparison of experimental results to theory problematic, since the time scales in molecular dynamics simulations are typically 100 ps or shorter. Disagreement between calculated and measured uptake of a number of gases at water surfaces is quite common18,54,55 because of these vastly different time scales.
4 Atmospheric chemistry implications
The importance of reactions of NO2 at the interface will depend on its surface concentration, which is determined by the rates of uptake and desorption. The results of this study suggest that trapping of NO2 upon collision with the surface is quite efficient and hence is limited by the gas phase concentration. In addition, our results suggest that the residence time (τ) for NO2 on the surface is at least of the order of 1 ns, and our estimates suggest that it could be 10 ns or more even on a pure water surface. Under some conditions, concentrations of NO2 sampled in the plumes from emission sources can be quite high. For example, automobile exhaust collected in Teflon chambers can have concentrations of 30 ppm or more.56,57 Under these conditions, liquid water is also present either as droplets or adsorbed on the walls of the sampling system and chamber. For 30 ppm NO2, the collision rate with the surface at 298 K is 6.9 × 10¹⁸ s−1 cm−2. Taking the rate constant for desorption as 108 s−1, corresponding to a residence time on the surface of 10 ns, an NO2 surface concentration of 6.9 × 1010 cm−2 at steady-state is derived.At an NO2 surface concentration of 6.9 × 1010 cm−2, there are 1.6 × 10⁻³ NO2 in each box, i.e., there would be on average about one NO2 in 644 of these boxes. As shown in Fig. 6, the mobility of NO2 on the surface is such that it samples most of the 15 Å × 15 Å box in ∼50 ps. Sampling 644 boxes containing on average one NO2 would take 32 ns, the lower limit for the residence time of NO2 on the surface. This suggests that the likelihood of two NO2 molecules colliding and having an opportunity to react to form the dimer, NO+NO3− and subsequently HONO, is high under these conditions. Such a process could be at least in part responsible for the relatively high rates of conversion of NO2 to HONO observed in such systems. For example, in a Teflon sampling chamber containing auto exhaust from a 1980 pickup truck operated in a standard highway driving cycle, 67 ppm NO2 and 8.5 ppm HONO were observed, corresponding to a 13% conversion of NO2 to HONO.56
The effective residence time of NO2 and reactivity may be enhanced beyond that estimated here by several factors. First, although 10 ns is the limit of the present calculations, the true residence time for NO2 on the surface may be greater than this, giving higher NO2 surface concentrations and probabilities for reaction with NO2 or other species. Second, residence times may be increased by interaction with other species in the aqueous phase such as chloride ions, HNO3 or NO3− and some surfactants.12,13,58–60 We therefore consider the estimates above to be somewhat conservative.
5 Concluding remarks
The minimum energy structure of the NO2–H2O complex was characterized by coupled-cluster calculations and found to be of Cs symmetry, with an O2N–OH2 bonding pattern. The intermolecular separation and binding energy are typical for a van der Waals complex dominated by the electrostatic interaction. SAPT calculations confirmed that the electrostatics component was dominant. The intermolecular bond can be understood to be driven by a maximization of the dipole–dipole interaction. Nevertheless, the dispersion interaction was significant. Our calculations showed that the complex is twice as strongly bound as calculated by previous researchers.An intermolecular potential was fitted to SAPT interaction energy points and molecular dynamics simulations of an NO2 molecule interacting with an air–water interface under ambient conditions were performed. We observed that the bonding pattern of NO2 to the water molecules was of the aforementioned type; in particular, we did not observe NO2 forming hydrogen-bonded structures with the water molecules. NO2 behaved like a small mildly hydrophobic molecule in water, with the oxygens of NO2 generally not interacting with the water molecules. For NO2 at the surface of water, this led to a pronounced orientational preference, with the NO2 oxygens pointing out of the interface. The mildly hydrophobic nature of NO2 is also suggested by experiments currently underway.
Scattering simulations were performed to determine the typical outcomes of NO2 encountering the air–water interface. We observed that significant fractions of the trajectories were trapped at the surface or absorbed into the bulk. We suggest that the latter fraction may provide a reservoir of NO2 molecules for HONO production. Moreover, the observed orientational preference of NO2 on the surface of the water may imply that the asymmetric dimer, ONONO2, could be directly formed, obviating the need for surmounting of the high barrier10,61 between symmetric and asymmetric forms.
Due to the limited time scale of our simulations, we cannot make definitive statements on the residence times of NO2 on the surface or in the bulk. However, there is a marked preference of NO2 for becoming trapped in the interface or in the bulk when a time scale of about 100 ps is considered, a time scale which is relevant for chemical interactions to occur.
Acknowledgements
We wish to acknowledge the generous support from the US Department of Energy Office of Science, Grant DE-FG02-09ER64762; and UCI—greenplanet (NSF Grant CHE-0909227) computational facilities and the HUJI—katara computational facilities. The work at the Hebrew University was supported by the Israel Science Foundation, grant number 114/08. GM would like to acknowledge discussions with Madeleine Pincu and Christopher Mundy. We thank James N. Pitts, Jr. for helpful discussions and comments on the manuscript.References
- B. J. Finlayson-Pitts and J. N. Pitts, Chemistry of the Upper and Lower Atmosphere: Theory, Experiments, and Applications, Academic Press, San Diego, 2000 Search PubMed.
- B. J. Finlayson-Pitts, L. M. Wingen, A. L. Sumner, D. Syomin and K. A. Ramazan, Phys. Chem. Chem. Phys., 2003, 5, 223–242 RSC.
- J. Stutz, B. Alicke and A. Neftel, J. Geophys. Res., [Atmos.], 2002, 107, 8192 CrossRef.
- H. Su, Y. F. Cheng, P. Cheng, Y. H. Zhang, S. Dong, L. M. Zeng, X. Wang, J. Slanina, M. Shao and A. Wiedensohler, Atmos. Environ., 2008, 42, 6219–6232 Search PubMed.
- Y. Yu, B. Galle, E. Hodson, A. Panday, R. Prinn and S. Wang, Atmos. Chem. Phys., 2009, 9, 183–223 Search PubMed.
- G. Li, W. Lei, M. Zavala, R. Volkamer, S. Dusanter, P. Stevens and L. T. Molina, Atmos. Chem. Phys., 2010, 10, 6551–6567 CrossRef CAS.
- J. Wang and B. E. Koel, Surf. Sci., 1999, 436, 15–28 CrossRef CAS.
- J. Wang and B. E. Koel, J. Phys. Chem. A, 1998, 102, 8573–8579 CrossRef CAS.
- J. Wang, M. R. Voss, H. Busse and B. E. Koel, J. Phys. Chem. B, 1998, 102, 4693–4696 CrossRef CAS.
- A. S. Pimentel, F. C. A. Lima and A. B. F. da Silva, J. Phys. Chem. A, 2007, 111, 2913–2920 CrossRef CAS.
- A. S. Pimentel, F. C. Lima and A. B. da Silva, Chem. Phys. Lett., 2007, 436, 47–50 CrossRef CAS.
- M. A. Kamboures, J. D. Raff, Y. Miller, L. F. Phillips, B. J. Finlayson-Pitts and R. B. Gerber, Phys. Chem. Chem. Phys., 2008, 10, 6019–6032 RSC.
- M. A. Kamboures, W. van der Veer, R. B. Gerber and L. F. Phillips, Phys. Chem. Chem. Phys., 2008, 10, 4748–4753 RSC.
- Y. Miller, B. J. Finlayson-Pitts and R. B. Gerber, J. Am. Chem. Soc., 2009, 131, 12180–12185 CrossRef CAS.
- K. A. Ramazan, L. M. Wingen, Y. Miller, G. M. Chaban, R. B. Gerber, S. S. Xantheas and B. J. Finlayson-Pitts, J. Phys. Chem. A, 2006, 110, 6886–6897 CrossRef CAS.
- M. Roeselova, P. Jungwirth, D. J. Tobias and R. B. Gerber, J. Phys. Chem. B, 2003, 107, 12690–12699 CrossRef CAS.
- M. Roeselova, J. Vieceli, L. X. Dang, B. C. Garrett and D. J. Tobias, J. Am. Chem. Soc., 2004, 126, 16308–16309 CrossRef CAS.
- J. Vieceli, M. Roeselova, N. Potter, L. X. Dang, B. C. Garrett and D. J. Tobias, J. Phys. Chem. B, 2005, 109, 15876–15892 CrossRef CAS.
- M. Baer, C. J. Mundy, T.-M. Chang, F.-M. Tao and L. X. Dang, J. Phys. Chem. B, 2010, 114, 7245–7249 Search PubMed.
- H. J. C. Berendsen, J. R. Grigera and T. P. Straatsma, J. Phys. Chem., 1987, 91, 6269–6271 CrossRef CAS.
- W. S. Benedict, N. Gailar and E. K. Plyler, J. Chem. Phys., 1956, 24, 1139 CrossRef CAS.
- S. A. Clough, Y. Beers, G. P. Klein and L. S. Rothman, J. Chem. Phys., 1973, 59, 2254 CrossRef CAS.
- Y. Tu and A. Laaksonen, Chem. Phys. Lett., 2000, 329, 283–288 CrossRef CAS.
- P. L. Silvestrelli and M. Parrinello, Phys. Rev. Lett., 1999, 82, 3308–3311 CrossRef CAS.
- Y. S. Badyal, M.-L. Saboungi, D. L. Price, S. D. Shastri, D. R. Haeffner and A. K. Soper, J. Chem. Phys., 2000, 112, 9206 CrossRef CAS.
- CRC Handbook of Chemistry and Physics, Internet Version, ed. D. R. Lide, Taylor and Francis, Boca Raton, FL, 87th edn, 2007 Search PubMed.
- A. Galashev and O. Rakhmanova, Russ. J. Phys. Chem. A, 2010, 84, 1364–1368 Search PubMed.
- B. Jeziorski, R. Moszynski and K. Szalewicz, Chem. Rev., 1994, 94, 1887–1930 CrossRef CAS.
- A. J. Misquitta, R. Podeszwa, B. Jeziorski and K. Szalewicz, J. Chem. Phys., 2005, 123, 214103 CrossRef.
- P. S. Zuchowski, R. Podeszwa, R. Moszynski, B. Jeziorski and K. Szalewicz, J. Chem. Phys., 2008, 129, 084101 CrossRef.
- SAPT2008.2, an ab initio program for many-body symmetry-adapted perturbation theory calculations of intermolecular interaction energies, written by R. Bukowski, W. Cencek, P. Jankowski, et al., University of Delaware and University of Warsaw, http://www.physics.udel.edu/∼szalewic/SAPT/SAPT.html.
- C. Adamo and V. Barone, J. Chem. Phys., 1999, 110, 6158 CrossRef CAS.
- S. G. Lias, Gas phase ion energetics data, in NIST Chemistry WebBook, ed. W. G. Mallard, NIST Standard Reference Database Number 69, 2011, see http://webbook.nist.gov Search PubMed.
- H.-J. Werner, P. J. Knowles, G. Knizia, F. R. Manby and M. Schütz, et al., MOLPRO, version 2010.1, a package of ab initio programs, 2010, http://www.molpro.net Search PubMed.
- G. Murdachaew, C. J. Mundy and G. K. Schenter, J. Chem. Phys., 2010, 132, 164102 CrossRef.
- T. H. Dunning, J. Chem. Phys., 1989, 90, 1007–1023 CrossRef CAS.
- The CP2K developers group, http://cp2k.berlios.de/, 2000–2012.
- I.-F. W. Kuo and C. J. Mundy, Science, 2004, 303, 658–660 CrossRef CAS.
- I.-F. W. Kuo, C. J. Mundy, B. L. Eggimann, M. J. McGrath, J. I. Siepmann, B. Chen, J. Vieceli and D. J. Tobias, J. Phys. Chem. B, 2006, 110, 3738–3746 CrossRef CAS.
- G. Murdachaew, C. J. Mundy, G. K. Schenter, T. Laino and J. Hutter, J. Phys. Chem. A, 2011, 115, 6046–6053 Search PubMed.
- J.-P. Ryckaert, G. Ciccotti and H. J. Berendsen, J. Comput. Phys., 1977, 23, 327–341 CrossRef.
- G. J. Martyna, M. L. Klein and M. Tuckerman, J. Chem. Phys., 1992, 97, 2635–2643 CrossRef.
- D. J. Tobias, G. J. Martyna and M. L. Klein, J. Phys. Chem., 1993, 97, 12959–12966 CrossRef CAS.
- D. W. Ball, Chem. Phys. Lett., 1999, 312, 306–310 Search PubMed.
- A. Chou, Z. Li and F.-M. Tao, J. Phys. Chem. A, 1999, 103, 7848–7855 CrossRef CAS.
- Y. V. Novakovskaya, D. S. Bezrukov and N. F. Stepanov, Int. J. Quantum Chem., 2004, 100, 460–468 Search PubMed.
- A. Galashev and O. Rakhmanova, Colloid J., 2010, 72, 478–485 Search PubMed.
- S. Grimme, J. Comput. Chem., 2006, 27, 1787–1799 CrossRef.
- CFOUR, a quantum chemical program package written by J. F. Stanton, J. Gauss, M. E. Harding and P. G. Szalay, et al. For the current version, see http://www.cfour.de.
- M. Valiev, E. Bylaska, N. Govind, K. Kowalski, T. Straatsma, H. Van Dam, D. Wang, J. Nieplocha, E. Apra, T. Windus and W. de Jong, Comput. Phys. Commun., 2010, 181, 1477–1489 CrossRef CAS.
- A. Halkier, T. Helgaker, P. Jørgensen, W. Klopper, H. Koch, J. Olsen and A. K. Wilson, Chem. Phys. Lett., 1998, 286, 243–252 CrossRef CAS.
- R. Vacha, P. Slavicek, M. Mucha, B. J. Finlayson-Pitts and P. Jungwirth, J. Phys. Chem. A, 2004, 108, 11573–11579 CrossRef CAS.
- IUPAC Subcommittee for Gas Kinetic Data Evaluation, Data Sheet VI.A1.3, last evaluated April, 2011, http://www.iupac-kinetic.ch.cam.ac.uk/.
- P. Davidovits, C. E. Kolb, L. R. Williams, J. T. Jayne and D. R. Worsnop, Chem. Rev., 2006, 106, 1323–1354 CrossRef CAS.
- B. C. Garrett, G. K. Schenter and A. Morita, Chem. Rev., 2006, 106, 1355–1374 CrossRef CAS.
- J. N. Pitts, Environ. Health Perspect., 1983, 47, 115–140 CrossRef CAS.
- J. N. Pitts, H. W. Biermann, A. M. Winer and E. C. Tuazon, Atmos. Environ., 1984, 18, 847–854 CrossRef.
- S. Enami, M. R. Hoffmann and A. J. Colussi, J. Phys. Chem. B, 2009, 113, 7977–7981 CrossRef CAS.
- T. Kinugawa, S. Enami, A. Yabushita, M. Kawasaki, M. R. Hoffmann and A. J. Colussi, Phys. Chem. Chem. Phys., 2011, 13, 5144–5149 RSC.
- A. Yabushita, S. Enami, Y. Sakamoto, M. Kawasaki, M. R. Hoffmann and A. J. Colussi, J. Phys. Chem. A, 2009, 113, 4844–4848 CrossRef CAS.
- D. de Jesus Medeiros and A. S. Pimentel, J. Phys. Chem. A, 2011, 115, 6357–6365 Search PubMed.
Footnote |
| † Present address: Department of Chemistry, University of Helsinki, P. O. Box 55, FIN-00014, Finland. E-mail: garold.murdachaew@helsinki.fi; Fax: +358 (0)9 191 50279; Tel: +358 (0)9 191 50318. |
| This journal is © the Owner Societies 2013 |
