The effect of urea on aqueous hydrophobic contact-pair interactions
Received 7th August 2012, Accepted 23rd October 2012
First published on 24th October 2012
Abstract
Urea is perhaps the most common denaturant used for studying proteins. However the mechanism of denaturation is still not well understood. Recent theoretical work suggests that van der Waals interactions between urea and non-polar amino acid residues are a major contributor to the protein denaturation process. However, there are few experimental data measuring the effect of urea on hydrophobic interactions. In this work we have determined how the addition of urea to the aqueous solvent affects the contact-pair formed between alkyl and phenyl groups in model compounds: the data indicate that for solutes having a radius smaller than 2.87 Å cavity formation energetics dominate, therefore the addition of urea promotes the formation of hydrophobic contact pairs; while for larger solutes, van der Waals interactions have the largest magnitude, causing urea to disrupt the formation of contact pairs. The influence of urea on hydrophobic interactions is shown to be continuous in the 1–8 M concentration range and is well-correlated with the predictions of scaled particle theory. This demonstrates that the effect of urea on hydrophobic contact pairs can be explained by the changes observed in the solvent packing density, without having to invoke changes in the hydrogen bonding network of water.
1. Introduction
The mechanism by which urea denatures proteins has long been a matter of discussion among biophysical chemists, despite extensive theoretical and experimental studies performed over the last few decades.1–13 In order to explain the denaturing power of urea, two very different mechanisms are invoked: the “direct” and “indirect” mechanisms.4,9,14,15 The indirect mechanism suggests that urea disrupts the hydrogen bonding network of water and consequently alters the solvent environment of proteins (this alteration will thus reduce the hydrophobic effect and lead to the exposure of the protein hydrophobic core to water molecules).4 The direct mechanism, in contrast, suggests that urea denatures proteins through direct interactions with various segments of the protein molecule (e.g. peptide bond moieties); these interactions promote the transfer of these segments into the aqueous solvent, thereby denaturing the protein.5,16 Recent experimental studies on urea solutions have found little evidence for urea-induced structure changes in the aqueous solvent17,18 and most recent analyses of urea's protein denaturing properties tend to favor the direct mechanism.9,19,20The direct mechanism of urea denaturation of proteins has been traditionally suggested to occur through strong electrostatic interactions with the protein backbone or side-chains.1,5,17 Experimental studies performed on a number of model systems indicate that urea is capable of directly interacting with the polypeptide backbone and polar side-chains through electrostatic and hydrogen bonding interactions.21–24 However, in addition to denaturing proteins, urea can also disrupt hydrophobic interactions as demonstrated by the observed effects of adding urea to solutions containing micelles25–27 or lipid bilayers.28,29 The molecular basis of this disruption was suggested by Muller30 in his analysis of the alkane solubility data of Wetlaufer et al.31 According to Muller, urea enhances the solubility of large hydrocarbons in water by engaging in van der Waals interactions with the alkane molecules. Theoretical studies32,33 using Scaled Particle Theory suggest that the addition of urea affects the solubility of hydrocarbons in two distinct ways: first, the addition of urea increases the free energy of cavity formation in the solvent, lowering hydrocarbon solubility; second, urea can participate in van der Waals interactions with hydrocarbons, thus causing an increase in hydrocarbon solubility. In the case of small solutes, cavity formation energetic considerations dominate causing the addition of urea to lead to a drop in hydrocarbon solubility. For large hydrocarbons, the van der Waals interactions dominate leading to the enhancement of hydrocarbon solubility. Similar conceptual approaches have been recently used to calculate changes in solvation free energies for a number of hydrophobic amino acids,6,16 and the computational results argue that van der Waals interactions between urea and the non-polar side chains play a significant role in solubilizing these moieties in aqueous urea solutions.
Qualitatively, the results listed above can explain the effect of urea on “bulk” hydrophobic interactions,34 reactions that are characterized by the transfer of hydrophobes from aqueous solutions to a pure liquid hydrocarbon phase. Solute transfer thermodynamics may reasonably approximate the changes in free energy occurring when a non-polar residue is transferred from a solvent exposed denatured state to the state of complete burial within the interior of the protein; however, these calculations may not well describe interactions between contacting hydrophobic moieties that are simultaneously partially hydrated.35 The thermodynamics of these partially hydrated situations are important because hydrophobic residues are not always located in the deep interior of proteins and surface hydrophobic contact pairs36–41 do exist in the state of partial hydration. In addition, contacts between partially hydrated hydrophobic residues may also play an important role in stabilizing compact denatured proteins and protein-folding intermediates,42–45 thereby defining the stability of the unfolded states. Because these states are often accessed by using denaturants like urea, it is imperative to determine how urea affects the formation of contact pairs that are formed between hydrophobic residues in proteins.
The importance of this problem has led to a sizable number of theoretical methodologies being applied to study the effect of aqueous urea on hydrophobic contact pair formation,35,46–51 using either methane or neopentane as model solute. These studies have determined the energetics of contact pair formation in pure water and that in 7–8 M urea solution and indicate that the addition of urea enhances the formation of contact pairs between small hydrophobic solutes such as methane and inhibits the formation of contact pairs between large hydrophobes like neopentane. However, until now, there has been little experimental data measuring the effect of urea on the formation of contact pairs between hydrophobic solutes. This work examines how urea affects interactions between non-polar phenyl and alkyl moieties dissolved in aqueous solution by examining the quenching of phenol fluorescence by a variety of aliphatic carboxylates. These studies were done in a continuum of urea concentrations in the 0–8 M range. In a previous study,52 we developed the methodology for isolating the contribution of methyl–phenyl interactions to the fluorescence quenching data. The same methodology will be used to determine how co-solute interactions between phenyl and various alkyl groups are influenced by the addition of urea to the aqueous media. Our results are consistent with theory indicating that solute size determines the mechanism by which addition of urea affects hydrophobic contact pair formation: adding urea causes small alkyl moieties such as methyl, ethyl and propyl groups to form hydrophobic contact pairs, while at the same time urea addition prevents the aggregation of larger pentyl, hexyl and heptyl groups. Analyzing these effects indicate that the contrast between hydrophobic contact pair formation in pure water and water–urea binary solvents is governed by the difference between the work of cavity formation in each solvent, which favors hydrophobic aggregation in water–urea binary solvents, and the difference between solute–solvent van der Waals interactions that favor solubilizing hydrophobic moieties in water–urea binary solvents.
2. Experimental
2.1. Materials
Urea, sodium formate, sodium acetate, sodium propionate, sodium butyrate and sodium chloride were purchased from Sigma (St-Louis, MO); sodium hexanoate, sodium heptanoate and sodium octanoate were purchased from TCI America (Portland OR). Phenol was purchased from Baker Chemical Co. (Phillipsburg, NJ). All experiments were performed in 10 mM bis-tris purchased from Sigma (St-Louis, MO) at pH 7.0 with an ionic strength of 0.5 M adjusted with NaCl. The concentration of phenol in all samples was 200 μM. All samples were measured at room temperature (20 oC).2.2. Methods
Steady-state fluorescence spectra were measured on a Fluorolog-3 Horiba Jobin Yvon spectrofluorometer (Edison, NJ). The sample was held in a 10 × 4 mm2 quartz cuvette. The data were analyzed with Sigma Plot (Point Richmond, CA) software. All samples were prepared in triplicate. Fluorescence spectra were collected using an excitation wavelength set to 270 nm and excitation and emission slits were set to 5 nm band pass resolution. Quenching studies were performed by monitoring changes in the fluorescence intensity at the maximum emission of 297 nm as a function of quencher concentration.3. Results and discussion
3.1. Results
In order to understand the mechanism by which urea acts as a protein denaturant, we have used fluorescence quenching methods to study the effects of urea on the hydrophobic contribution to contact-pair formation between phenol and carboxylate ions. Carboxylate ions have been shown to quench the fluorescence of phenol.53,54 As an example we have depicted the quenching of phenol by sodium acetate in Fig. 1a. The quenching can be well represented by a linear Stern–Volmer equation (Fig. 1b): | |  | (1) |
where F0 is the fluorescence of phenol in the absence of a quencher, F is the fluorescence of phenol in the presence of Q molar of the quencher and Ksv is the Stern–Volmer constant.55 In this work we have determined the quenching of phenol by various carboxylate ions: formate, acetate, propionate, butyrate, hexanoate, heptanoate and octanoate. In addition, we have determined the effect of urea on the quenching properties of these anions. These results have been plotted in Fig. 2. The data demonstrate that the addition of urea causes a decrease in the Stern–Volmer quenching constant (Ksv). This decline can be fitted to eqn (2):| | | Ksv = a + b × [urea (M)] | (2) |
The results of these fits are depicted in Table 1. As a check we have also measured the effect of urea on phenol fluorescence. The addition of urea slightly enhances the phenol fluorescence (less than 10 percent). In the subsequent analysis we will use the fitting parameters of Table 1 to calculate values of Ksv at any given urea concentration. The dependence of Ksv on urea concentration will be used to quantify the effect of urea on hydrophobic interactions between the non-polar alkyl and phenyl moieties.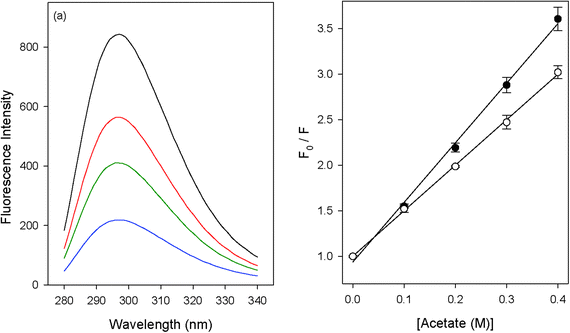 |
| | Fig. 1 (a) The quenching of phenol fluorescence by acetate ions (0 M, 0.1 M, 0.2 M and 0.4 M); (b) Stern–Volmer plots for the quenching of phenol fluorescence by acetate in 0 M (full circles) and 8 M (open circles) urea. | |
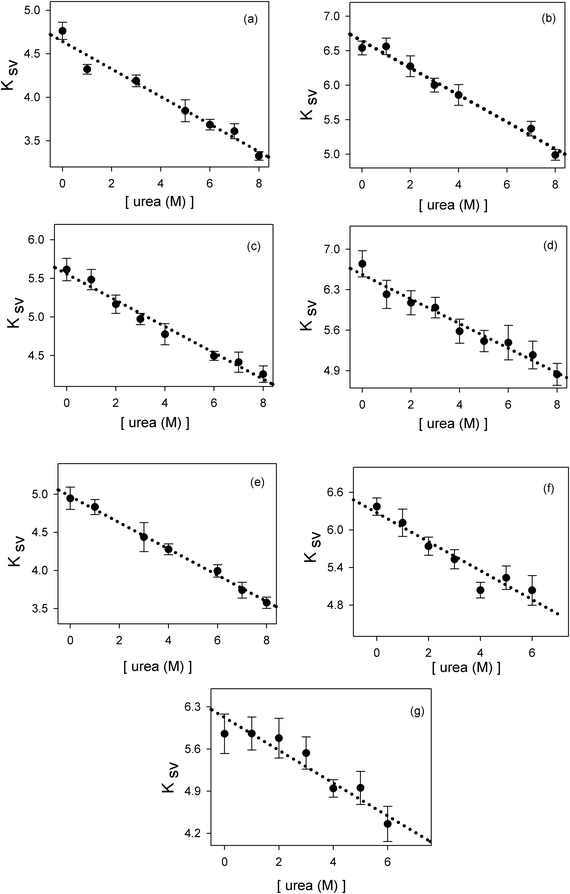 |
| | Fig. 2 The effect of urea on the Stern–Volmer constant Ksv of phenol fluorescence quenched by: (a) formate, (b) acetate, (c) propionate, (d) butyrate, (e) hexanoate, (f) heptanoate, (g) octanoate. | |
Table 1 Linear correlation values obtained from fitting the data in Fig. 2 to eqn (2)
| Salt | a | b | r2 |
|---|
| Formate | 4.64 ± 0.06 | 0.16 ± 0.01 | 0.966 |
| Acetate | 6.64 ± 0.06 | 0.20 ± 0.01 | 0.979 |
| Propionate | 5.56 ± 0.05 | 0.17 ± 0.01 | 0.978 |
| Butyrate | 6.56 ± 0.07 | 0.21 ± 0.02 | 0.963 |
| Hexanoate | 4.97 ± 0.02 | 0.170 ± 0.005 | 0.996 |
| Heptanoate | 6.2 ± 0.1 | 0.23 ± 0.03 | 0.906 |
| Octanoate | 6.1 ± 0.1 | 0.25 ± 0.04 | 0.899 |
3.2. Identifying the contribution of contact pair formation to the quenching data
Carboxylate ions have been shown to quench the fluorescence of phenol aqueous solutions.53,54 The quenching reaction can be represented by Scheme 1:52 |
| | Scheme 1 | |
In this scheme F* is the excited fluorophore, Q is the quencher, [F*·Q] is the encounter complex formed between the quencher and the fluorophore, ket is the rate of energy transfer between the quencher and the excited fluorophore within the encounter complex and F is the fluorophore in the ground state. The quenching of phenol by acetate and formate has been shown to be a “reaction controlled” proton transfer process from the excited phenol hydroxide to the acetate ion.53,54 In this case, because the quenching process is dynamic and not static, the Stern–Volmer quenching constant based on the parameters of Scheme 1 can be formulated as:52,56
| | | Ksv = kqτ = Kec × ket × τ | (3) |
where
Kec is the equilibrium constant associated with the formation of the encounter complex,
ket is the intrinsic rate of proton transfer from excited phenol to the carboxylate and
τ is the fluorescence lifetime of phenol in the absence of a quencher. Proton transfer occurs at a significant rate when donor and acceptor moieties are separated by 0–5 water molecules.
57 This means that in order for quenching to occur, the hydroxyl and carboxylate groups must be within 9 Å of one another. This value is smaller than the sum of the diameters of the quencher and fluorophore molecules. Therefore, we can assume that there is high probability that within the encounter complex, the reacting molecules come into van der Waals contact with one another. The parameter
Kec will characterize the contribution of contact pair formation to the quenching process.
3.3. Isolating the contribution of the hydrophobic effect to contact pair formation
The hydrophobic contribution to Ksv can be isolated accordingly. The free energy of contact-pair formation between any alkyl-carboxylate and phenol can be considered to be a sum of the interaction of the carboxylate head group which is modeled as a head charge and that of the alkyl tail with phenol:| | | ΔGec ≈ ΔGhead + ΔGalkyl | (4) |
Subtracting the free energy of contact formation of phenol and formate from that of any given carboxylate yields:| | | Ψ = {ΔGec}carboxylate − {ΔGec}formate ≈ ΔGhead + ΔGalkyl − ΔGformate | (5) |
The effect of urea on contact pair formation can be calculated by subtracting the value of Ψ at any given urea concentration from that of Ψ in the absence of urea:| | | ΔΨ = Ψ[urea]=S − Ψ[urea]=0 = (ΔGhead + ΔGalkyl − ΔGformate)[urea]=S − (ΔGhead + ΔGalkyl − ΔGformate)[urea]=0 | (6) |
Rearranging the terms gives us the following:| | | ΔΨ = {(ΔGhead)[urea]=S − (ΔGhead)urea=0} − {(ΔGformate)[urea]=S − (ΔGformate)[urea]=0} + {(ΔGalkyl)[urea]=S − (ΔGalkyl)[urea]=0} | (6a) |
If the effect of urea on ΔGhead and ΔGformate is assumed to be linear:| | | (ΔGhead)[urea]=S = (ΔGhead)[urea]=0 + m × [urea] | (7a) |
| | | (ΔGformate)[urea]=S = (ΔGformate) + n × [urea] | (7b) |
where n and m are constants, substituting eqn (7a) and (b) in eqn (6) results in:| | | ΔΨ = (m − n) × [urea] + {(ΔGalkyl)[urea]=S − (ΔGalkyl)[urea]=0} | (8) |
Formate is essentially a free carboxylate with a pKa of 3.8, the pKa of carboxylic acids varies from 4.75 (acetic acid) to 4.89 (octanoic acid). At pH 7 all carboxylate groups are essentially deprotonated. The electrostatic interaction of the various carboxylate head groups with phenol should thus be similarly affected by urea, therefore, the factor (m − n) is likely to be a small constant term for all quenchers. Therefore ΔΨ mostly reflects the difference between the alkyl–phenyl interactions in the presence and absence of urea. If the parameter Φ is defined for any given alkyl-carboxylate quencher:| |  | (9) |
the values of Ksv are determined from the linear fits of Table 1. We may now define ΔΦ:| | 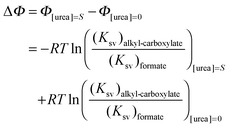 | (10) |
Substituting eqn (3) in eqn (10) we obtain:| | 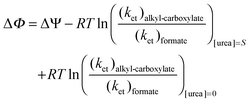 | (10a) |
Because changes in activation free energies are related to changes in the thermodynamic free energies via linear free energy relationships, the urea dependence of the activation energy can be assumed to be linearly dependent on urea:53,54| | | ΔΦ = ΔΨ + (ΔG‡ + α × [urea])alkyl-carboxylate − (ΔG‡ + β × [urea])formate − (ΔG‡)alkyl-carboxylate + (ΔG‡)formate = ΔΨ + (α − β) × [urea] | (11) |
Using the same arguments used for eqn (7) the factor (α − β) is also likely to be a rather small constant term for all quenchers. Re-writing eqn (11) yields:| | | ΔΦ = {(ΔGalkyl)[urea]=S − (ΔGalkyl)[urea]=0} + (m − n + α − β)*[urea] ≈ {(ΔGalkyl)[urea]=S − (ΔGalkyl)[urea]=0} | (11a) |
In this equation, the first term isolates the contribution that the interaction between the hydrophobic alkyl and phenyl moieties makes to Ksv values. In Fig. 3, the experimental values of ΔΦ, calculated from the Ksv values obtained from the correlation lines of Table 1, have been plotted as a function of urea concentration. From this figure we can conclude that urea enhances the interaction between phenyl and small alkyl chains; while for large alkyl moieties (having more than 5 carbon atoms), the addition of urea disrupts phenyl–alkyl interactions.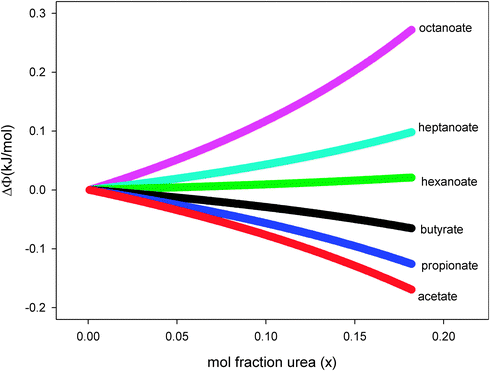 |
| | Fig. 3 Urea concentration dependence of ΔΦ as defined by eqn (10); the various quenchers are: acetate, propionate, butyrate, hexanoate, heptanoate and octanoate. The line thickness represents the 90 percent confidence interval. | |
3.4. Identifying how urea affects hydrophobic contact-pair formation
As pointed out in the Introduction, theoretical analysis suggests that urea can affect the solvation thermodynamics of hydrophobes in two ways: increasing the cost of cavity formation and introducing extra solute–solvent attractive interactions. This framework will be used to analyze our data. If the hydrophobic interaction between phenyl and alkyl groups is represented by eqn (12):| | | alkyl + phenyl → alkyl⋯phenyl | (12) |
the free energy of this interaction can be broken down into the following terms:| | | ΔGhi = ΔGh-bond + ΔGcavity + ΔGvdW + ΔGa–p | (13) |
The first term ΔGh-bond is the free energy contribution from hydrogen bond reorganization in the solvent, ΔGcavity is the difference between the work required to form a cavity to accommodate the solvation of individual alkyl and phenyl moieties and the work required to form a cavity to accommodate the contact pair, ΔGvdW is the contribution of van der Waals interactions between the solvent and non-polar solutes, while ΔGa–p represents weak London interactions between the alkyl and phenyl moieties. It is safe to assume that the addition of urea will also not significantly affect the small ΔGa–p contribution. Therefore the effect of increasing the aqueous concentration of urea addition on the free energy of alkyl–phenyl interactions can be represented as:| |  | (14) |
In which x represents the mole fraction of urea in solvent. Statistical mechanical analysis has shown that solvent reorganization does not directly affect the solvation free energy of hydrophobic molecules in aqueous solutions because the changes in the enthalpy and entropy of solvent reorganization cancel each other,58–61 therefore, the last term in eqn (14) can thus be set to be close to zero.If the solutes are considered to be spherical, the work required for solute cavity formation Gcavity can be calculated from Scaled Particle Theory:32,51
| |  | (15) |
where the constants
K0 = −ln(1 −
ξ),

,

and

depend on the nature of solvent. The parameter
ξ is the volume packing density of the solvent

;
v1 is the molar volume of the solvent,
P is the hydrostatic pressure over the solvent,
R is the gas constant,
T is the temperature and
NAV is the Avogadro constant;
σ2 is the solute molecular diameter and
σ1 is the solvent molecular diameter. We define the function Δ
Gcavity which is the difference between the work of cavity formation for the alkyl–phenyl contact pair and the work of cavity formation for the separated groups:
| | | ΔGcavity = Gcavity (alkyl–phenyl) − Gcavity (alkyl) − Gcavity (phenyl) | (16) |
This value is negative because forming the contact pair reduces the solvent excluding surface of the system relative to the case in which alkyl and phenyl moieties are kept apart. Because the addition of urea to the aqueous solvent changes the solvent system, it will also affect the free energy of cavity formation. The effect of urea on
Gcavity can be represented as:
| |  | (17) |
In the case of an ideal binary urea–water solvent system, the parameters
σ1 and
v1 can be defined as
σ1 =
xuσu + (1 −
xu)
σw and
v1 =
xuvu + (1 −
xu)
vw, where
xu is the mole fraction of urea,
σu = 5.0 × 10
−8 and
σw = 2.75 × 10
−8 are the hard-sphere diameters of urea and water in centimeter,
vu = 45.4 cm
3 mol
−1 and
vw = 18.07 cm
3 mol
−1 are the molar volumes of urea and water.
32 Dilute solutions approach ideal behaviour; this allows the facile calculation of each of the derivatives of
eqn (17) at
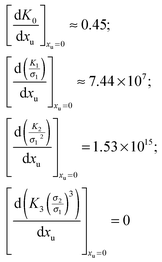
xu = 0:
Therefore the effect of adding urea on the free energy of cavity formation at infinite dilution can be represented as:
| |  | (17a) |
In terms of kJ mol
−1:
| |  | (17b) |
The value of
GvdW (
eqn (13)) follows the following dependence on urea concentration:
32,33| |  | (18) |
If the literature values of (
GvdW)
water are plotted as a function of the square of the molecular diameter the following linear correlation is obtained:
62| | | (GvdW)water = −1.06 × 10¹⁶σ22 | (19) |
Therefore the effect of adding urea on the van der Waals interaction energy can be represented as:
| |  | (20) |
Obtaining a simple analytical expression for Δ
Ghi is not trivial, because it is difficult to geometrically model the phenyl–alkyl contact pair. However, if we consider the alkyl and phenyl moieties as two spheres having equal radii we can simplify the geometry and obtain analytical expressions for changes in Δ
Ghi. This is not an unreasonable approximation, because, in the alkyl moieties studied (methyl, ethyl, propyl, pentyl, hexyl and octyl),

where
ra and
rb represent the radii of the alkyl and phenyl groups respectively.
62,63 In this case, forming a contact pair carves out equal surfaces on the alkyl and phenyl moieties that are solvent inaccessible. We will now model the alkyl–phenyl contact pair as the following simple case.
The alkyl–phenyl contact pair is modeled as two separate spheres having the same molecular surface as the contact pair. The formation of the contact-pair between two spheres each having a radius of ra will cause a reduction of the molecular surface area of the alkyl and phenyl groups. This reduction will be represented by the parameter f which is a fraction of the area of the alkyl hemisphere. The alkyl–phenyl contact pair will be represented by two free spheres each having a molecular surface area51 of S1a defined as:
| | | S1a = 4πra2 − 2πra2 × f | (21) |
The effective radius of the two free spheres will be:
| |  | (21a) |
Therefore, changes in the Δ
Gcavity as a function of urea concentration can be represented as:
| | 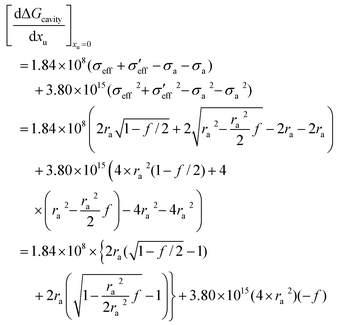 | (22) |
If one applies a Taylor series approximation to a first order in
f:
| | 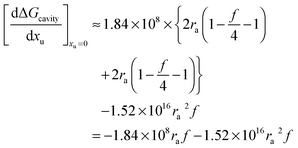 | (23) |
From
eqn (20) we obtain:
| | 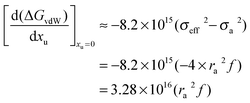 | (24) |
Leading to:
| |  | (25) |
Eqn (25) predicts how urea will affect the formation of hydrophobic contact pairs in aqueous solution. If we use
eqn (25) to define the following derivative:
| |  | (26) |
we obtain the following equation from
eqn (11a):
| |  | (27) |
Table 2 lists the values of

obtained from
Fig. 3. In
Fig. 4a
is plotted as a function of alkyl radius. The data fit the following quadratic equation with an
r2 value of 0.988:
| |  | (28) |
Because there are no points close to the minimum of the quadratic, the uncertainties in the first and second quadratic coefficients are large. However, we can rearrange
eqn (27) into the following linear form:
| |  | (29) |
As seen in
Fig. 4b
can be correlated linearly with alkyl radius (
r2 = 0.979):
| |  | (30) |
The coefficients of
eqn (30) can be used to calculate the
f parameters, two values
f = 0.12 and
f = 0.33 are obtained. This disparity between
f values is to be expected. The second-order terms in
eqn (15) and (23) are closely related to the surface work,
64 and are therefore expected to be less dependent upon how the geometry of the contact-pair is modeled as long as the change in surface area is accounted for correctly. However, the first order term is related to the curvature of the contact-pair
64 and should be very sensitive to how the contact-pair geometry is defined. Our suggested model of the contact-pair does indeed underestimate the difference in surface curvature between free hydrophobic solutes and the contact pair; this may cause the value of
f calculated from the first coefficient to be somewhat larger than reality.
Table 2 Values of the  obtained from Fig. 4
| Salt | 
|
|---|
| Acetate | −0.568 ± 0.01 |
| Propionate | −0.416 ± 0.006 |
| Butyrate | −0.211 ± 0.004 |
| Hexanoate | −0.066 ± 0.001 |
| Heptanoate | 0.290 ± 0.006 |
| Octanoate | 0.77 ± 0.02 |
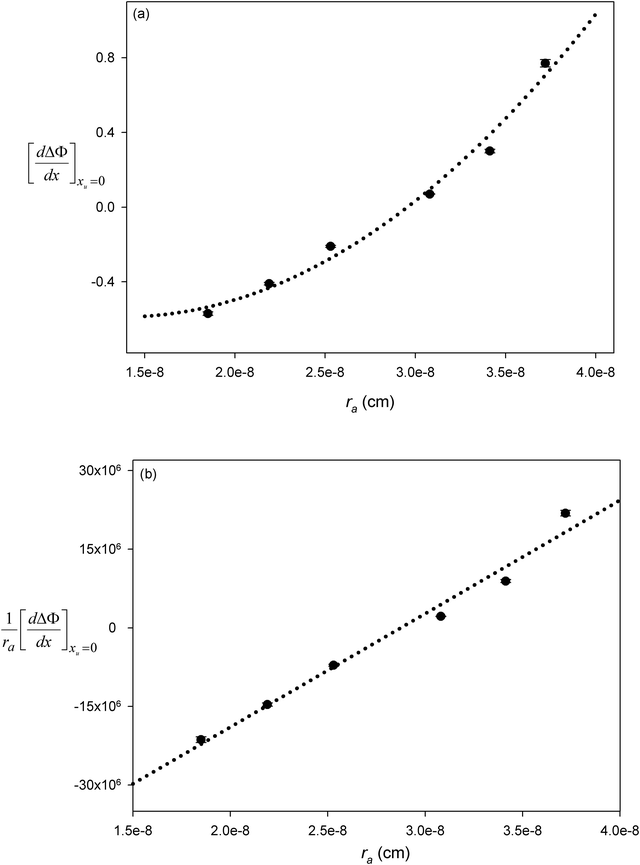 |
| | Fig. 4 The dependence of the parameters  (panel a), and (panel a), and  (panel b) on the molecular radius of the hydrophobic solute ra; the molecular radii are either reported or extrapolated from ref. 61. (panel b) on the molecular radius of the hydrophobic solute ra; the molecular radii are either reported or extrapolated from ref. 61. | |
The geometry of the contact-pair notwithstanding, our data are “well-behaved” and show good correlation as demonstrated in Fig. 4. The second-order coefficient of eqn (30) is positive, resulting from the dominant contribution of van der Waals interactions between urea and the non-polar groups. While the negative first-order coefficient indicates that the addition of urea increases the work required to create a solute accommodating cavity in solution, indicating that the effect of urea on hydrophobic contact pair formation can be represented thermodynamically as a sum of the effects that urea has on the free energies of cavity formation and van der Waals interactions. Based on eqn (30) van der Waals interactions dominate at radii greater than 2.87 Å, while at smaller radii cavity formation considerations dominate. Our data thus show behavior that is consistent with the theoretical calculations that consider the opposing effects on cavity formation and van der Waals interactions.32,33,48,62
4. Conclusions
This work demonstrates that even at the limit of infinite dilution, urea affects the interaction of hydrophobic solutes with one another. At such low concentrations the solution can be considered to be ideal. On the other hand, at the same low concentrations, the addition of urea perturbs the solvent packing density (ξ) by increasing its value. This increase in ξ increases both the energetic cost of cavity formation in the aqueous solvent, thereby promoting the hydrophobic effect, and also the solvent–solute van der Waals interactions with the non-polar molecules and helps solvate them, thereby decreasing the hydrophobic effect. The sum of these two effects explains how urea influences solute contact-pair formation: for small solutes the addition of urea enhances the probability of hydrophobic contact-pair formation (cavity formation dominates the free energy), while the addition of urea helps solvate larger hydrophobes and helps decrease the probability of hydrophobic contact pair formation within an aqueous environment (van der Waals interactions dominate the free energy). At higher concentrations of urea, issues such as direct contact interactions between urea and the hydrophobic solute,6,16 and solvent non-ideality come into play, but these issues do not qualitatively affect the interpretation. One advantage of this interpretation is that it does not require postulating urea-induced structural perturbations in the aqueous solvent in order to explain the effect of urea on hydrophobic contact-pair formation. In fact, based on experimental evidence,17,18 at low to moderate concentrations of urea the hydrogen bonding network of the solvent seems to remain intact. Our work demonstrates that even at the dilution limit the addition of urea affects hydrophobic interactions and this influence is dependent upon the size of the hydrophobes involved. Our results also demonstrate how pair-wise hydrophobic interactions differ from bulk hydrophobic interactions in their response to urea. Urea significantly helps solubilize all but the very smallest hydrophobes in water. From a protein folding standpoint this results in facilitating the transfer of hydrophobic residues from the protein interior to the aqueous solvent. However, comparing the effects of urea on the free energy of hydrophobic contact formation to the free energies of theoretically calculated solvent transfer data6,16 indicates that the formation of hydrophobic contact-pairs seems to be less susceptible to urea-induced disruption. In fact, based on Fig. 4, the addition of urea seems to enhance the formation of hydrophobic contact-pairs between molecular spheres having radii smaller than 2.87 Å. To put this dimension in perspective, it may be useful to remember that butyl groups have a radius of ∼2.82 Å.62 From this one may conclude that the addition of urea to the solvent promotes hydrophobic contact-pairs involving alanine and valine groups, while the same addition of urea may have minimal effect on hydrophobic interactions involving leucine and isoleucine. In contrast, interactions between bulky aromatic groups in water are disrupted by the addition of urea. This may explain why some protein residues participating in hydrophobic interactions are able to still maintain these interactions in the urea-denatured state and provide the reason for the stability of more compact geometries in the urea denatured state.Acknowledgements
The authors gratefully acknowledge many informative discussions with Professors Joe O'Neil and Georg Schreckenbach (University of Manitoba) regarding this manuscript. This work was supported in part by the University of Manitoba UMRG.References
- D. W. Bolen and G. D. Rose, Annu. Rev. Biochem., 2008, 77, 339–362 CrossRef CAS.
- Y. Zhang and P. S. Cremer, Annu. Rev. Phys. Chem., 2010, 63–83 CrossRef , Annual Reviews Inc.
- A. Das and C. Mukhopadhyay, J. Phys. Chem. B, 2009, 113, 12816–12824 CrossRef CAS.
- B. J. Bennion and V. Daggett, Proc. Natl. Acad. Sci. U. S. A., 2003, 100, 5142–5147 CrossRef CAS.
- W. K. Lim, J. Rosgen and S. W. Englander, Proc. Natl. Acad. Sci. U. S. A., 2009, 106, 2595–2600 CrossRef CAS.
- W. Li, R. Zhou and Y. Mu, J. Phys. Chem. B, 2012, 116, 1446–1451 CrossRef CAS.
- E. J. Guinn, L. M. Pegram, M. W. Capp, M. N. Pollock and M. T. Record, Jr., Proc. Natl. Acad. Sci. U. S. A., 2011, 108, 16932–16937 CrossRef CAS.
- J. Heyda, M. Kozisek, L. Bednarova, G. Thompson, J. Konvalinka, J. Vondrasek and P. Jungwirth, J. Phys. Chem. B, 2011, 115, 8910–8924 CrossRef CAS.
- A. C. Miklos, C. Li, N. G. Sharaf and G. J. Pielak, Biochemistry, 2010, 49, 6984–6991 CrossRef CAS.
- S. Lee, Y. L. Shek and T. V. Chalikian, Biopolymers, 2010, 93, 866–879 CrossRef CAS.
- L. Ma, L. Pegram, M. T. Record and Q. Cui, Biochemistry, 2010, 49, 1954–1962 CrossRef CAS.
- D. R. Canchi, D. Paschek and A. E. Garcia, J. Am. Chem. Soc., 2010, 132, 2338–2344 CrossRef CAS.
- C. N. Pace, B. M. P. Huyghues-Despointes, H. Fu, K. Takano, J. M. Scholtz and G. R. Grimsley, Protein Sci., 2010, 19, 929–943 CrossRef.
- F. Vanzi, B. Madan and K. Sharp, J. Am. Chem. Soc., 1998, 120, 10748–10753 CrossRef CAS.
- X. Chen, L. B. Sagle and P. S. Cremer, J. Am. Chem. Soc., 2007, 129, 15104–15105 CrossRef CAS.
- R. Zangi, R. Zhou and B. J. Berne, J. Am. Chem. Soc., 2009, 131, 1535–1541 CrossRef CAS.
- K. A. Sharp, B. Madan, E. Manas and J. M. Vanderkooi, J. Chem. Phys., 2001, 114, 1791–1796 CrossRef CAS.
- Y. L. A. Rezus and H. J. Bakker, Proc. Natl. Acad. Sci. U. S. A., 2006, 103, 18417–18420 CrossRef CAS.
- D. Horinek and R. R. Netz, J. Phys. Chem. A, 2011, 115, 6125–6136 CrossRef CAS.
- J. D. Batchelor, A. Olteanu, A. Tripathy and G. J. Pielak, J. Am. Chem. Soc., 2004, 126, 1958–1961 CrossRef CAS.
- M. M. Thayer, R. C. Haltiwanger, V. S. Allured, S. C. Gill and S. J. Gill, Biophys. Chem., 1993, 46, 165–169 CrossRef CAS.
- H. Schoenert and L. Stroth, Biopolymers, 1981, 20, 817–831 CrossRef CAS.
- O. D. Bonner, J. M. Bednarek and R. K. Arisman, J. Am. Chem. Soc., 1977, 99, 2898–2902 CrossRef CAS.
- L. M. F. Holthauzen, J. Roesgen and D. W. Bolen, Biochemistry, 2010, 49, 1310–1318 CrossRef CAS.
- H. Patel, G. Raval, M. Nazari and H. Heerklotz, Biophys. Chem., 2010, 150, 119–128 CrossRef CAS.
- H. Raghuraman, S. K. Pradhan and A. Chattopadhyay, J. Phys. Chem. B, 2004, 108, 2489–2496 CrossRef CAS.
- L. Costantino, G. D'Errico, P. Roscigno and V. Vitagliano, J. Phys. Chem. B, 2000, 104, 7326–7333 CrossRef CAS.
- Y. Feng, Z.-W. Yu and P. J. Quinn, Chem. Phys. Lipids, 2002, 114, 149–157 CrossRef CAS.
- A. Walter, G. Kuehl, K. Barnes and G. VanderWaerdt, Biochim. Biophys. Acta, Biomembr., 2000, 1508, 20–33 CrossRef CAS.
- N. Muller, J. Phys. Chem., 1990, 94, 3856–3859 CrossRef CAS.
- D. B. Wetlaufer, S. K. Malik, L. Stoller and R. L. Coffin, J. Am. Chem. Soc., 1964, 86, 508–514 CrossRef CAS.
- G. Graziano, J. Phys. Chem. B, 2001, 105, 2632–2637 CrossRef CAS.
- G. Graziano, Can. J. Chem., 2002, 80, 388–400 CrossRef CAS.
- R. H. Wood and P. T. Thompson, Proc. Natl. Acad. Sci. U. S. A., 1990, 87, 946–949 CrossRef CAS.
- S. Shimizu and H. S. Chan, Proteins: Struct., Funct., Genet., 2002, 49, 560–566 CrossRef CAS.
- R. Beal, Q. Deveraux, G. Xia, M. Rechsteiner and C. Pickart, Proc. Natl. Acad. Sci. U. S. A., 1996, 93, 861–866 CrossRef CAS.
- A. G. Cochran, N. J. Skelton and M. A. Starovasnik, Proc. Natl. Acad. Sci. U. S. A., 2001, 98, 5578–5583 CrossRef CAS.
- L. C. Tisi and P. A. Evans, J. Mol. Biol., 1995, 249, 251–258 CrossRef CAS.
- P. Lijnzaad, K. A. Feenstra, J. Heringa and F. C. P. Holstege, Proteins: Struct., Funct., Bioinf., 2008, 72, 105–114 CrossRef CAS.
- Y. S. Yun, G. H. Nam, Y.-G. Kim, B.-H. Oh and K. Y. Choi, FEBS J., 2005, 272, 1999–2011 CrossRef CAS.
- J. Funahashi, K. Takano, Y. Yamagata and K. Yutani, Biochemistry, 2000, 39, 14448–14456 CrossRef CAS.
- A. Soranno, R. Longhi, T. Bellini and M. Buscaglia, Biophys. J., 2009, 96, 1515–1528 CrossRef CAS.
- S. Miyazawa and R. L. Jernigan, Protein Eng., 1994, 7, 1209–1220 CrossRef CAS.
- C. L. Pashley, G. J. Morgan, A. P. Kalverda, G. S. Thompson, C. Kleanthous and S. E. Radford, J. Mol. Biol., 2012, 416, 300–318 CrossRef CAS.
- F. Huang, E. Lerner, S. Sato, D. Amir, E. Haas and A. R. Fersht, Biochemistry, 2009, 48, 3468–3476 CrossRef CAS.
- R. Sarma and S. Paul, J. Phys. Chem. B, 2012, 116, 2831–2841 CrossRef CAS.
- R. Sarma and S. Paul, J. Chem. Phys., 2011, 135, 174501–174513 CrossRef.
- M. Ikeguchi, S. Nakamura and K. Shimizu, J. Am. Chem. Soc., 2001, 123, 677–682 CrossRef CAS.
- M.-E. Lee and D. V. N. F. A. Van, J. Am. Chem. Soc., 2006, 128, 4948–4949 CrossRef CAS.
- A. Wallqvist, D. G. Covell and D. Thirumalai, J. Am. Chem. Soc., 1998, 120, 427–428 CrossRef CAS.
- R. M. Jackson and M. J. E. Sternberg, Protein Eng., 1994, 7, 371–383 CrossRef CAS.
- D. L. Beauchamp and M. Khajehpour, Biophys. Chem., 2012, 163–164, 35–43 CrossRef CAS.
- D. K. Kunimitsu, A. Y. Woody, E. R. Stimson and H. A. Scheraga, J. Phys. Chem., 1968, 72, 856–866 CrossRef CAS.
- A. Y. Moon, D. C. Poland and H. A. Scheraga, J. Phys. Chem., 1965, 69, 2960–2966 CrossRef CAS.
- J. R. Lakowicz, Principles of Fluorescence Spectroscopy, Springer, New York, 3rd edn, 2006 Search PubMed.
- J. I. Steinfeld, J. S. Francisco and W. L. Hase, Chemical Kinetics Dynamics, Upper Saddle River, NJ, 2nd edn, 1999 Search PubMed.
- B. J. Siwick, M. J. Cox and H. J. Bakker, J. Phys. Chem. B, 2008, 112, 378–389 CrossRef CAS.
- D. Trzesniak, D. V. N. F. A. Van and G. W. F. Van, Mol. Phys., 2007, 105, 33–39 CrossRef CAS.
- D. V. N. F. A. Van, M.-E. Lee, D. Trzesniak and G. W. F. Van, J. Phys. Chem. B, 2006, 110, 12852–12855 Search PubMed.
- H. A. Yu and M. Karplus, J. Chem. Phys., 1988, 89, 2366–2379 CrossRef CAS.
- B. Lee, Biophys. Chem., 1994, 51, 271–278 CrossRef CAS.
- G. Graziano, J. Chem. Soc., Faraday Trans., 1998, 94, 3345–3352 RSC.
- K. Itoh and R. Holroyd, J. Phys. Chem., 1990, 94, 8850–8854 CrossRef CAS.
- A. J. Saunders, P. R. Davis-Searles, D. L. Allen, G. J. Pielak and D. A. Erie, Biopolymers, 2000, 53, 293–307 CrossRef CAS.
|
| This journal is © the Owner Societies 2013 |
Click here to see how this site uses Cookies. View our privacy policy here. 


 ,
,  and
and  depend on the nature of solvent. The parameter ξ is the volume packing density of the solvent
  ; v1 is the molar volume of the solvent, P is the hydrostatic pressure over the solvent, R is the gas constant, T is the temperature and NAV is the Avogadro constant; σ2 is the solute molecular diameter and σ1 is the solvent molecular diameter. We define the function ΔGcavity which is the difference between the work of cavity formation for the alkyl–phenyl contact pair and the work of cavity formation for the separated groups:


 where ra and rb represent the radii of the alkyl and phenyl groups respectively.62,63 In this case, forming a contact pair carves out equal surfaces on the alkyl and phenyl moieties that are solvent inaccessible. We will now model the alkyl–phenyl contact pair as the following simple case.


 obtained from Fig. 3. In Fig. 4a
 is plotted as a function of alkyl radius. The data fit the following quadratic equation with an r2 value of 0.988:

 can be correlated linearly with alkyl radius (r2 = 0.979):
 obtained from Fig. 4

 (panel a), and
  (panel b) on the molecular radius of the hydrophobic solute ra; the molecular radii are either reported or extrapolated from ref. 61.
