An orthorhombic Mo3VOx catalyst most active for oxidative dehydrogenation of ethane among related complex metal oxides†
Takeshi
Konya
a,
Tomokazu
Katou
a,
Toru
Murayama
a,
Satoshi
Ishikawa
a,
Masahiro
Sadakane
b,
Douglas
Buttrey
c and
Wataru
Ueda
*a
aCatalysis Research Center, Hokkaido University, N-21, W-10, Sapporo 001-0021, Japan. E-mail: ueda@cat.hokudai.ac.jp; Fax: +81 11 706 9163; Tel: +81 11 706 9164
bChemistry and Chemical Engineering, Department of Engineering, Hiroshima University, 1-4-1 Kagamiyama, Higashi-Hiroshima 739-8527, Japan. E-mail: sadakane09@hiroshima-u.ac.jp; Fax: +81 82 424 5494; Tel: +81 82 424 4456
cCenter for Catalytic Science and Technology, Department of Chemical Engineering, University of Delaware, Newark, DE 19716, USA. E-mail: dbuttre@udel.edu; Fax: +1 302 831 1048; Tel: +1 302 831 2034
First published on 30th August 2012
Abstract
Four distinct structural types (orthorhombic, trigonal, tetragonal and amorphous) of Mo3VOx catalyst were each synthesized by a hydrothermal method as a single phase, characterized structurally and tested for oxidative dehydrogenation of ethane. A common structural feature of the catalysts is that the materials are a layer-type structure and constructed with pentagonal {Mo6O21} units. The arrangement of the pentagonal units can form heptagonal channels to create different structural features. The orthorhombic Mo3VOx catalyst has microporosity due to the open heptagonal channels adsorbing nitrogen molecules and showed the highest activity for the reaction among four distinct catalysts. Furthermore, this phase appeared to be most active, currently, compared to other complex metal oxide catalysts reported. An observed positive relation between the microporosity and the oxidation activity suggests that the catalytic oxidation takes place at the heptagonal channels.
1. Introduction
There are many types of complex metal oxide catalysts active for the oxidative dehydrogenation of ethane to ethene. These can be classified roughly into three categories.1–3 The first is oxide catalysts constructed mainly with metal oxides possessing a solid-base property and showing oxidation activity at high temperatures of more than 500 °C. The second is oxide catalysts containing group 8 elements and exhibiting high reaction rate at relatively low temperatures of around 400 °C. The third is catalysts consisting of group 5 and 6 metal oxides and active at lower temperatures, even around 300 °C.The catalysts in the first category are, for example, MgO-based mixed oxides,4,5 rare earth metal oxides,6,7 and oxyhalides8,9 particularly oxychlorides.1 These catalysts tend to show very high selectivity to ethene at high ethane conversion because the catalysts themselves do not have high intrinsic catalytic oxidation ability, which is the reason why the catalyst needs high reaction temperatures. The second catalysts, representatively Ni–Nb–O,10 have recently emerged and their catalytic activity apparently depends on the nature and state of group 8 elements11 since simple oxides of group 8 elements are usually very active for ethane oxidation but non-selective.
The catalysts in the third category also have a wide variety of oxide catalyst systems but in many cases contain V as a key element.3 In this category the Mo–V–O complex oxide system has been recognized as the most promising for application.12 This catalyst has interesting and long history of development, which dates back to the report by Thorsteinson in 1978.13 They found that Mo–V–O showed high ethane oxidation activity even at temperatures lower than 300 °C only when the catalysts gave an XRD peak at 22° (Cu Kα). They also found that Nb was the most effective additive element. Since this report, there has been, however, no appreciable progress in this catalyst system for ethane oxidation. Meanwhile catalysts in which Te or Sb was added to Mo–V–Nb–O have been developed by Mitsubishi Chemicals for propane ammoxidation.14 The catalyst also gave an XRD peak at 22° (Cu Kα) and more importantly is a crystalline material formed, so-called M1 structure, which is iso-structural of orthorhombic Mo3VOx materials dealt with in the present study. After this discovery much attention has been paid to this catalyst system not only for propane oxidation but also for ethane oxidation. Eventually Mo–V–Te–Nb–O was found to show 87% conversion of ethane with 84% selectivity to ethene at 400 °C15 and Mo–V–Sb–O also showed similar catalytic performance.16 Presently, there is no doubt that the catalytic materials found by Thorsteinson are of Mo–V–Te–Nb–O type. The main concern still remaining about this catalytic system is whether Te, Sb, and Nb are necessary elements in the course of ethane oxidation or not. We have recently succeeded in synthesizing a well-crystallized, single phasic orthorhombic Mo3VOx17–20 and found that this catalyst showed extremely high activity for the oxidative dehydrogenation of ethane, which is better than that of the Mo–V–Te–Nb–O catalysts. This result clearly indicates that the elements other than Mo and V are not essential but the structure formation is more important.
Here in this report we investigate the genesis of such high oxidation activity of the orthorhombic Mo3VOx catalyst by comparing four distinct types of Mo3VOx catalyst with different crystal structures.
2. Experimental
2.1 Synthesis of orthorhombic Mo3VOx
Orthorhombic Mo3VOx materials were synthesized by a hydrothermal method. To an aqueous solution of (NH4)6Mo7O24, an aqueous solution of VOSO4 was added dropwise at ambient temperature with stirring and then the obtained mixed solution (the concentration of Mo was 0.2 mol L−1 and Mo/V = 4) was introduced into an autoclave with a Teflon inner tube and enough Teflon thin sheet to occupy about half of the Teflon inner tube space. This sheet is important to get a well-crystallized sample. After the introduction, N2 was fed into the solution in the tube in order to remove residual oxygen. At this stage, the pH of the solution was 3.2. Then the hydrothermal reaction was started at 175 °C for 48 h under static conditions in an electric oven. Gray solids formed on the Teflon sheet were separated by filtration, washed with distilled water, and dried in air at 80 °C overnight. Since this sophisticated synthetic method still formed amorphous type materials as an impurity phase, the dried sample was treated with oxalic acid for purification. To 25 mL aqueous solution (10 mmol L−1, 60 °C) of oxalic acid, 1 g of the dried material was added and the dispersion was stirred for 30 min, followed by filtration, washing, and drying at 80 °C overnight. The material was ground with an agate motor for 5 min and then heat-treated in a nitrogen stream (50 mL min−1) at a heating ramp of 10 °C min−1 to 400 °C and kept at this temperature for 2 h before characterization and catalytic testing. By this heat-treatment, NH4+ exited in the heptagonal channel could be removed as NH3 as well as water at the same time, which was confirmed by TPD analysis (Multi-task T. P. D with Q-MASS detector, Nippon BELL).2.2 Synthesis of trigonal Mo3VOx
Almost the same synthetic procedure was applied to the synthesis of trigonal Mo3VOx except for the Mo compound used, pH condition and duration of hydrothermal synthesis. In order to better obtain the trigonal phase, the concentration of ammonium cations per Mo in the hydrothermal solution was found to be lowered compared to that for the synthesis of the orthorhombic Mo3VOx. (NH4)8Mo10O24 was thus used, which was obtained by heat-treating (NH4)6Mo7O24 in air at 150 °C for 5 h. The pH of the mixed solution was adjusted to be 2.2 by adding sulphuric acid (2 mol L−1). The hydrothermal synthesis time was 20 h.2.3 Synthesis of amorphous Mo3VOx
As described later, Mo3VOx material well-crystallized in the c-direction but disordered in the other direction can be obtained when the concentration of the mixed aqueous solution was twice high. Here in this paper this material is designated as amorphous Mo3VOx. The other preparatory conditions were the same as those for the orthorhombic Mo3VOx.2.4 Synthesis of tetragonal Mo3VOx
Tetragonal Mo3VOx was synthesized by phase transformation from orthorhombic Mo3VOx by heat-treatment as follows. The dried orthorhombic Mo3VOx was heated in air at a heating ramp of 10 °C min−1 to 400 °C and kept at this temperature for 2 h, and then cooled to ambient temperature. This heat-treated sample was again heated in a nitrogen stream (50 mL min−1) at a heating ramp of 10 °C min−1 to 575 °C and kept at this temperature for 2 h.2.5 Characterization
The following analytical methods were applied to determine the structure characteristics and adsorption properties. Typically, the catalysts were ground and calcined in N2 before catalytic tests. SEM was, however, obtained with un-ground samples to show fresh crystal morphology. Similarly, N2 adsorption measurements were conducted using the catalysts calcined in air at 400 °C for 2 h in order to demonstrate microporosity of the catalysts as we found and reported that the microporosity was clearly observed with calcined catalysts in air.21,22 Powder X-ray diffraction (XRD) patterns were collected before and after catalytic tests.Elemental compositions were determined by an inductive coupling plasma (ICP-AES) method (ICPE-9000, Shimadzu). XRD patterns were measured by using an X-ray diffractometer (RINT-Ultima III, Rigaku) with Cu Kα (tube voltage: 40 kV, tube current: 20 mA). Unit cell parameters were refined using the Rietveld program with Materials Studio 5.5.3 (Accelrys). SEM images were taken using an electron microscope (JSM-6360LA, JEOL) and aberration-corrected high-angle annular dark-field (HAADF) STEM operated at an accelerating voltage of 200 kV was used to image the materials with a JEOL 2100F equipped with a Corrected Electron Optical Systems GmBH spherical aberration corrector on the illumination system.23,24 Since the trigonal sample used for the HAADF-STEM analysis was not highly crystallized and various crystal faults and disordered regions were observed in the images, we took an image of the disordered part as for the amorphous sample23 and the image is shown in Fig. 4.
FT-IR spectra were obtained using a spectrometer (Paragon 1000, Perkin Elmer) at room temperature in the range of 500–1100 cm−1. Raman spectra were obtained using a spectrometer (in Via Reflex, Renishaw, 2 cm−1 spectral resolution) under the conditions of 532 nm wavelength and 30 s collection time. N2 adsorption isotherms at liq. N2 temperature were obtained using an auto-adsorption system (BELSORP MAX, Nippon BELL). Surface areas and micropore volumes were determined using a t-plot. Prior to N2 adsorption, the catalysts were evacuated under vacuum at 300 °C for 2 h.
2.6 Catalytic tests
Catalytic oxidative dehydrogenation of ethane in the gas phase was carried out at atmospheric pressure in a conventional vertical flow system with a fixed bed Pyrex tubular reactor. The calcined catalyst with silica diluents was loaded in the middle of the reactor on quartz wool, and the temperature was gradually increased from room temperature at a rate of 10 °C min−1 under nitrogen flow (40 mL min−1) from the top of the reactor. When the desired reaction temperature, measured with a thermocouple in the middle of the catalyst zone, was reached, oxygen and ethane were successively fed in. Typical reaction conditions were as follows: catalyst weight; 0.5 g, reactant gas composition; C2H6/O2/N2 = 10/10/80 (mol%), total flow rate; 50 mL min−1, reaction temperature range of 280 °C to 380 °C. Reactants and products were analyzed with three online gas chromatographs (Molecular sieve 13X for O2, N2 with a TCD detector and CO, Gaskuropack for CO2, C2H4 and C2H6 with a TCD detector, and Porapak Q for acetic acid with a FID detector). Blank runs showed that under the experimental conditions used in this study the homogeneous gas-phase reaction was negligible. Carbon balance was always ca. 96–103%, so that the selectivity listed in the table was calculated on the basis of the product.3. Results and discussion
3.1 Structural comparison of four distinct Mo3VOx
After the hydrothermal synthesis was completed under the conditions for the orthorhombic Mo3VOx and the trigonal one, we observed solid materials on the Teflon sheet, while in the case of the amorphous Mo3VOx synthesis, solids were found at the bottom of the Teflon sheet. These solids gently collected, washed and dried were subject to SEM analysis without grinding in order to observe crystal formation (Fig. 1). All these three samples (Fig. 1(a)–(c)) were long rod-shaped crystals with average diameters in the range of 0.2–0.4 μm (Table 1). This crystal habit clearly suggests a simple elemental arrangement in an axis parallel to the rod and a more complex elemental arrangement in the other axes. Similarly, the tetragonal Mo3VOx crystal prepared by the calcination of the orthorhombic Mo3VOx was also long rod-shaped as can be seen in Fig. 1(d), although the rods were slightly flattened, which occurred during the phase transformation. All these samples were easily broken by grinding to shorter rod crystals because of the crystal habit (Fig. S1, ESI†). Their ground and heat-treated samples are subject to further structural analyses.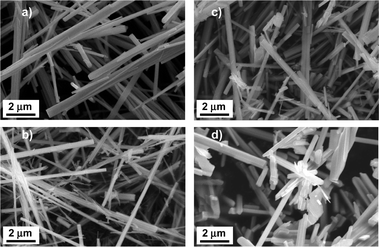 | ||
| Fig. 1 SEM images of orthorhombic (a), trigonal (b), amorphous (c), and tetragonal (d) Mo3VOx. | ||
| Catalyst | Main preparatory conditiona | Average rod | Chemical compositionc | Lattice parameter/nm | ||
|---|---|---|---|---|---|---|
| diameterb/μm | a | b | c | |||
| a For more details, see the Experimental section. b Average of 30–200 crystalline in SEM images. c Determined by ICP-AES. | ||||||
| Orthorhombic Mo3VOx | pH = 3.2 | 0.42 | Mo3.00V0.97Ox | 2.1083 | 2.6569.5 | 0.3997 |
| Trigonal Mo3VOx | pH = 2.2, Mo compound | 0.22 | Mo3.00V0.97Ox | 2.1380 | 2.1380.9 | 0.3994 |
| Amorphous Mo3VOx | High concentration | 0.39 | Mo3.00V1.15Ox | — | — | 0.3996 |
| Tetragonal Mo3VOx | Heat-treatment | 0.82 | Mo3.00V1.15Ox | 2.2847 | 2.2847 | 0.3958 |
Fig. 2 shows XRD patterns of four catalysts, calcined and used for the catalytic reaction. Two diffraction peaks at 22° and 45° were commonly observed for all the samples, indicating that the materials are all of a layered-type structure with the same layer lattice distance of about 0.4 nm. Since the SEM image showed the same crystal shape (Fig. 1), crystal growth by layer stacking took place in the direction parallel to the rod, giving two clear common diffraction peaks which can correspond to 001 and 002 reflections by taking the c-axis parallel to the rod. From these peaks, c lattice parameters were calculated and are listed in Table 1. As expected, four samples have almost similar values at around 0.399 nm.
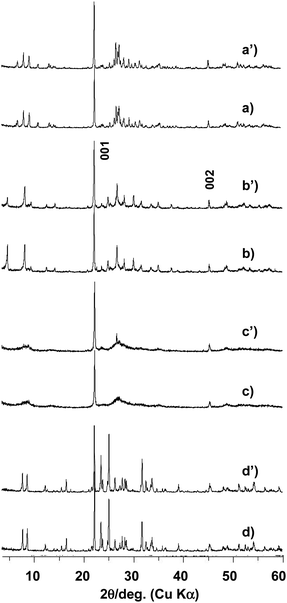 | ||
| Fig. 2 XPD patterns of orthorhombic (a), trigonal (b), amorphous (c), and tetragonal (d) Mo3VOx catalysts heat-treated (lower) and used for catalysis (upper). | ||
Characteristic diffraction peaks depending on the catalysts were observed at the low angle region less than 10°. The appearance of the peaks indicates crystals with large a and b lattice parameters which were calculated by Rietveld refinement and are listed in Table 1 except for the amorphous Mo3VOx. The amorphous Mo3VOx gave only a very broad peak at the low angle region, which obviously indicates that the material is not fully crystallized. Since the SEM image (Fig. 1(c)) shows uniform rod-shaped materials, the rod materials appear to be crystallized in the c-direction along the rod but are not orderly crystallized both in a- and b-directions, which can satisfy the observed XRD diffraction in Fig. 2c.
All the samples were found to be stable by XRD after the catalytic test, although slight changes in peak positions and in relative peak intensities were observed, particularly those at the low angle region. We have reported that the lattice parameters depend on the reduced state of the samples.22 On the other hand, we consider that the change of the relative peak intensity is due to a structural deformation and therefore, further investigation on this phenomenon is now underway.
Structure similarities among four materials were further exemplified by elemental analysis, FT-IR and Raman spectroscopy. Chemical compositions were determined by ICP-AES after dissolution of the samples in aqueous ammonia solution and the results are listed in Table 1. The compositions of the orthorhombic, trigonal, amorphous and tetragonal materials were determined to be Mo3.00V0.97Ox, Mo3.00V0.97Ox, Mo3.00V1.15Ox and Mo3.00V1.15Ox, respectively. The amorphous and tetragonal materials are obviously V-rich. Although the reason is unclear at the present stage, excess accommodation of V in the lattice of the amorphous material and some loss of Mo during the phase transformation of the orthorhombic material seem to be possible reactions. Nevertheless, it appears that the chemical composition among four materials is not dissimilar.
FT-IR and Raman spectroscopic investigation provides more atomic level information. The obtained spectra are summarized in Fig. 3. In FT-IR spectra, bands at 915 cm−1 ascribable to V![[double bond, length as m-dash]](https://www.rsc.org/images/entities/char_e001.gif) O, 870 cm−1 for Mo
O, 870 cm−1 for Mo![[double bond, length as m-dash]](https://www.rsc.org/images/entities/char_e001.gif) O, 817, 716 and 652 cm−1 for Mo–O–Mo and 604 cm−1 for V–O–Mo were observed for all the samples and additional bands at 789 and 572 cm−1 were observed only for the tetragonal sample. Similarly, in Raman spectra, the main band at 870 cm−1 was observed for all the samples. Furthermore, this main band was associated with a few bands in the cases of the orthorhombic, trigonal and amorphous samples but less in the case of the tetragonal sample. As Raman bands similar to these main bands were observed for polyoxometalates like {[K10Mo72V30O282(H2O)56(SO4)12]26−}25,26, {[Mo132O372(H2O)72(CH3CO2)30]42−}27 and {[H3Mo57V6(NO)6O183(H2O)18]21−}28 all of which were constructed by a linkage of the pentagonal {Mo6O21} building units, the Raman bands observed for the Mo3VOx materials clearly exhibit the presence of the pentagonal {Mo6O21} units in each lattice, which is also a common structural feature of all the samples. However, the tetragonal material appears to contain different metal–oxygen bonds because the FT-IR and the Raman spectra of the tetragonal material were different from the others. Conversely, it is notable that the FT-IR and the Raman spectra are comparable among the orthorhombic, trigonal and amorphous samples, revealing that the structural features of the amorphous material are close to that of the orthorhombic sample, but with disordered pentagonal {Mo6O21} units arranged in the a- and b-directions.29 In other words, the amorphous phase is not like the tetragonal phase, which is an important conclusion as for many years the amorphous phase has been considered to be similar to the tetragonal phase in the study of acrolein oxidation to acrylic acid.30
O, 817, 716 and 652 cm−1 for Mo–O–Mo and 604 cm−1 for V–O–Mo were observed for all the samples and additional bands at 789 and 572 cm−1 were observed only for the tetragonal sample. Similarly, in Raman spectra, the main band at 870 cm−1 was observed for all the samples. Furthermore, this main band was associated with a few bands in the cases of the orthorhombic, trigonal and amorphous samples but less in the case of the tetragonal sample. As Raman bands similar to these main bands were observed for polyoxometalates like {[K10Mo72V30O282(H2O)56(SO4)12]26−}25,26, {[Mo132O372(H2O)72(CH3CO2)30]42−}27 and {[H3Mo57V6(NO)6O183(H2O)18]21−}28 all of which were constructed by a linkage of the pentagonal {Mo6O21} building units, the Raman bands observed for the Mo3VOx materials clearly exhibit the presence of the pentagonal {Mo6O21} units in each lattice, which is also a common structural feature of all the samples. However, the tetragonal material appears to contain different metal–oxygen bonds because the FT-IR and the Raman spectra of the tetragonal material were different from the others. Conversely, it is notable that the FT-IR and the Raman spectra are comparable among the orthorhombic, trigonal and amorphous samples, revealing that the structural features of the amorphous material are close to that of the orthorhombic sample, but with disordered pentagonal {Mo6O21} units arranged in the a- and b-directions.29 In other words, the amorphous phase is not like the tetragonal phase, which is an important conclusion as for many years the amorphous phase has been considered to be similar to the tetragonal phase in the study of acrolein oxidation to acrylic acid.30
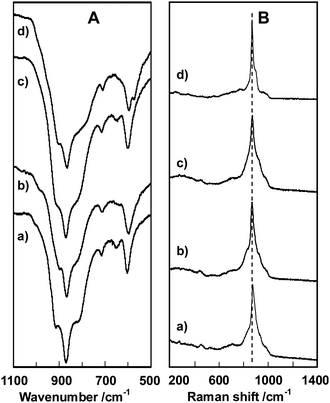 | ||
| Fig. 3 FT-IR (A) and Raman (B) spectra of orthorhombic (a), trigonal (b), amorphous (c), and tetragonal (d) Mo3VOx catalysts. | ||
All the above structural characterizations were fully confirmed by HAADF-STEM images23,24 shown in Fig. 4 along with structure models for the four samples. The first clear point from the images is that the pentagonal {Mo6O21} units are visible in the a–b plane of all the materials and arranged in different manners forming different pentagonal unit network structures. The second point is that the image contrast of the pentagonal {Mo6O21} unit parts is brightest compared to that of the other structural parts, which strongly supports that the pentagonal unit is constructed with Mo only and the other octahedra in the structures contain V as well as Mo. The third point, which seems to be most important, is that in the images in Fig. 4(a), (b) and (d) two dark spots with different sizes, large and small, are visible and correspond to two structural units; the heptagonal channel and the hexagonal channel, respectively. In the tetragonal material, the dark spot due to the heptagonal channel was not observed. The final point is that the contrast at the heptagonal channel was dark, meaning that there are no elements present and the channel is empty. This observation is related to microporosity of the materials that will be described in the next section.
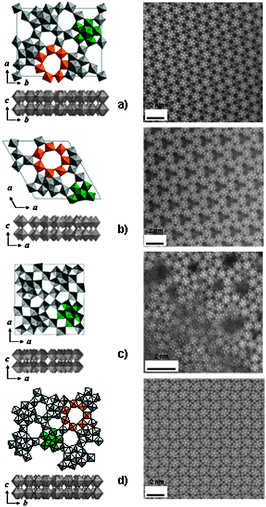 | ||
| Fig. 4 Structures model (left) and HAADF-STEM images (right) of orthorhombic (a), trigonal (b), amorphous (c), and tetragonal (d) Mo3VOx. | ||
By referring to the structural models shown in Fig. 4, the structural information obtained can be summarized as follows:
(1) All four Mo3VOx materials possessing similar chemical compositions assume the same layer-type structure in the c-direction and form a long-rod shaped crystal.
(2) All four Mo3VOx materials contain the same building units, pentagonal {Mo6O21} units.
(3) The overall crystal structure is determined by the network arrangement of the pentagonal {Mo6O21} units in the a–b plane.
(4) The orthorhombic, trigonal and amorphous Mo3VOx are classified into similar structure-type groups but the tetragonal Mo3VOx is excluded because the former materials contain the empty heptagonal channels but the latter does not.
3.2 Microporosity
The most important structural character of the Mo3VOx materials is that the heptagonal channel is empty as described above. The channel pore size was calculated to be ca. 0.4 nm in diameter on the basis of the crystal data of the orthorhombic Mo3VOx. Microporosity is, therefore, expected. We have already reported that the orthorhombic Mo3VOx oxidized in air at 673 K showed N2 adsorption at a relative pressure P/P0 lower than 1.0 × 10⁻⁵, revealing microporosity. The microporosity was further confirmed by a molecular probe method using CO2, Kr, CH4, C2H6, C3H8 and C4H10 at room temperature. CO2, Kr, and CH4 adsorbed into the pores and C2H6 adsorbed moderately but no adsorption of C3H8 and C4H10 was observed and the kinetic pore diameter was determined to be 0.39 nm which strongly coincides with the calculated value.21 Apparently the orthorhombic Mo3VOx material is a zeolite-type crystalline material which is constructed with octahedra.Here we measured microporosity of four distinct Mo3VOx materials for comparison and the results are illustrated in Fig. 5. By using N2 adsorption isotherms, micropore volume and external surface area were calculated from the t-plot (Table 2). As can be seen in Fig. 5, the trigonal phase also showed N2 adsorption at low relative pressure as the orthorhombic material did. It is apparent that the trigonal material has microporosity, which is natural because of the structure. However, the adsorption capacity was determined to be low compared to that of the orthorhombic material as listed in Table 2. From the structural point of view, both the materials should show a similar micropore volume per gram. The observed difference presumably results from partial occupation of the heptagonal channel of the trigonal material by additionally accommodated octahedra. This consideration is partly supported by the fact that the site occupancy at three-membered octahedral sites in the middle of three heptagonal channels is low, as evidently shown by dark contrast at this site in the HAADF-STEM images (Fig. 4b). This result indicates that the three membered-octahedra in this site cannot be stably accommodated and suggests that additional octahedra may exist in heptagonal channels to stabilize near three-membered octahedra. In fact we observed additional octahedra in the heptagonal channels by HAADF-STEM analysis.23
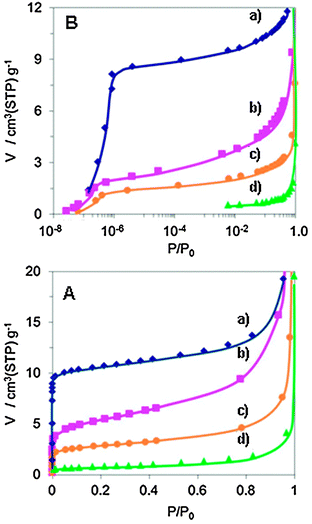 | ||
| Fig. 5 Nitrogen adsorption isotherm ((A) normal P/P0 range, (B) low pressure P/P0 range) of orthorhombic (a), trigonal (b), amorphous (c), and tetragonal (d) Mo3VOx. | ||
| Catalyst | Micropore | External surface areab/m2 g−1 | Conversionc/% | Selectivityc/% | Activation energyd | |||
|---|---|---|---|---|---|---|---|---|
| Volumea/10−3 cm3 g−1 | C2H6 | O2 | C2H4 | COx | CH3COOH | kJ mol−1 | ||
| a Measured by N2 adsorption at liq. N2 temperature and determined by the t-plot. b External surface areas were also determined by the t-plot. c Data at ca. 335 °C under the reaction condition described in the Experimental section. d Activation energy for ethane oxidation. e Catalytic data were collected with a reduced amount of the catalyst (0.1 g). | ||||||||
| Orthorhombic Mo3VOx | 14.0 | 8.2 | 56.0 | 64.8 | 81.8 | 13.5 | 4.7 | 82.1 |
| Orthorhombic Mo3VOxe | — | — | 20.0 | 14.3 | 94.3 | 3.5 | 2.2 | — |
| Trigonal Mo3VOx | 4.0 | 12.4 | 19.6 | 19.3 | 82.7 | 14.9 | 2.3 | 84.7 |
| Amorphous Mo3VOx | 2.8 | 5.7 | 11.4 | 10.9 | 86.7 | 12.3 | 1.0 | 85.0 |
| Tetragonal Mo3VOx | 0 | 2.7 | Tr | 0.3 | — | — | — | — |
The amorphous material had a similar micropore adsorption capacity to the trigonal material. The amount adsorbed is reasonable as the number of empty heptagonal channels in the amorphous sample should be statistically lower than that of the crystallized material. The tetragonal material, which is constructed with the pentagonal unit but without heptagonal channels, showed no micropore adsorption at all. This result supports the inference that the heptagonal channel is responsible for the microporosity.
3.3 Catalytic oxidative dehydrogenation of ethane
The catalytic oxidative dehydrogenation of ethane to ethene over the Mo3VOx catalysts in the gas-phase was carried out and their catalytic performance at each reaction temperature is illustrated in Fig. 6 and their catalytic activity and selectivity at a fixed reaction temperature are summarized in Table 2. The catalysts showed stable oxidation activity (Fig. S2, ESI†) with keeping rod-shape morphology (Fig. S1, ESI†) of the catalyst particles and without any changes in XRD patterns (Fig. 2). The products detected were ethene, acetic acid, and COx over the presently tested catalysts. The highest ethane conversion was achieved on the crystalline orthorhombic Mo3VOx catalyst as can be easily seen in Fig. 6A. At low conversion under low reaction temperatures, the selectivity to ethane over the catalyst was more than 90% and then decreased gradually upon increasing the reaction temperature (Fig. 6B). As described in the Introduction section, one of the most active catalysts ever reported is the Mo–V–Te–Nb–O catalyst giving 87% conversion of ethane with 84% selectivity to ethene at 400 °C and STYC2H4 (×10−3 molC2H4 gcat−1 h−1) under C2H6/O2/He = 30/10/60 were reported to be 5.2 at 340 °C and 9.8 at 380 °C.15 On the other hand, the orthorhombic Mo3VOx catalyst tested here exhibited 11.1 ×10⁻³ molC2H4 gcat−1 h−1 at 335 °C, which is clearly higher than that of the Mo–V–Te–Nb–O catalyst. Since both the catalysts have the same orthorhombic structure, the extremely high ethane oxidation activity observed in both the catalysts is undoubtedly attributable to the structure. Moreover, the present catalytic result evidently demonstrates that the constituents like Te and Nb are not necessary for the oxidation activity.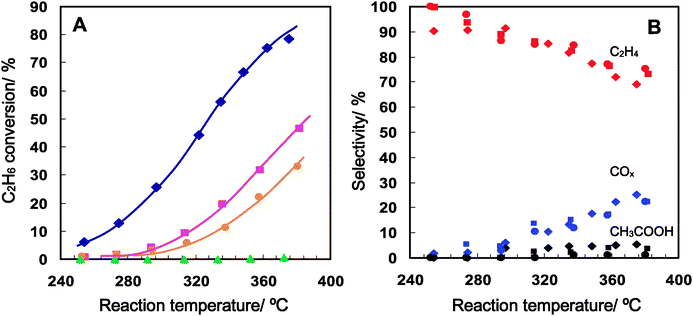 | ||
| Fig. 6 Conversion (A) and selectivity (B) changes as a function of reaction temperature in the oxidative dehydrogenation of ethane over four distinct Mo3VOx catalysts, orthorhombic (lozenges), trigonal (squares), amorphous (circles) and tetragonal (triangles). | ||
The clear effect of the structure can be summarised as follows: unexpectedly, it was found that the trigonal Mo3VOx catalyst showed much less activity than that of the orthorhombic Mo3VOx catalyst, in spite of their similar structures. The amorphous Mo3VOx catalyst also showed far less activity and the tetragonal Mo3VOx catalyst was found to be almost inactive. The catalytic activity difference depending on the catalysts cannot be explained either by the chemical composition (Table 1) or by the difference of the external surface area which is the sum of the minor surface of cross-section and the major surface of the rod wall (Table 2).
The structural character can be said to impart the greatest effect. Both highly active and less active catalysts have the same structural units and the difference is only the arrangement, such that it can be considered whether the materials possess the heptagonal channel or not is determinative for the ethane oxidation activity. Table 2 lists the values of the micropore volume of each catalyst. The value exhibits not only microporosity resulting from the empty heptagonal channels but can also be a rough measure of the amount of the empty heptagonal channel site on the surface of the cross-section of the rods. When this value is taken as the measure, a relationship between the micropore volume and the ethane conversion is clearly observable from the values in Table 2, suggesting that the heptagonal channel plays a crucial role in the course of ethane oxidation.
In terms of selectivity, only a slight difference among the catalysts can be observed in Fig. 6B. Nevertheless, the ethane oxidation was carried out over the orthorhombic Mo3VOx catalyst at a different space velocity. The result is listed in Table 2. The ethane conversion naturally decreased from 56% to 20% upon increasing the space velocity (by decreasing the catalyst amount from 0.5 g to 0.1 g), while the selectivity to ethene increased and the selectivities of COx and acetic acid decreased remarkably. This conversion is comparable to that obtained over the trigonal Mo3VOx catalyst with 0.5 g, while it was found that the ethene selectivity is higher over the orthorhombic catalyst than over the trigonal catalyst. The lower selectivity of the trigonal catalyst might be due to the unstable three-membered octahedra site around the heptagonal channel.
All the above results clearly demonstrate that high-dimensional arrangement of the catalytic components, Mo, V and O, supported by the bulk structures with high crystallinity is responsible for the observed remarkable catalytic activity of the crystalline orthorhombic Mo3VOx for the oxidative dehydrogenation of ethane to ethene. Furthermore, the microporous property brought about by the heptagonal channel seems to significantly contribute to the activation of ethane molecules and also in attaining high ethene selectivity, as ethane is small enough to be adsorbed in the mouth of the heptagonal channel under catalytic reaction conditions. Presumably, the empty heptagonal channel mouth and near distorted octahedra of V and Mo construct catalytic active sites. The former provides an ethane adsorption site to increase the probability of a reaction of ethane with active lattice oxygen in the latter. This situation can explain high activity at low reaction temperatures as categorized in the third group and also high selectivity to ethene due to an electron rich ethene which may not have access to the active site where ethane activation takes place.
4. Conclusion
Four distinct types of Mo3VOx materials were synthesized under hydrothermal conditions and tested for the oxidative dehydrogenation of ethane in order to elucidate the origin of the high catalytic oxidation ability of the orthorhombic Mo3VOx. It was concluded that the origin is derived from high-dimensional structures based on the network arrangement of the pentagonal units with the formation of the heptagonal channel which can accept ethane molecules and distorted octahedra near the channel which may provide active lattice oxygen species. Pronouncedly, Mo3VOx materials with such simple components exhibit extremely high catalytic oxidation ability. This activity is based on the high-dimensional structure and on the thus formed surface catalytic multifunctionality. This prominent example encourages and promotes us to prepare solid-state catalysts with clear structure by advanced methods to create next generation catalysts with a new level performance.References
- W. Ueda and S.-W. Lin, Catalysis, 2000, 35, 3523 Search PubMed.
- F. Cavani and F. Trifiro, Catalysis, 1994, 11, 246 CAS.
- F. Cavani, N. Ballarini and A. Cericola, Catal. Today, 2007, 127, 113 CrossRef CAS.
- E. Morales and J. H. Lunsford, J. Catal., 1989, 118, 255 CrossRef CAS.
- S. Gaab, M. Machli, J. Find, R. K. Grasselli and J. A. Lercher, Top. Catal., 2003, 23, 151 CrossRef CAS.
- V. R. Choudhary and V. H. Rane, J. Catal., 1992, 135, 310 CrossRef CAS.
- S. A. R. Mulla, O. V. Buyevskaya and M. Baerns, Catal. Today, 2000, 62, 91 CrossRef.
- S.-W. Lin and W. Ueda, Bull. Chem. Soc. Jpn., 1999, 72, 997 CrossRef CAS.
- H. X. Dai, C. F. Ng and C. T. Au, J. Catal., 2000, 189, 52 CrossRef CAS.
- E. Heracleous and A. A. Lemonidou, J. Catal., 2006, 237, 162 CrossRef CAS.
- J. E. Miller, M. M. Gonzales, L. Evans, A. G. Sault, C. Zhang, P. Rao, G. Whittwell, A. Maiti and D. King-Smith, Appl. Catal., A, 2002, 231, 281 CrossRef CAS.
- W. Ueda and K. Oshihara, Appl. Catal., A, 2000, 200, 135 CrossRef CAS.
- E. M. Thorsteinson, T. P. Wilson, F. G. Young and P. H. Kasai, J. Catal., 1978, 52, 116 CrossRef CAS.
- T. Ushikubo, K. Oshima, A. Kayou, M. Vaarkamp and M. Hatano, J. Catal., 1997, 169, 394 CrossRef CAS.
- P. Botella, E. Garcia-Gonzalez, A. Dejoz, J. M. Lopez Nieto, M. I. Vazquez and J. Gonzalez-Calbet, J. Catal., 2004, 225, 428 CrossRef CAS.
- P. Botella, A. Dejoz, J. M. Lopez Nieto, P. Concepcion and M. I. Vazquez, Appl. Catal., A, 2006, 298, 16 CrossRef CAS.
- T. Katou, D. Vitry and W. Ueda, Chem. Lett., 2003, 1028 CrossRef CAS.
- M. Sadakane, N. Watanabe, T. Katou, Y. Nodasaka and W. Ueda, Angew. Chem., Int. Ed., 2007, 46, 1493 CrossRef CAS.
- M. Sadakane, K. Yamagata, K. Kodato, K. Endo, K. Toriumi, Y. Ozawa, T. Ozeki, T. Nagai, Y. Matsui, N. Sakaguchi, W. D. Pyrz, D. J. Buttrey, D. A. Bolm, T. Vogt and W. Ueda, Angew. Chem., Int. Ed., 2009, 48, 3782 CrossRef CAS.
- T. Katou, D. Vitry and W. Ueda, Catal. Today, 2004, 91–92, 237 CrossRef CAS.
- M. Sadakane, K. Kodato, T. Kuranishi, Y. Nodasaka, K. Sugawara, N. Sakaguchi, T. Nagai, Y. Matsui and W. Ueda, Angew. Chem., Int. Ed., 2008, 47, 2493 CrossRef CAS.
- M. Sadakane, S. Ohmura, K. Kodato, T. Fujisawa, K. Kato, K.-I. Shimizu, T. Murayama and W. Ueda, Chem. Commun., 2011, 47, 10812 RSC.
- W. D. Pyrz, D. A. Blom, M. Sadakane, K. Kodato, W. Ueda, T. Vogt and D. J. Buttrey, Proc. Natl. Acad. Sci. U. S. A., 2010, 107, 6152 CrossRef CAS.
- W. D. Pyrz, D. A. Blom, M. Sadakane, K. Kodato, W. Ueda, T. Vogt and D. J. Buttrey, Chem. Mater., 2010, 22, 2033 CrossRef CAS.
- A. Mueller, A. M. Todea, J. Van Slageren, M. Dressel, H. Boegge, M. Schmidtmann, M. Luban, L. Engelhardt and M. Rusu, Angew. Chem., Int. Ed., 2005, 44, 3857 CrossRef CAS.
- B. Botar, P. Koegerler and C. L. Hill, Chem. Commun., 2005, 3138 RSC.
- A. Mueller, E. Krichemeyer, H. Boegge, M. Schmidtmann and F. Peters, Angew. Chem., Int. Ed., 1998, 37, 3360 Search PubMed.
- A. Mueller, E. Krichemeyer, S. Dillinger, H. Boegge, W. Plass, A. Proust, L. Dloczik, C. Meyer and R. Rohlfing, Z. Anorg. Allg. Chem., 1994, 620, 599 CrossRef CAS.
- H. Hibst, F. Rosowski and G. Cox, Catal. Today, 2006, 117, 234 CrossRef CAS.
- O. Ovsiser, Y. Uchida, G. Mestl, G. Weinberg, A. Blume, M. Dieterle, H. Hibst and R. Schlogl, J. Mol. Catal. A: Chem., 2002, 185, 291 CrossRef.
Footnote |
| † Electronic supplementary information (ESI) available. See DOI: 10.1039/c2cy20444d |
| This journal is © The Royal Society of Chemistry 2013 |
