Particle size and support effects in hydrogenation over supported gold catalysts
U.
Hartfelder
a,
C.
Kartusch
a,
M.
Makosch
a,
M.
Rovezzi
b,
J.
Sá
c and
J. A.
van Bokhoven
*ac
aInstitute for Chemical and Bioengineering, ETH Zürich, Wolfgang-Pauli Strasse 10, 8093 Zürich, Switzerland. E-mail: jeroen.vanbokhoven@chem.ethz.ch; Tel: +41 44 632 55 42
bID26 European Synchrotron Radiation Facility, BP 220, F-38043 Grenoble Cedex, France
cLaboratory for Catalysis and Sustainable Chemistry, Paul Scherrer Institute, 5232 Villigen PSI, Switzerland
First published on 25th September 2012
Abstract
Particle size and support effects were determined for the hydrogenation of nitrobenzene over gold supported on alumina and titania by kinetic experiments, TEM and in situ high energy resolution fluorescence detected X-ray absorption spectroscopy (HERFD XAS). Especially when supported on alumina, the catalytic activity correlated well with the fraction of particles smaller than 2 nm. These particles are able to split hydrogen on undercoordinated gold atoms, hence the strong particle size effect. In addition, on titania the increased length of the metal–support interface for smaller particles leads to enhanced activity because of the beneficial effect of the metal–support interface on the splitting of hydrogen. Reporting the average particle size is not always relevant in describing catalytic performance.
Introduction
Gold nanoparticles on metal oxide supports are very selective catalysts in a variety of applications.1 Two key parameters for the activity of gold catalysts are the particle size and the support. The strong size dependence of activity for gold is perhaps best illustrated by the fact that bulk gold is mostly inert.2 Nanoscopic gold particles supported on metal oxides however, introduced in catalysis by Haruta and co-workers,3 are active in a variety of reactions, such as low temperature CO oxidation, hydrogenation, and the water-gas shift reaction.1The relationship between particle size and activity has been intensely investigated both theoretically and experimentally.4–14 While most authors consider a particle size of less than about 2 nm to be crucial for activity, there is no consensus on the reason for this effect. Some argue that increased numbers of low-coordinated gold atoms are necessary,6,7,14 others suggest electronic effects based on the particle size or combinations of the two.5,9,10,12,13
Most work relating catalytic activity to particle size in catalysis by gold was done for CO oxidation. When comparing the particle size and activity, especially for experimental work rather than simulations, not only the average particle size, but also the complete particle size distribution must be considered.
Bond argued that for catalysts with a broad distribution of particle sizes, the lower end of the particle size distribution contributes most to the activity, and that looking only at average particle sizes is misleading.12 Claus and co-workers investigated the use of gold nanoparticles on various supports and demonstrated effects of particle size on selectivity, electronic structure, geometry and selectivity.15–17 Cardenas-Lizana and co-workers showed that the particle size and the nature of the support can affect reactivity and selectivity in the gas-phase hydrogenation of dinitrobenzene.18 They also demonstrated higher activity for gold compared to silver on titania19 and tunable selectivity for mixed gold–nickel catalysts.20 Bus et al. showed that gold particles with particle sizes of 2 nm and less are particularly active in the hydrogenation of cinnamaldehyde.9 Haruta and co-workers found a similar particle size effect in HD-exchange reactions on gold particles supported on titania and attributed this effect to the perimeter size of the particles.11 Nakamura et al. showed that titanium supported on gold is not active in HD-exchange. If it is oxidized to TiO2 however, the system becomes active.21 This shows that the interface of metallic gold and titatium oxide is crucial for activity. Corma and co-workers used DFT calculations and infrared spectroscopy to show that hydrogen is activated on neutral gold atoms with low coordination numbers.22,23
A much investigated hydrogenation reaction over supported gold catalysts is the reduction of nitroaromatic compounds to the corresponding anilines.24–29 As aromatic amines with other reducible functionalities such as double bonds are key intermediates in a variety of applications, an efficient and selective method for the reduction of substituted nitroaromatic compounds is of considerable importance.30 The rate limiting step in the hydrogenation of nitrobenzene over gold supported on titania is the dissociation of hydrogen.31 This reaction can therefore be used to study the effect of particle size and support on the activation of hydrogen in an industrially relevant reaction.
This work determines the effect of particle size and support on the hydrogenation of nitroaromatic compounds catalysed by supported gold nanoparticles. We compare kinetic data, high energy resolution fluorescence detected X-ray absorption (HERFD XAS) measurements and particle size distributions obtained by TEM for gold on alumina and titania respectively. By detecting a fluorescence line with an instrumental energy bandwidth on the order of the core hole lifetime broadening HERFD XAS spectra are obtained with a good signal to background ratio and with line-sharpened absorption features.32–36
Results
The gold content by mass of the catalysts as determined by atomic absorption spectroscopy was 0.74 ± 14 wt% for Au/TiO2 and 0.69 ± 9 wt% for Au/Al2O3. Fig. 1 shows two typical TEM micrographs. The small bright dots represent the metal particles; particles below 4 nm are dominant in Au/Al2O3-100, though some are found up to 8 nm in diameter (Fig. 1A); and up to 26 nm in diameter for Au/Al2O3-200 (Fig. 1B). Especially Au/Al2O3-200 showed a large particle size distribution.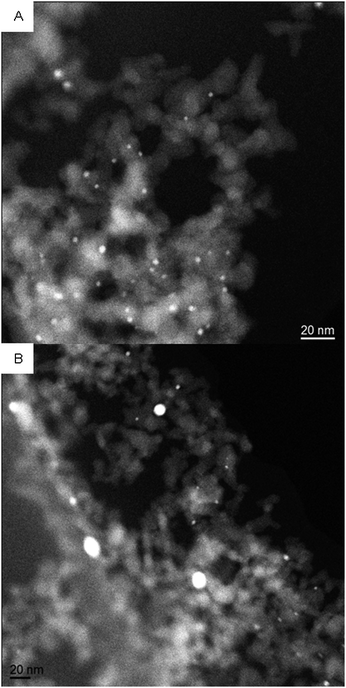 | ||
| Fig. 1 TEM images of Au/Al2O3-100 (A) and Au/Al2O3-200 (B). | ||
Fig. 2A and B show the particle size distributions for Au/TiO2 and Au/Al2O3. The average particle size for Au/TiO2 was 2.3 nm and for Au/Al2O3 1.6 nm. Most of the particles in Au/TiO2 had particle sizes below 4 nm, with only a small fraction between 4 and 8 nm. The fractions below 2 nm and from 2 nm to 4 nm were roughly equal. For Au/Al2O3, hardly any particles larger than 4 nm were observed.
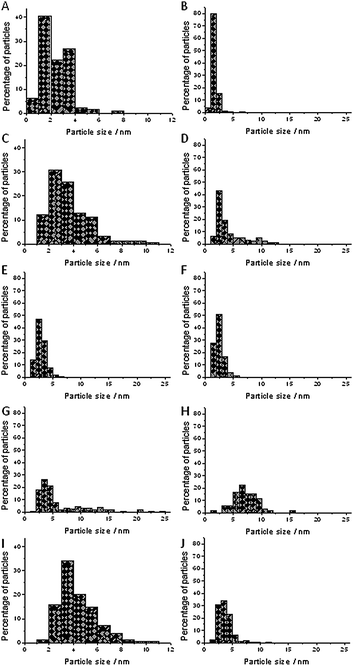 | ||
| Fig. 2 Particle size distributions for all catalysts. (A) Au/TiO2; (B) Au/Al2O3; (C) Au/TiO2-100; (D) Au/Al2O3-60; (E) Au/Al2O3-100; (F) Au/Al2O3-150; (G) Au/Al2O3-200; (H) Au/Al2O3-aniline; (I) Au/TiO2-rec; (J) Au/Al2O3-rec. | ||
For Au/TiO2-100, there was an increase in the average particle size from 2.3 nm to 3.6 nm (Fig. 2C), but a significant fraction below 2 nm remained. Most of the particles were in the range between 2 nm and 4 nm and there were no particles larger than 12 nm. Fig. 2D–G show the particle size distributions for Au/Al2O3-60, Au/Al2O3-100, Au/Al2O3-150, and Au/Al2O3-200.
The fraction from 2 nm to 4 nm was the dominant fraction in all cases, but otherwise there was considerable variation. The fraction of particles below 2 nm was 7% for pretreatment at 60 °C, 15% for pretreatment at 100 °C, 28% for pretreatment at 150 °C and 0.7% for pretreatment at 200 °C (Table 1, vide infra). Fig. 2H shows the particle size distribution of Au/Al2O3 after reaction in which the fivefold excess of aniline was present in the reaction mixture. The average particle size increased from 1.6 nm to 7.1 nm and the fraction of particles smaller than 2 nm decreased from 83% to 1.4%. This indicates that adding aniline had caused an increase in particle size. Fig. 2I and J show the particle size distributions of Au/TiO2-rec and Au/Al2O3-rec. Again, the average particle size was increased and the quantity of particles with a particle size of less than 2 nm decreased to 1.3% in TiO2-rec and to 2.5% in Au/Al2O3-rec. This shows that recycling of the catalyst leads to sintering.
| Pretreatment T | Average particle size after reaction/nm | Percentage of particles below 2 nm after reaction | Rates in mol per g of gold per h based on conversion in the first 30 minutes |
|---|---|---|---|
| 60 °C | 4.1 | 7 | 0.44 |
| 100 °C | 2.9 | 15 | 0.96 |
| 150 °C | 2.5 | 28 | 1.40 |
| 200 °C | 5.9 | 0.7 | 0.09 |
Fig. 3A shows catalytic data acquired in batch-mode for the liquid phase reduction of nitrobenzene by Au/TiO2 after various pretreatments. There was no large effect of pretreatment temperature on the activity; all showed a rapid decrease of nitrobenzene. Full conversion was achieved within two hours in all cases. Fig. 3B shows kinetic data for the reduction of nitrobenzene over alumina-supported gold. In all cases, the catalyst was not only considerably less active than gold supported on titania, but there was also a significant effect of the pretreatment temperature on catalytic activity. Both pretreatment at 60° C and at 200 °C gave drastically reduced activity of the catalyst compared to the optimum activity achieved for pretreatment at 150 °C. This is the catalyst with the largest fraction of particles below 2 nm. The catalyst pretreated at 60 °C showed hardly any activity in the first 10 minutes of reaction, but became active later on, though at a moderate rate. The catalyst pretreated at 200 °C showed low activity during the whole reaction time. Ring hydrogenation products and intermediates such as nitrosobenzene were not detected by gas chromatography, indicating that, if they were produced in the reaction, then only in minute amounts.
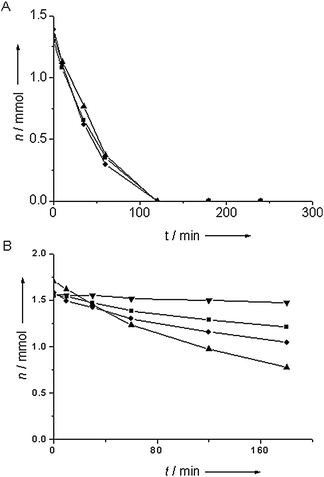 | ||
| Fig. 3 The amount of nitrobenzene remaining in the reduction of nitrobenzene catalyzed by titania-supported Au (A) and alumina-supported Au (B) for a pretreatment temperature of 60 °C (■), 100 °C (●), 150 °C (▲) and 200 °C (▼). | ||
Fig. 4 shows the Au L3 HERFD XAS spectra of Au/Al2O3 during heating and reduction at different temperatures. The first intense feature in the spectrum, the white line, corresponds to the electronic transition from the core state (2p) to the lowest unoccupied state.37 Because we excite the L3 edge, the d DOS is probed. The intensity of the white line increases with the number of holes in the 5d-band,8 and thus the gold oxidation state. The starting spectrum showed a large white line, typical of Au3+. For pretreatment at 60 °C (Fig. 4A) the white line at ∼11.92 keV decreased only slightly during the pretreatment and remained at more than 80% of its original intensity, indicating only partial reduction. At 100 °C (Fig. 4B) the white line intensity diminished rapidly and was characteristic of metallic gold in nanoparticles after 30 minutes. Peaks at ∼11.93 keV, ∼11. 95 keV and ∼11.97 keV appeared, which are indicative of gold–gold scattering, and thus particle formation. For hydrogen treatment at 150 °C (Fig. 4C) and 200 °C (Fig. 4D), the reduction proceeded much faster. The white line reached its final intensity within 10 minutes from the beginning of heating.
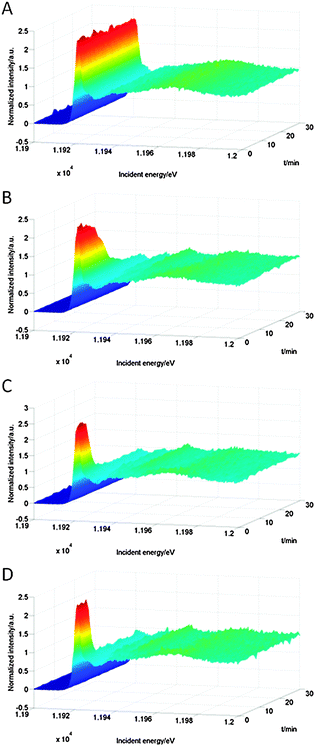 | ||
| Fig. 4 Au L3 HERFD XAS spectra of Au/Al2O3 recorded during heating and reduction under 10 bar of hydrogen at 60 °C (A), 100 °C (B), 150 °C (C) and 200 °C (D). The autoclave was heated during the first 20 minutes. | ||
Fig. 5 shows the change of the amount of cationic gold during pretreatment at different temperatures. Pretreatment at 60 °C only resulted in a slight reduction of the amount of cationic gold in the catalyst. Pretreatment at a 100 °C led to full reduction in 25 min. Reduction proceeded considerably faster at 150 °C and 200 °C, with full reduction in about 10 minutes. The initial onset of the reduction in the first few minutes was due to the heating of the reaction mixture.
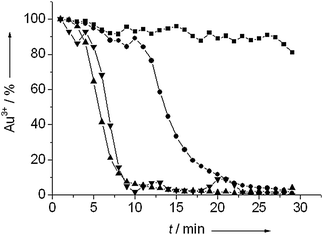 | ||
| Fig. 5 The amount of cationic gold as determined by linear fitting taking the first spectrum of the catalyst and the spectrum of gold foil as references during reduction under 10 bar of hydrogen at 60 °C (■), 100 °C (●), 150 °C (▲) and 200 °C (▼). | ||
Fig. 6 shows the Au L3 HERFD XAS spectra of Au/Al2O3 during reaction at 100 °C after pretreatment at 60 °C. The white line decreased quickly after reaching 100 °C. After fifteen minutes the catalyst was fully reduced, as indicated by the complete loss of the white line and by the appearance of peaks at ∼11.93 keV, ∼11.95 keV and ∼11.97 keV.
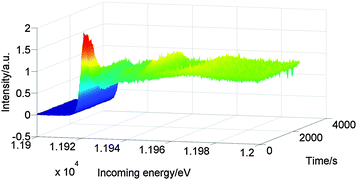 | ||
| Fig. 6 Au L3 HERFD XAS spectra of Au/Al2O3 recorded during reaction at 100 °C under 10 bar of hydrogen after pretreatment at 60 °C. | ||
Catalytic experiments (not shown) for the reduction of nitrobenzene in the presence of excess amounts of aniline showed that the activity of Au/TiO2-100 was not affected by adding up to fivefold excess of aniline to the reaction mixture. The activity of Au/Al2O3-100 however was reduced by the fivefold excess of aniline, though not by the threefold excess.
Fig. 7 shows the evolution of the amount of nitrobenzene after addition of extra nitrobenzene at 90 and 180 minutes over Au/TiO2 and Au/Al2O3. Both catalysts showed reduced activity with each subsequent addition of nitrobenzene. For a reaction order of zero in nitrobenzene, the amount of substance consumed in a given interval is proportional to the rate.29,31 This assumption is reasonable in this case given the linear behavior observed previously (Fig. 3). For Au/TiO2, 1.45 mmol of nitrobenzene were consumed in the first cycle, 1.24 mmol in the second cycle and 0.9 mmol in the third cycle. For Au/Al2O3, 0.37 mmol were consumed in the first cycle, 0.21 mmol in the second cycle and 0.14 mmol in the third cycle. This reduction in activity cannot be caused by accumulation of the product, as greater amounts of aniline had no effect on catalytic activity. Poisoning by an intermediate, e.g. the intermediate nitroso species29 or particle sintering therefore are the likely causes of the lower activity.
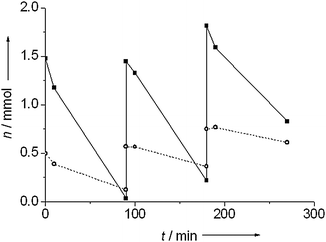 | ||
| Fig. 7 Nitrobenzene conversion during recycling for Au/TiO2 (■) and Au/Al2O3 (○). Pretreatment and hydrogenation were carried out at 100 °C under 10 bar of hydrogen. | ||
Discussion
Au/TiO2 was the more active catalyst for the hydrogenation of nitrobenzene. It was also less susceptible to loss of activity under different pretreatment conditions and with excess aniline. In contrast, the activity of Au/Al2O3 was strongly dependent on pretreatment temperature. Both low and high pretreatment temperatures reduced its activity, which we attribute to particle size (vide infra). Hydrogen treatment of gold precursors on alumina at 60 °C leads to incomplete reduction. However gold rapidly reduces under reaction conditions, leading to large particles, which do not contribute to activity. The low initial conversion for Au/Al2O3 pretreated at 60 °C suggests that catalysts rich in cationic gold are not particularly active and that reduction of the catalyst is essential.28 This is in agreement with theoretical work showing that positively charged gold atoms do not activate hydrogen.22 It also matches similar observations for the same reaction over gold supported on ceria, where cationic gold was shown to not participate in the reaction.38 The decrease in activity and increase in particle size observed in Au/Al2O3 in the presence of a large amount of aniline could be due to various mechanisms. Previous work on Au/TiO2 found that gold leaches to some extent, but does not redeposit on TiO2.39 Redeposition of gold particles cannot be excluded. Therefore, both a dissolution–redepostion mechanism and an on-surface sintering process aided by aniline are possible. Recycling had a strong negative effect on the activity of both catalysts. This is due to sintering of the smallest particles. The results do not suggest redispersion of multiple-twinned particles for Au/Al2O3, in contrast to previous observations for Au/TiO2.39 Since redispersion was attributed to the interaction of gold particles with oxygen vacancies of titania, the lack of such an effect on a non-reducible support like Al2O3 is not surprising.The activity of Au/Al2O3 correlated with the fraction of particles with a particle size of less than 2 nm that were measured after the corresponding reaction (Table 1). The particle size after reaction was used as the basis of comparison because Au/Al2O3-60 only became active under reaction conditions. This correlation is in agreement with Bond’s theory that only particles with particle sizes below a certain limit contribute to the activity of the catalyst.12,13 It also matches previous observations that particles with particle sizes of less than 2 nm are particularly active in the reduction in various other reactions.9,11,40 Zanella and co-workers found that small particles are very active in the hydrogenation of crotonaldehyde.40 Bus et al. observed a similar trend for hydrogenation of cinnamaldehyde.9 Fujitani et al. also found such a particle size dependence for activity in H/D-exchange.11 These size effects have been attributed to a variety of properties that change with size; Bond however correctly points out that correlation between size and activity is not sufficient to assign size dependence to any particular cause.13
Hydrogen adsorption on Au/Al2O3 is activated.41 As hydrogen splitting is the rate limiting step in the reaction,31 any effect of the support on the intrinsic activity of the catalyst could reflect the ability of the support to aid in the activation of hydrogen. Studies by Haruta et al.11 and Corma et al.26 show that the gold–support interface plays a crucial role in the hydrogenation process. Similar effects of the interface between gold particles and the support have been reported for gold on titanium carbide42 and gold on iridium.43 Corma and co-workers found by inelastic neutron scattering that gold particles supported on ceria split hydrogen heterogeneously, with the formation of a gold hydride species and bridging hydroxyl groups on the support.44 Collins et al. found evidence for hydrogen spillover for gold supported on ceria–zirconia with the hydrogen found in bridging hydroxyl groups; they also proposed that CO and hydrogen are activated on the same sites on gold.45 Panayotov and Yates investigated hydrogen activation on Au/TiO2 and also found spillover of hydrogen to form bridging hydroxyl groups.46 They proposed a mechanism based on spillover of atomic hydrogen with the formation of a bridging hydroxyl and the electron going to a shallow trap state of titania. Recent work showed that the atomic hydrogen then diffuses into the titania lattice, protonating the semiconductor and donating an electron.47 Fujitani and co-workers showed that TiOx supported on gold is able to split hydrogen.11,21 They found that completely oxidized titanium is necessary to catalyze HD exchange. This is further evidence for the importance of the metal oxide support in hydrogenation reactions over gold. Molina et al. found by DFT calculations on small planar gold clusters that hydrogen adsorbs preferentially in the plane of the cluster, and that a hydride species is formed.48 For a heterolytic splitting mechanism, assuming that the activation barrier towards adsorption of hydrogen and the stability of the resulting hydride are relatively similar between different supports, the differences in intrinsic activity can be explained by the ability of the support to stabilize the protons produced in the reaction. Lavalley reviewed methods to probe basicity with probe molecules,49 and found that titania has stronger basic sites than alumina when probed with halogenated alcohols. As these are protic acids, the results should give a reasonable approximation of the affinity towards protons. Using the method of decomposition of methylbutynol introduced by Lauron-Pernot et al.,50 Zaki and coworkers also found stronger basic surface sites for titania than alumina.51 For a homogeneous splitting mechanism with formation of shallow trapped states, basicity of the support is still important, as the metal oxide is protonated.47 There is also an additional factor, which is the ability of the support to accommodate the resulting electrons. An irreducible support like alumina is less able (if at all) to do this compared to a reducible support like titania. Activity thus not only depends on the particle size, it also varies with the support, which plays a role in homolytic or heterolytic hydrogen activation with spillover. In all, we attribute the greater intrinsic activity of Au/TiO2 to the ability of the metal–support interface to help split hydrogen and the hydrogen to spill over to the support and form hydroxyl and reduce the support. If activity occurs on or near the metal–support interface, the particle size also reflects its length.
Experimental section
Catalyst preparation
The catalysts were prepared by deposition–precipitation with urea.52 0.086 mg of chloroauric acid (HAuCl4, 49 wt% Au, ABCR-Chemicals) and 1.8 g of urea (puriss., Riedel-de Haën) were added to a suspension of 6 g of the support material (TiO2: Hombikat UV 100, Sachtleben Chemie GmbH; Al2O3: Aluminiumoxid C, Degussa) in deionized water (600 mL). This suspension was stirred at 80° C for 16 h and then filtered. The solids were washed with deionized water until the resulting filtrate was free of chloride (as tested by addition of silver nitrate). They were then dried under vacuum for 72 hours, collected in a vial and stored in the freezer at −18 °C under exclusion of light.Atomic absorption spectroscopy
Samples for AAS were prepared by microwave assisted digestion. 1 mL of nitric acid, 2 mL of hydrofluoric acid and 3 mL of hydrochloric acid were added to 40 mg of the catalyst. The mixture was heated to 160 °C during 20 minutes and kept at that temperature for another 30 minutes while stirring in the microwave oven. AAS measurements were performed on a Varian SpectrAA 200 FS spectrometer with a C2H2/air burner. The Au-content was quantified by calibration with a standard solution (gold solution, 1000 ppm in 1 M hydrochloric acid, Fisher-Scientific). All samples were measured three times.Transmission electron microscopy
Samples for TEM were prepared by filtration of the reaction mixture, washing with toluene and subsequent collection of the solids. TEM measurements were made on a HD2700CS (Hitachi, aberration-corrected dedicated STEM, cold FEG, 200 kV) and a Tecnai F30 ST (FEI, FEG, 300 kV).Catalytic experiments
Catalytic experiments were performed in 50 mL stainless steel autoclaves from Premex Reactor AG (Lengnau, Switzerland). Magnetic stirring at 500 rpm was used. The catalyst (50 mg) and toluene (25 mL) were put into the autoclave, purged three times with hydrogen, pressurized with hydrogen to 10 bar, and heated to the desired pretreatment temperature (60 °C, 100 °C, 150 °C, respectively 200 °C). The suspension was then stirred at that temperature for 30 minutes. After cooling, a solution of nitrobenzene toluene (5 mL) was added, the suspension again put under a hydrogen pressure of 10 bar, heated to 100 °C and left to react under stirring at 500 rpm. Samples for GC were typically taken before heating, when the desired reaction temperature was reached, after 10, 30, and 60 minutes and then every hour. Aniline poisoning experiments were performed by adding a threefold and fivefold molar excess of aniline respectively together with the nitrobenzene and internal standard. Recycling experiments were performed by running the reaction with 100 mg of the catalyst for 90 minutes, cooling down, adding new nitrobenzene (200 mg per cycle for Au/TiO2, 50 mg per cycle for Au/Al2O3) in toluene (5 mL) and heating again after pressurizing. Three such cycles were performed in each experiment. Samples were taken after heating, after 10 minutes and after 90 minutes in each cycle. 1 mL of each sample and 20 μL of mesitylene were mixed to produce the GC sample. Pretreatment conditions and sample names are summarized in Table 2. Quantification by gas chromatography (GC) was carried out on an Agilent 7820 A chromatograph with a HP 5 ms column. The column was first kept at 80 °C for two minutes, and then heated to 300 °C at a rate of 20 °C per minute. An FID detector was employed.| Sample name | Conditions |
|---|---|
| Au/TiO2 | Au/TiO2 as prepared |
| Au/Al2O3 | Au/Al2O3 as prepared |
| Au/TiO2-100 | Au/TiO2 reduced at 100 °C, 30 min, 10 bar and after catalytic use at 100 °C |
| Au/Al2O3-60 | Au/Al2O3 reduced at 60 °C, 30 min, 10 bar and after catalytic use at 100 °C |
| Au/Al2O3-100 | Au/Al2O3 reduced at 100 °C, 30 min, 10 bar and after catalytic use at 100 °C |
| Au/Al2O3-150 | Au/Al2O3 reduced at 150 °C, 30 min, 10 bar and after catalytic use at 100 °C |
| Au/Al2O3-200 | Au/Al2O3 reduced at 200 °C, 30 min, 10 bar and after catalytic use at 100 °C |
| Au/Al2O3-aniline | Au/Al2O3 reduced at 100 °C, 30 min, 10 bar and after catalytic use at 100 °C with 5× excess aniline |
| Au/TiO2-rec | Au/TiO2 reduced at 100 °C, 30 min, 10 bar and after catalytic use at 100 °C for three cycles |
| Au/Al2O3-rec | Au/Al2O3 reduced at 100 °C, 30 min, 10 bar and after catalytic use at 100 °C for three cycles |
XAS measurements
All in situ HERFD XAS measurements were performed in a setup recently described in ref. 38. Reduction experiments were performed in toluene. For each experiment, 300 mg of the “as prepared” catalyst was put into the reactor in 25 g of solvent. After that, the reactor was flushed three times with 10 bar hydrogen and finally pressurized to 10 bar hydrogen. Subsequently, the mixture was heated (4 K min-1) to the corresponding temperature (60 °C, 100 °C, 150 °C, respectively 200 °C) under mechanical stirring at 1500 rpm. As soon as the heating was started, HERFD XAS scans were recorded with a time interval of 1 min. The hydrogenation of nitrobenzene was performed in toluene. For that, 300 mg nitrobenzene were added to the reaction mixture of a freshly reduced catalyst at 60 °C. After that, the cell was closed, flushed three times with 10 bar hydrogen, and finally pressurized to 10 bar hydrogen. Subsequently the mixture was heated (4 K min−1) to reaction temperature (100 °C). As soon as heating was started, HERFD XAS spectra were recorded for 50 min with a time interval of 1 min. All experiments were recorded at beamline ID26 of the European Synchrotron Radiation Facility (ESRF) in Grenoble, France. The ring operated in uniform mode at a ring current of 200 mA. Three u35 undulators using the third harmonic were employed for the HERFD XAS measurements. The incident energy was monochromatized by a pair of Si(111) crystals. Three Pd–Cr mirrors positioned at 2.5 mrad relative to the incident beam were used to suppress higher harmonics and focus the beam on the sample with a size of 600 μm horizontal and 200 μm vertical. The estimated flux was 8 × 10¹³ photons s−1. HERFD spectra were measured by using a vertical-plane Rowland circle X-ray emission spectrometer in combination with an avalanche photodiode (APD, Perkin Elmer).36 The scattering angle in the horizontal plane was ∼130°. The spectrometer was tuned to the Au Lα1 fluorescence line (9713 eV) using the [660] reflection of four spherically bent Ge crystals. A total resolution of 2.1 eV was obtained. The raw HERFD XAS spectra were treated with the Athena software. After background subtraction the raw data were normalized in the range between 11.98 and 12 keV. The spectra were smoothed by the Savitzky–Golay method. Due to the good spectra quality, it was possible to obtain the fraction of oxidic to metallic gold at different stages of the pre-treatment and reaction using linear combinations of the initial spectra and fully reduced spectra of the catalyst. The results were smoothed by adjacent averaging. Exposure of the slurry to X-rays in the absence of hydrogen did not cause any changes to the spectra, which indicates that reduction of the gold precursor, and thus beam damage, did not occur.Conclusions
Hydrogenation of nitrobenzene over supported gold shows large particle size and support effects. On Au/Al2O3, the activity is related to the fraction of gold particles smaller than 2 nm. Highly uncoordinated gold atoms are required to split hydrogen. Gold on titania showed much less dependence on the particle size, which we ascribe to the ability of the support to help dissociate hydrogen. This leads to catalysts that are much more active. Reduced gold is essential for the hydrogenation to occur.Acknowledgements
The authors thank the ESRF in France for providing beamtime at the ID26, Sachtleben for the TiO2 Hombikat 100 sample and Frank Krumeich for the TEM measurements.References
- G. C. Bond, C. Louis and D. T. Thompson, Catalysis by Gold, Imperial College Press, 2006 Search PubMed.
- B. Hammer and J. K. Norskov, Nature, 1995, 376, 238–240 CrossRef CAS.
- M. Haruta, T. Kobayashi, H. Sano and N. Yamada, Chem. Lett., 1987, 405–408 CrossRef CAS.
- M. Haruta, Catal. Today, 1997, 36, 153–166 CrossRef CAS.
- M. Valden, X. Lai and D. W. Goodman, Science, 1998, 281, 1647–1650 CrossRef CAS.
- M. Mavrikakis, P. Stoltze and J. K. Nørskov, Catal. Lett., 2000, 64, 101–106 CrossRef CAS.
- S. H. Overbury, V. Schwartz, D. R. Mullins, W. Yan and S. Dai, J. Catal., 2006, 241, 56–65 CrossRef CAS.
- J. A. van Bokhoven and J. T. Miller, J. Phys. Chem. C, 2007, 111, 9245–9249 CAS.
- E. Bus, R. Prins and J. A. van Bokhoven, Catal. Commun., 2007, 8, 1397–1402 CrossRef CAS.
- J. A. van Bokhoven, Chimia, 2009, 63, 257–260 CrossRef CAS.
- T. Fujitani, I. Nakamura, T. Akita, M. Okumura and M. Haruta, Angew. Chem., Int. Ed., 2009, 48, 9515–9518 CrossRef CAS.
- G. Bond, Gold Bull., 2010, 43, 88–93 CrossRef CAS.
- G. C. Bond, Faraday Discuss., 2011, 152, 277–291 RSC.
- S. H. Brodersen, U. Grønbjerg, B. Hvolbæk and J. Schiøtz, J. Catal, 2011, 284, 34–41 CrossRef CAS.
- P. Claus, A. Brückner, C. Mohr and H. Hofmeister, J. Am. Chem. Soc., 2000, 122, 11430–11439 CrossRef CAS.
- C. Mohr, H. Hofmeister and P. Claus, J. Catal., 2003, 213, 86–94 CrossRef CAS.
- J. Radnik, C. Mohr and P. Claus, Phys. Chem. Chem. Phys., 2003, 5, 172–177 RSC.
- F. Cardenas-Lizana, S. Gomez-Quero, N. Perret and M. A. Keane, Catal. Sci. Technol., 2011, 1, 652–661 CAS.
- F. Cárdenas-Lizana, Z. M. de Pedro, S. Gómez-Quero and M. A. Keane, J. Mol. Catal. A: Chem., 2010, 326, 48–54 CrossRef.
- F. Cárdenas-Lizana, S. Gómez-Quero, G. Jacobs, Y. Ji, B. H. Davis, L. Kiwi-Minsker and M. A. Keane, J. Phys. Chem. C, 2012, 116, 11166–11180 Search PubMed.
- I. Nakamura, H. Mantoku, T. Furukawa and T. Fujitani, J. Phys. Chem. C, 2011, 115, 16074–16080 CAS.
- M. Boronat, F. Illas and A. Corma, J. Phys. Chem. A, 2009, 113, 3750–3757 CrossRef CAS.
- M. Boronat, P. Concepción and A. Corma, J. Phys. Chem. C, 2009, 113, 16772–16784 CAS.
- A. Corma and P. Serna, Science, 2006, 313, 332–334 CrossRef CAS.
- F. Visentin, G. Puxty, O. M. Kut and K. Hungerbühler, Ind. Eng. Chem. Res., 2006, 45, 4544–4553 CrossRef CAS.
- M. Boronat, P. Concepción, A. Corma, S. González, F. Illas and P. Serna, J. Am. Chem. Soc., 2007, 129, 16230–16237 CrossRef CAS.
- A. Corma, P. Concepción and P. Serna, Angew. Chem., Int. Ed., 2007, 46, 7266–7269 CrossRef CAS.
- C. Kartusch, M. Makosch, J. Sá, K. Hungerbuehler and J. A. van Bokhoven, ChemCatChem, 2012, 4, 236–242 CrossRef CAS.
- G. Richner, J. A. van Bokhoven, Y.-M. Neuhold, M. Makosch and K. Hungerbuhler, Phys. Chem. Chem. Phys., 2011, 13, 12463–12471 RSC.
- H.-U. Blaser, Science, 2006, 313, 312–313 CrossRef CAS.
- P. Serna, P. Concepción and A. Corma, J. Catal., 2009, 265, 19–25 CrossRef CAS.
- F. M. F. de Groot, M. H. Krisch and J. Vogel, Phys. Rev. B: Condens. Matter Mater. Phys., 2002, 66, 195112 CrossRef.
- P. Glatzel and U. Bergmann, Coord. Chem. Rev., 2005, 249, 65–95 CrossRef CAS.
- J. A. van Bokhoven, C. Louis, J. T. Miller, M. Tromp, O. V. Safonova and P. Glatzel, Angew. Chem., Int. Ed., 2006, 45, 4651–4654 CrossRef CAS.
- O. V. Safonova, M. Tromp, J. A. van Bokhoven, F. M. F. de Groot, J. Evans and P. Glatzel, J. Phys. Chem. B, 2006, 110, 16162–16164 CrossRef CAS.
- P. Glatzel, M. Sikora, G. Smolentsev and M. Fernández-García, Catal. Today, 2009, 145, 294–299 CrossRef CAS.
- H. Baumgartel, Nachr. Chem., Tech. Lab., 1988, 36, 650 CrossRef.
- M. Makosch, C. Kartusch, J. Sa, R. B. Duarte, J. A. van Bokhoven, K. Kvashnina, P. Glatzel, D. L. Fernandes, M. Nachtegaal, E. Kleymenov, J. Szlachetko, B. Neuhold and K. Hungerbuhler, Phys. Chem. Chem. Phys., 2012, 14, 2164–2170 RSC.
- C. Kartusch, F. Krumeich, O. Safonova, U. Hartfelder, M. Makosch, J. Sá and J. A. van Bokhoven, ACS Catalysis, 2012, 2, 1394–1403 CrossRef CAS.
- R. Zanella, C. Louis, S. Giorgio and R. Touroude, J. Catal., 2004, 223, 328–339 CrossRef CAS.
- E. Bus, J. T. Miller and J. A. van Bokhoven, J. Phys. Chem. B, 2005, 109, 14581–14587 CrossRef CAS.
- E. Florez, T. Gomez, P. Liu, J. A. Rodriguez and F. Illas, ChemCatChem, 2010, 2, 1219–1222 CrossRef CAS.
- M. Okada, M. Nakamura, K. Moritani and T. Kasai, Surf. Sci., 2003, 523, 218–230 CrossRef CAS.
- R. Juarez, S. F. Parker, P. Concepcion, A. Corma and H. Garcia, Chem. Sci., 2010, 1, 731–738 RSC.
- S. E. Collins, J. M. Cíes, E. del Río, M. López-Haro, S. Trasobares, J. J. Calvino, J. M. Pintado and S. Bernal, J. Phys. Chem. C, 2007, 111, 14371–14379 CAS.
- D. A. Panayotov and J. T. Yates, J. Phys. Chem. C, 2007, 111, 2959–2964 CAS.
- D. A. Panayotov, S. P. Burrows, J. T. Yates and J. R. Morris, J. Phys. Chem. C, 2011, 115, 22400–22408 CAS.
- L. M. Molina and J. A. Alonso, J. Phys. Chem. C, 2007, 111, 6668–6677 CAS.
- J. C. Lavalley, Catal. Today, 1996, 27, 377–401 CrossRef CAS.
- H. Lauron-Pernot, F. Luck and J. M. Popa, Appl. Catal., 1991, 78, 213–225 CrossRef CAS.
- M. A. Hasan, M. I. Zaki and L. Pasupulety, J. Mol. Catal. A: Chem., 2002, 178, 125–137 CrossRef CAS.
- R. Zanella, S. Giorgio, C. R. Henry and C. Louis, J. Phys. Chem. B, 2002, 106, 7634–7642 CrossRef CAS.
| This journal is © The Royal Society of Chemistry 2013 |
