DOI:
10.1039/C2GC36239B
(Paper)
Green Chem., 2013,
15, 210-225
Environmental and economic analysis for selection and engineering sustainable API degenotoxification processes
Received 5th August 2012, Accepted 26th October 2012
First published on 26th October 2012
Abstract
The present paper discusses a comparative study concerning performance efficiency and sustainable impact of three purification processes for degenotoxification of Active Pharmaceutical Ingredients (APIs) post reaction streams: recrystallization, flash chromatography and organic solvent nanofiltration (OSN). Two case studies in each process were selected for evaluation of the separation technologies featuring the same model API being Mometasone furoate (Meta) glucocorticoid and two genotoxic impurities (GTIs). Methyl mesylate (MeMS) and 4-dimethylaminopyridine (DMAP) were chosen as model impurities due to their incidental appearance in glucocorticoids based on a common methanesulfonylation manufacturing step. Successful degenotoxification was achieved in all cases concerning DMAP and MeMS reaching final GTI levels below the regulatory thresholds with the exception of DMAP using recrystallization. API losses were 5% and 6.4% for OSN, 6.4% and 11.9% for flash chromatography and 14.9% and 16.4% for recrystallization during the removal of DMAP and MeMS, respectively. The API loss occurring during the purification processes has a significant impact on the outcome of cost analysis. Mass and carbon intensity values are highest for OSN and lowest for recrystallization, while flash chromatography has intermediate values. Although recrystallization is more time consuming, it should not be discarded without careful analysis since API loss often declines at larger scales and it generally gives the API in the desired crystallographic form. Solvent recycling has a significant impact on the sustainability of all the processes by the reduction of mass intensity by two orders of magnitude (from 400–1300 to 14–63 kg/kg-API, depending on the process) and narrowing down carbon intensity to the range of 100–200 kg-CO2/kg-API. OSN requires the use of 7 diavolumes, therefore its high performance is achieved at the cost of high solvent usage. Hence, solvent recycling also has a higher positive environmental impact on OSN.
1. Introduction
Process development is considered to be one of the most important design stages due to its crucial effect both on the whole lifecycle of a process and on its performance.1 Furthermore, the major part of the production costs of pharmaceuticals is caused by downstream processing.2 The pharmaceutical industry has been pioneering process optimization concerning the optimization of the purification of the final product3 as well as on introducing green metrics4–7 to stimulate process effectiveness that minimize environmental impacts.8 In recent years, pharmaceutical regulatory authorities have shown increased concerns about impurities – especially genotoxic impurities (GTIs) – in APIs due to their adverse effect on human health. Hence, pharmaceutical manufacturers responded with the implementation of additional purification steps to achieve ultra-low GTI levels.9–11 The model compounds selected for the present study were Meta, as a representative API, and MeMS and DMAP as impurities. Meta is a synthetic anti-inflammatory steroid of the 17-esters of the 9α,21-dihalo-pregnane-11β,17α-diol-20-one family, useful in the treatment of inflammatory diseases.12 Several related synthetic routes and purification processes for this compound can be found in the literature.13–15 As shown in Fig. 1, the reagent system to convert the 21-hydroxyl functionality to chloride during manufacturing usually comprises the use of MsCl and DMAP in dichloromethane (DCM).16–18 As a drawback of this methanesulfonylation reaction step, MsCl may form genotoxic MeMS in the presence of methanol and DMAP may also contaminate the final product, making this system particularly relevant to be used as a model system in the current study. The former impurity is a known genotoxin while the latter is a potentially genotoxic impurity with two structural alerting functional groups: aromatic and alkyl amines.19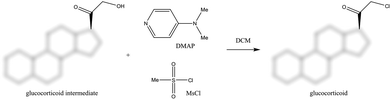 |
| | Fig. 1 Application of MsCl and DMAP during the synthesis of glucocorticoids (MsCl can form genotoxic MeMS in the presence of MeOH). | |
Besides the conventional API purification techniques – such as recrystallization, chromatography, resins, distillation, extraction – emerging technologies are being implemented in pharmaceutical downstream processing such as molecular imprinting10,11,20 and organic solvent nanofiltration (OSN).9,21,22 Furthermore, the synergic combinations of these processes have also been explored in recent years.23–25 Recrystallization and chromatography as conventional techniques and OSN as an emerging technology were selected for drug degenotoxification as model purification processes for the present study. The schemes of the three purification processes including inputs, outputs, sources of energy consumption and waste formation are illustrated in Fig. 2.
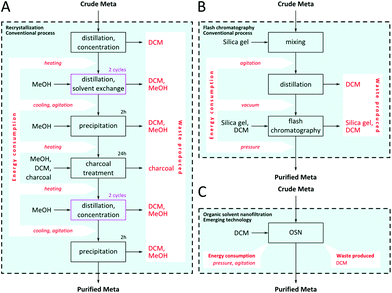 |
| | Fig. 2 Comparison of purification processes under investigation: recrystallization (A), flash chromatography (B) and organic solvent nanofiltration (C). | |
The first purification technique chosen for the current study is flash chromatography which is based on the different equilibrium adsorption of the API and the impurities between a stationary phase and a mobile phase, resulting in different elution times and allowing for the compounds to be separated. Flash chromatography (FC) featuring silica gel was applied under pressure to maintain fast and constant elution flow. The second technique chosen is recrystallization which consists of dissolving the crude API at an elevated temperature followed by precipitation of the API during cooling whilst the impurities remain dissolved in the mother liquors due to the differences in solubility. Recrystallization (RC) is probably the most applied purification technology in the fine chemical industry, e.g. API manufacturing, due to its ability to give high purity products. However, selection of optimal conditions for recrystallization – solvent system, temperatures, time and cooling rate – is challenging and time-consuming.26 The third technique under investigation is OSN which is a pressure driven separation process where a solvent resistant membrane acts as a selective agent and is able to discriminate between solutes at a molecular level with regard to size, shape and polarity. Recently, our research team has suggested the use of OSN operated in diafiltration mode as a general platform to remove GTIs at high concentrations,9 where fresh solvent (VADD) is added to the initial post reaction solution volume fed to the system (VF). The diavolume used is defined as D = VADD/VF. Since OSN has been suggested for API processing in other recent publications as well,22,24,27 it has been selected as the third, emerging purification technology to be compared with the conventional recrystallization and flash chromatography.
The solvent of the synthetic step of Meta prior to degenotoxification is DCM. Therefore, the model solvent of the purification processes under investigation was DCM. These processes were based on WO980043713 and US447239315 patents featuring MeOH–DCM and chloroform–ethylacetate solvent mixtures, respectively. In this study, the use of chloroform, a banned solvent,28,29 was replaced by DCM in the FC process, since DCM has very similar solvability properties to the ones of chloroform. However, one should stress that DCM holds a regulatory flag due to its negative effects on both health and environment. Therefore, DCM has been categorized as an undesirable solvent in the pharmaceutical industry both by GSK30,31 and Pfizer.32 The GSK solvent selection guide33,34 classifies DCM as material of concern. Although DCM represented 75% of the mass of such chemicals used in GSK35 in 2005 – being present mainly in processes developed in the '90s or earlier – there has been a consistent effort to replace DCM in new processes before transferring them to manufacturing. The use of DCM in API manufacturing is decreasing, e.g. it has fallen from position 3 to 8 in the ranking of process solvents used between 1990 and 2000 in GSK. Note that the current work aims to compare purification processes where the API feed comes already in DCM and hence its replacement with other solvents points to the alteration of the synthetic step which is out of the scope of the present study. However, replacement of this solvent by more sustainable ones should definitely be pursued in further process development.
Several green metrics have been proposed in the literature to evaluate green economy of synthetic routes6,7 including mass, energy and carbon intensity, however literature data on downstream process comparison are scarce.3,36,37 Recently published papers give an insight into how companies such as GSK pharmaceuticals,4 L'Oréal cosmetics and Repsol refinery38 approach green aspects related to processes. GSK also proposed life cycle analysis methodologies39,40 incorporating the sustainable metrics of GSK for comprehensive study of the sustainability of pharmaceutical processes. The present assessment focuses on solvent use, energy consumption and selective agent (silica gel, charcoal or membrane) disposal as well as purification performance and costs. Pharmaceutical downstream processes usually consume large amounts of solvents, hence the effect of a solvent recovery distillation unit both on environmental and financial costs is assessed.
2. Results and discussion
2.1. Overall process performance comparison
Selection of purification technologies for GTI removal from API post reaction solutions is not trivial: industrial feasibility, economic and environmental impact, achievable purity grade and API loss have to be evaluated individually to make a reasonable decision leading to a viable manufacturing process. Removal of genotoxics from APIs post reaction streams is fundamental to decreasing toxicological risk to patients. GTI limits in APIs are calculated as follows: the threshold of toxicological concern (TTC) value (1.5 μg day−1) divided by the maximum daily dose (g day−1) gives the limit in mg dm−3 to be applied to the active substance.41 Considering a 500 mg day−1 daily dose of Meta the GTI is required to be controlled at 3 mg dm−3, relative to the API. Consequently, a post-reaction stream containing 10 g dm−3 Meta and 1 g dm−3 GTI requires an impurity removal higher than 99.7%. Since the higher the desired purity, the higher the API loss, a compromise between level of purity and API loss has to be made for any purification process whilst taking into account the threshold limit of impurities. Fig. 3 demonstrates API recovery versus GTI removal for each process.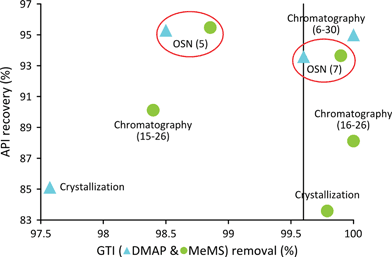 |
| | Fig. 3 Process performance comparison for two case studies: Meta/DMAP and Meta/MeMs. The boundary limit of 99.7% of GTI removal is indicated corresponding to the TTC for the considered case study. | |
Regarding both of the model GTI, recrystallization shows higher API loss without acceptable compensation in the API purity achieved. Recrystallization is one of the oldest and most common processes employed in the pharmaceutical industry for API purification; and despite its drawbacks, such as impurity carryover and API loss in the mother liquor and washing solutions, recrystallization is a widely used purification process due to the fact that it delivers the API in the desired crystallographic form, removes unwanted solvent occlusions from the API and allows the careful control of particle size. Regarding the removal of DMAP, flash chromatography shows an ideal, almost 100% purification level, at the cost of only a 5% loss of Meta. On the other hand, for the same level of GTI removal by OSN incurs significant Meta loss. Notice that 98.5% DMAP removal implies a loss of 4.7% Meta at 5 diavolumes. MeMS is a smaller molecule compared to DMAP and thus permeates through the membrane slightly easier, implying higher removals of this GTI by OSN for the same diavolume. MeMS removal by OSN provides an efficient route when compared with chromatography. About 4.5% of the API is lost during the removal of 98.9% of MeMS at 5 diavolumes and further purification up to virtually 99.9% GTI removal is achieved with a loss of 6.3% API showing the robustness of this simple technique.
In order to highlight the different operational steps of the processes to be compared and map API loss as well as GTI removal, the data obtained at each particular step, process performance, solvent and energy used, as well as key process costs are described in detail in the following sections.
2.2. Stepwise process performance comparison
A detailed discussion and analysis of each step of the experimental trials follows. Flash chromatography was performed collecting fractions of 50 cm−3 of eluent. Removal of DMAP from crude Meta proved to be straightforward with an isocratic elution described in the experimental section. Notice that silica gel has a slightly acidic nature which causes partial protonation of the basic DMAP, hence its retention on the stationary phase is very high (Rf = 0.05). Meta is not detected in the first 300 cm−3 (fractions 1 to 6), 95% being continuously eluted without contamination by DMAP in the following 1200 cm−3 (fractions 7 to 30) as monitored by TFC and confirmed by HPLC-UV quantification. A higher ethyl acetate (EtOAc) content in the eluent facilitates the elution rate of Meta resulting in lower operational time and solvent consumption but this option was rejected since DMAP leakage was observed contaminating the API and thus severely affecting purification efficiency. MeMS and Meta show reciprocal affinity for the stationary phases with a faster elution rate for MeMS (Rf = 0.2) than Meta (0.02) in pure DCM. Therefore, a gradient elution (see the experimental section) was applied with initial elution with 600 dm−3 pure DCM to elute MeMS first (fractions 1–13), followed by progressive increase of EtOAc to recover Meta. Results of the MeMS removal and corresponding Meta loss are shown in Fig. 4A. Most of the Meta was recovered in fractions 16–26 representing 90.1% of the total applied to the column. Note that these fractions correspond to the part of the elution gradient where EtOAc content is higher than 5%. Intermediate fractions with eluent containing EtOAc between 0 and 5% (fractions 14 and 15) feature Meta with low MeMS contamination. Accordingly, fractions 14 and 15 were also combined with the main stream (fractions 16–26), thus the MeMS-Meta case study involves two analyses values: fractions 16–26 and 14–26. By collecting fractions 14–26 it is possible to remove 98.4% of MeMs at a cost of 9.9% API loss. Alternatively, if fractions 16–26 are collected up to 100% GTI removal (below LOD) can be achievable at a cost of 11.9% API loss, which is not significantly higher than when fractions 14–15 are included. Therefore, concerning further analyses, this study focuses on the best scenarios with 100% removal of both MeMs and DMAP.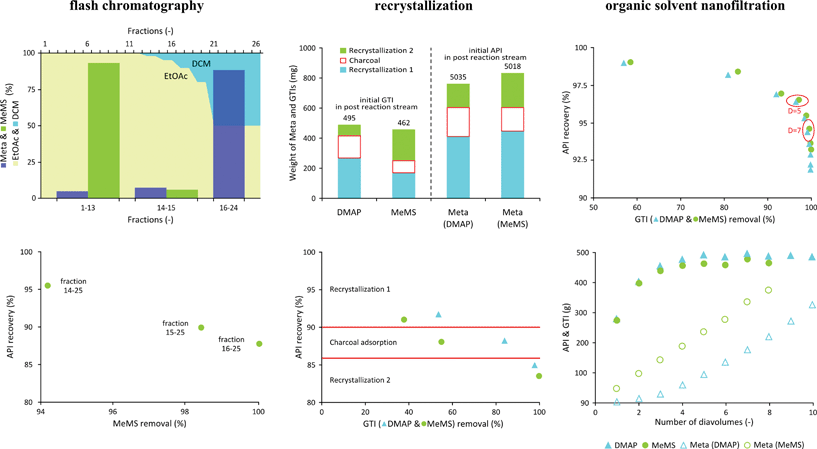 |
| | Fig. 4 Experimental evaluation of Meta and MeMs and/or DMAP separations. Distribution of API and GTI is shown in the top panels (A) in groups of fraction for flash chromatography, (B) crystallization and adsorption stage in the recrystallization process and (C) as a function of diavolume in OSN. API recovery vs. GTI removal for each stage is shown in the bottom panels. | |
The recrystallization procedure – illustrated in Fig. 2 – includes three main stages: (1) first recrystallization from methanol (MeOH), (2) charcoal adsorption and (3) second recrystallization. Firstly, the API precipitates during distillation assisted solvent exchange from DCM to MeOH enriching the mother liquor in the impurity. In the second step charcoal adsorbs the impurity and the API remains dissolved in the DCM–MeOH solution. Altogether four distillations are required during the two solvent exchanges from DCM to MeOH. In order to consequently map both GTI removal and API loss during each step, the amounts were quantified in the mother liquors, crystalline solids and charcoal filtrate as illustrated in Fig. 4B. The amount of API and GTI leaving the system through the adsorption to charcoal was estimated by component mass balance. Mass balances for crystallization close within 2.5% for both API and GTI. The largest fraction of API loss was observed in the first recrystallization, representing 9% and accounting for half (53%) of the total API loss over the 3 steps. API loss on charcoal and second recrystallization account for about one quarter (19–27%) each of total API loss. Although GTI removal cannot be assigned preferentially to any of the steps, it can be concluded that DMAP has a higher affinity to charcoal than MeMs, similar to that previously observed with adsorption on silica gel.
Discrimination of API and GTI during purification by diafiltration featuring nanofiltration membranes is mainly based on their molecular size, and consequently membrane rejections of these species are different. The nanofiltration membrane chosen for the present application is GMT-oNF-2 showing good stability in DCM. The flux across the membrane was determined for different applied pressures between 5 and 45 bar, with incremental steps of 5 bar. A linear relation of flux with pressure, with a correlation factor of 0.97, was found up to 30 bar of applied pressure, corresponding to a membrane permeability for DCM of 4.7 L m2 h−1 bar−1. Experimental DCM fluxes through the membrane were 55 L m2 h−1. The membrane rejections obtained at 10 and 20 bar, presented in Table 1, show that the API, with a molecular weight of 521.44 g mol−1, is effectively retained by the membrane as both GTIs, DMAP and MeMs, respectively, with molecular weights of 122.16 and 110.14 g mol−1, cross the membrane easily. Since the difference in the rejection of Meta at 20 and 10 bar is negligible, but higher amounts of GTI cross the membrane at 10 bar, the latter pressure was selected for experimental evaluation of diafiltration. Since MeMS is only a slightly smaller molecule than DMAP, its average rejection is not significantly lower than DMAP rejection. Note that not only molecular size rules solute transport through membranes but other factors such as membrane solute interactions and polarity may also play important roles. The results represented in Fig. 4C show that the higher the number of diavolumes, the higher the API loss, but in contrast the increments in GTI removal become less significant. On the basis of GTI removal versus API recovery (Fig. 4 – bottom panels) one can consider two scenarios concerning diavolume selection. GTI removals superior to 98.5 or 99.5% can be achieved at the cost of lower than 5 or 7% API loss at diavolumes of 5 and 7, respectively. Despite the higher purity of API achieved, higher diavolumes not only lead to higher API loss but also increase the solvent consumption and operation time. To be consistent with the flash chromatographic study, a diavolume of 7, representing the purest API, was selected for further analysis.
Table 1 Rejection of DMAP and MeMS impurities and Meta drug substance
| | Rejection (%) |
|---|
| | 10 bar | 20 bar |
|---|
| MeMs | 13.0 ± 0.1 | 15.0 ± 1.1 |
| DMAP | 15.1 ± 0.3 | 16.5 ± 0.4 |
| Meta | 99.0 ± 0.1 | 99.1 ± 0.1 |
2.3 Scale-up considerations
The experimental trials at a laboratorial scale were performed using 500 cm3 solutions with API and GTI concentrations of 10 g dm−3 and 1 g dm−3, respectively. In order to provide an environmental and economic analysis, an inventory of materials and energy of the different steps was prepared for the different processes. The assumptions, estimations, material amounts and main parameters applied for the scale-up scenario are also included in Table 2. Scale-up was calculated for a factor of 2000 for all the solvent volumes, maintaining API and GTI concentrations, corresponding to average steroid batches of 1 m3 featuring 10 kg of API. Production of 10 batches per annum was considered, satisfying a demand of about 100 kg API.
Table 2 Solvent impact on waste disposal, environment, health and safety
| | | Lab scale | Industrial scale | Scale-up factor |
|---|
| | API | 5 g | 10 kg | 2000 |
| | GTI | 1 g | 2 kg | 2000 |
| | DCM | 500 cm3 | 1 m3 | 2000 |
| Flash chromatography |
| Column specifications | Silica | 150.0 g | 330 kg | 2200 |
| Silica | 300.0 cm3 | 0.6 m3 | 2000 |
| Silica/API | 30 | 33 | 1.1 |
| Diameter | 5.0 cm | 0.63 m | |
| Section | 19.6 cm2 | 0.31 m2 | |
| H | 15.3 cm | 1.9 m | |
| H/diameter | 3.1 | 3.1 | 1 |
| (a) Solution concentrations by distillation, (b) elution conditions and (c) solvent volumes | (a) DCM distilled | 450.0 cm3 | 0.900 m3 | 2000 |
| (b) Flow rate | 50.0 cm3 min−1 | 0.476 m3 h−1 | |
| (b) Linear velocity | 2.55 cm min−1 | 1.53 m h−1 | 1.0 |
| DMAP removal |
| (c) Inlet DCM | 1425 cm3 | 3.135 m3 | 2200 |
| (c) Inlet EtOAc | 75 cm3 | 0.165 m3 | 2200 |
| (c) DMAP fraction | 300 cm3 | 0.76 m3 | |
| (c) META fraction | 1200 cm3 | 2.64 m3 | |
| (a) Distillate + filtered | 1195 cm3 | 2.63 m3 | |
| MeMes removal |
| (c) Inlet DCM | 1063 cm3 | 2.339 m3 | 2200 |
| (c) Inlet EtOAc | 137 cm3 | 0.301 m3 | 2200 |
| (c) MeMs fraction | 750 cm3 | 1.75 m3 | |
| (c) META fraction | 450 cm3 | 0.99 m3 | |
| (a) Distillated + filtered | 400 cm3 | 0.98 m3 | |
| Recrystallization |
| Solvent exchange I | DCM distilled | 450 cm3 | 0.900 m3 | 0 |
| Inlet MeOH | 100 cm3 | 0.200 m3 | 2000 |
| Inlet MeOH | 100 cm3 | 0.200 m3 | 2000 |
| Distillate | 200 cm3 | 0.400 m3 | |
| Recrystallization I | Initial temp | 50 °C | 50 °C | |
| Final temp | 10 °C | 10 °C | |
| Cooling rate | 30 °C h−1 | 30 °C h−1 | |
| Initial time | 1 | 1 h | |
| Final time | 2 h | 2 h | |
| MeOH washing | 40 cm3 | 0.080 m3 | 2000 |
| Filtrated | 85.0 cm3 | 0.170 m3 | |
| Charcoal adsorption | Charcoal | 3 g | 6 kg | 2000 |
| Inlet DCM | 100 cm3 | 0.200 m3 | 2000 |
| Inlet MeOH | 100 cm3 | 0.200 m3 | 2000 |
| Operation time | 2 h | 3 h | |
| Recirculation flow rate | — | 1.5 m3 h−1 | |
| DCM washing | 40 cm3 | 0.080 m3 | 2000 |
| Solvent exchange II | Distillate | 195 cm3 | 0.900 m3 | |
| Inlet MeOH | 100 cm3 | 0.200 m3 | |
| Distillate | 100 cm3 | 0.200 m3 | |
| Recrystallization II | Initial temp | 50 °C | 50 °C | |
| Final temp | 10 °C | 10 °C | |
| Cooling rate | 30 °C h−1 | 30 °C h−1 | |
| Initial time | 1 | 1 h | |
| Final time | 2 h | 2 h | |
| MeOH washing | 40 cm3 | 0.080 m3 | 2000 |
| Filtrated | 85.0 cm3 | 0.170 m3 | |
| Organic solvent nanofiltration |
| OSN diafiltration | Membrane | 105.6 cm2 | 20.0 m2 | 1894 |
| Solvent flux | 5.5 cm3 cm−2 h−1 | 0.055 m3 m−2 h−1 | 1 |
| Diafiltration flow rate | 581 cm3 h−1 | 1.100 m3 h−1 | 1894 |
| DCM preconditioning | 250 cm2 | 0.5 m3 | 2000 |
| DCM diafiltration | 3500 cm3 | 7.0 m3 | 2000 |
| Permeate (GTI fraction) | 3250 cm3 | 7.5 m3 | |
| Retentate (Meta fraction) | 500 cm3 | 1 m3 | |
| Distillate + filtrated | 450 cm3 | 0.990 m3 | |
| Additional information |
| Washing and final operation | Wash tank E-1 | | 0.250 m3 | |
| Wash tank A-4, A-4a and pipeline | | 0.500 m3 | |
| Flow rate to wash tanks and pipes | | 1 hour | |
| Flow rate to fill tanks | | 5 m3 h−1 | |
| Liquid in slurry (sent to E3) | | 0.100 m3 | |
| Liquid in wet cake (sent to E-4) | | 0.010 m3 | |
Fig. 5 represents the process scheme diagrams of the envisaged processes. The multi-purpose reactor E-1 is comprised of a vessel with jacket and stirrer and coupled with a condenser C-1 in all of the processes, allowing an internal distillation stage for removal of solvent from API solutions by distillation. This is required since both flash chromatography and recrystallization require a reduction of 90% of the volume of DCM. The slurry obtained is fed to the main process, i.e. the silica column E-2 for flash chromatography, or remains in reactor E-1 for solvent exchange (DCM → methanol) for recrystallization. Note that at the end of each process, including OSN, the purified API solution is fed to E-1 for concentration by distillation to 90% in volume in order to obtain a slurry that can be sent to E-3 for filtration. The wet cake obtained is dried in E-4. The specific assumptions for the main steps of each process which take place in E-1 and E-2 are discussed below. Note that the scale-up data are only indicative, with the objective of rational selection of the best purification process in terms of sustainability and green aspects. The scale-up of the process would require experimental justification and adjustment of parameters once the lead process has been selected.
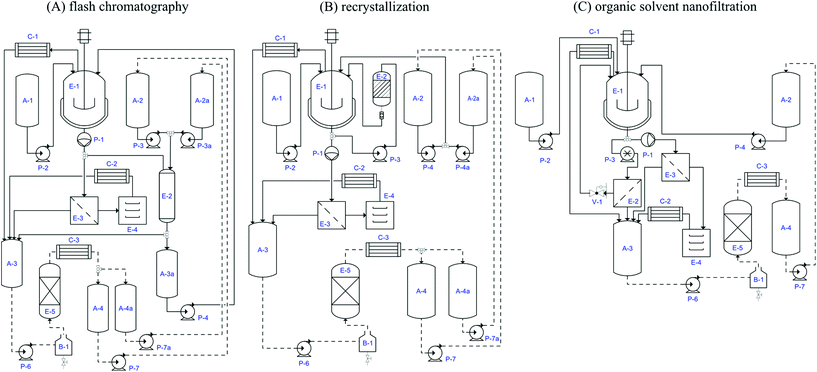 |
| | Fig. 5 Idealized process diagram for the three processes considered. Main equipment: (i) E-2 is the silica gel column, active carbon column or OSN membrane housing for flash chromatography, recrystallization and the OSN process respectively; (ii) E-1 vessel with jacket and stirrer, E-3 filter, E-4 dryer, E-5 distillation column, for all the processes; and (iii) C-1 condenser of the stirred vessel, C-2 condenser of the dryer, C-3 condenser of the distillation column, B-1 boiler of the distillation column, for all the processes. Tanks: A-1, auxiliary tank for API feed, A-2 auxiliary tank for approved DCM, A-2A auxiliary tank for approved EtOAc or MeOH, A-3 auxiliary tank for waste solvent to be recycled or disposed, A-3A auxiliary tank for diluted pure API, A-4 auxiliary tank for DCM to be approved, A-4A auxiliary tank for EtOAc or MeOH to be approved (A-3A is only required for flash chromatography. A-2, A-4 are not required for the OSN process). Pumps: (i) P3 is a centrifugal pump for solvent elution through silica and charcoal columns for flash chromatography and recrystallization, but a high pressure pump in OSN; (ii) P-2 pneumatic diaphragm pump for slurry transportation, P5 vacuum for filtration P-1, P4, P4A, P6, P7 and P7A are centrifugal pumps for solvent transportation (P4A and P7A are not required for the OSN process). | |
Flash chromatography. At a lab scale, increase of scale for flash chromatography is usually performed by increasing column diameter while maintaining both its height and the linear elution solvent velocity. However, such an approach can only be followed to a certain extent without compromising homogeneous plug flow through the column at large diameters. Ideally the column diameter should remain not too broad, ensuring uniform plug flow through the column. Therefore, for a significantly large scale-up it is inevitable that the column height increases. The higher the column, the higher the contact time between the solutes and the stationary phase promoting better solute separations, i.e. a higher number of theoretical separation plates is verified at the same linear velocity. However, a conservative approach was taken in which a potential increase in number of theoretical plates was not considered and a silica to API ratio of 1.1 was applied. The ratio of column height to diameter was kept at a value of about 3.1, corresponding to a column diameter and height of 63 cm and 1.9 m respectively. A linear velocity of 2.55 cm min−1 was considered regardless of the scale, corresponding to a flow rate of about 476 m3 h−1. Solvent volumes and fractions enriched in API or discharging GTI were directly scaled up by a factor of 2000. Fig. 5A illustrates a process scheme for the chromatography process. The 100 dm3 pre-concentrated API solution is loaded onto silica gel column E-2 for purification. The eluent fractions enriched in the purified API (2.64 m3 and 0.99 m3 for DMAP and MeMS, respectively) are collected in tank A-3A and then transferred to E-1 in order to be concentrated to yield a slurry with a volume of 100 dm3 whilst the distilled solvent is collected in tank A-3. The slurry is transferred to filter E-3 using a diaphragm pump and the wet cake is manually transferred to E-4 for drying. Tank A-3 contains large amounts of solvent and GTI. The eluent fractions comprising pure or GTI contaminated solvent are collected in tank A-3. 0.76 m3 and 1.75 m3 eluents are discarded during the chromatographic removal of DMAP and MeMS, respectively. 0.9 m3 DCM distillate from E-1 – from concentrations of initial API crude and final purified API (2.63 m3 and 0.98 m3 for DMAP and MeMS, respectively) – and about 0.75 m3 of solvent used for washing tanks and pipelines are also collected in tank A-3. Hence, the total volumes of 5 m3 and 4.4 m3 are collected in tank A-3. Recrystallization. Scale-up of the recrystallization is estimated based on volume and masses, using a scale-up factor of 2000 and an assumption of maintaining the same performance level. The charcoal to API mass ratio is maintained at a value of 0.6 while filters are scaled on the basis of solution volume to filter membrane area. Fig. 5B represents the process scheme diagram of the recrystallization process. The 1 m3 API crude solution is loaded to E-1 and solvent exchange I (DCM → methanol) is carried out in parallel with the concentration of the solution to 100 dm3 by distillation at 50 °C of the solvent in two cycles of addition of 200 dm3 fresh methanol to tank E-1 followed by distillation of the same volume, thus obtaining the API in 100 dm3 methanol. In recrystallization I the API mixture is cooled down from 50 °C to 10 °C at a rate of 30 °C h−1, and maintained at 10 °C for 2 additional hours. The precipitated API is then transferred to filter E-3 where a further 80 dm3 of methanol at 10 °C is used to wash the crystals before manually transferring to E-1, where a mixture of 400 dm3 DCM–MeOH (1![[thin space (1/6-em)]](https://www.rsc.org/images/entities/char_2009.gif) :1) is used for complete dissolution of the API. The charcoal operation stage is carried out by recalculation of the solution obtained at a flow rate of 1.5 m3 h−1 through charcoal column E-2 and reactor E-1 during 3 hours (>10 volumes). The column, loaded with 6 kg of charcoal, is washed with a further 80 dm3 of fresh DCM. Solvent exchange II is carried out by concentration of the solution to 100 dm3 by distillation at 50 °C and addition of 100 dm3 fresh methanol followed by distillation until the original volume is achieved. The mixture is then submitted to recrystallization II, following the procedure of recrystallization I, the crystals are manually transferred to dryer E-4. All the distilled and filtered solvents are collected in tank A-3.
:1) is used for complete dissolution of the API. The charcoal operation stage is carried out by recalculation of the solution obtained at a flow rate of 1.5 m3 h−1 through charcoal column E-2 and reactor E-1 during 3 hours (>10 volumes). The column, loaded with 6 kg of charcoal, is washed with a further 80 dm3 of fresh DCM. Solvent exchange II is carried out by concentration of the solution to 100 dm3 by distillation at 50 °C and addition of 100 dm3 fresh methanol followed by distillation until the original volume is achieved. The mixture is then submitted to recrystallization II, following the procedure of recrystallization I, the crystals are manually transferred to dryer E-4. All the distilled and filtered solvents are collected in tank A-3. OSN. The OSN process scale-up assumes that transmembrane flow rate is scalable based in membrane area, and thus a diafiltration flow rate of 1.100 m3 h−1 and a membrane area of 20 m2 were assumed, corresponding to an operation time of 7 hours for a diavolume of 7 and the use of 0.5 m3 of solvent for preconditioning/cleaning the membrane between batches. Note however that shorter operation times can easily be achieved by increasing membrane area, e.g. an increase in membrane area from 20 to 35 m2 corresponds to an operation time of less than 4 hours. Fig. 5C represents the OSN process scheme diagram. The crude API solution is loaded to tank E-1 and then circulated between tank E-1 and the OSN membrane modules E-2. E-1 and E-2 are pressurized to 10 bar using a high pressure pump, P-3. The diafiltration is carried out by pumping additional DCM from tank A-2 into the pressurized vessel E-1 while the permeate is collected in tank A-3. At the end of the operation the retentate volume is further reduced by distillation and the distilled solvent collected in tank A-3, whilst the resulting slurry is transferred to E-3 for filtration and, finally, the wet cake is manually transferred to E-4 for drying.At the end of each process, the use of an additional 0.5 m3 of solvent to clean the vessels E-1, E-3 and A-3 and respective connecting pipes is considered. All the solvents removed from the main stream – e.g. (i) internal distillation stage from E-1 for volume reduction of initial crude API and final purified API solution, as well as API solvent exchange in recrystallization, (ii) eluent or permeate solutions containing GTI resulting from the silica column or OSN membrane, (iii) solutions from E-3 obtained from filtration of crystals and final slurry filtrations in E-3 and wet cake drying through C-2, and (iv) vessel and pipe washings – are collected in tank A-3 to be eventually recycled. At the end of the API purification, pump P-6 can be used either to transfer solvent for off- or on-site disposal, e.g. by incineration or recovery by distillation. An optional distillation unit (E-5/C-3) is suggested with this aim in each of the processes. This alternative implies additional capital and operating costs for the different processes. Continuous lines represent pipes connecting equipment used in the main process and dotted lines represent pipes connecting equipment only needed when solvent is recycled. The effect of solvent recovery on the costs and environmental impact is discussed in Sections 2.4 and 2.5, respectively.
Batch times and pump flow rates. All the pumps (P-2, P-4, P-4A, P-7 and P-7A) used to fill and empty tanks were assumed to be set to a flow rate of 5 m3 h−1 while P-6 was set to the corresponding distillation flow rate. During OSN and flash chromatography the operation time of the diaphragm pump (P-1) and vacuum filtration (P-5) is estimated to be 2 hours, while recrystallization calls for 4 hours due to the fact that the respective operations are repeated twice. Estimated flow rates of P-3 are 0.475, 1.5 and 1.1 m3 h−1 for flash chromatography (5.5 and 7 hours per batch for MeMs and DMAP removal, respectively), recrystallization (3 hours per batch for charcoal) and OSN processes (7 hours per batch), respectively. The volume of the multipurpose reactor E-1 is 1 m3 for OSN and 0.5 m3 for flash chromatography and recrystallization. Stirring times were estimated based on filling, emptying and cleaning tank E-1 (3.5 to 5.5 hours), the internal distillation stage for solution concentration and solvent exchange and main operations (1 to 4.5 hours), and main operations (i) two recrystallization and charcoal adsorption (about 12 hours) for the recrystallization and (ii) membrane preconditioning/cleaning and diafiltration (7 hours) for the OSN process. Additional times considered include 8 hours for final drying of API, 3 hours for changing silica and charcoal replacement between each batch and 1 working shift for membrane replacement/maintenance every 5 batches (1.6 hours a batch).
2.4. Inventory and cost analysis
Capital costs estimated in the current analysis (Fig. 6) include (i) main equipment costs based on process schemes established in Fig. 5 and (ii) indirect capital costs based on multiples of main equipment costs as suggested elsewhere42 which includes additional costs such as for assembling piping, instrumentation, electrical installation, process buildings, utilities, storage, site development and ancillary buildings (respectively at ratios of 0.4, 0.7, 0.2, 0.1, 0.15, 0.5, 0.15, 0.5, and 0.15 of total main equipment cost) as well as design, contractors fees and contingency (at a ratio of 0.60).43 Therefore, the total capital cost can be calculated as 3.95 times the main equipment costs. The annual capital costs take into account a 10 year amortization period. Operation costs, annual maintenance costs and insurances are then calculated as 10%, 5% and 1% of total capital costs.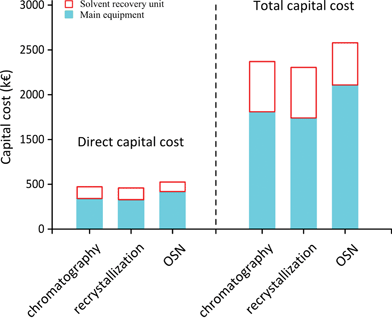 |
| | Fig. 6 Comparison of capital costs. FC – flash chromatography, RC – recrystallization, and OSN – organic solvent nanofiltration. | |
Inputs and outputs of the process are represented in Fig. 7 and the respective stream volumes are summarized in Table 3. Particular attention is given first to solvent and energy consumption with the respective CO2 footprint and waste generated and secondly to process time and full time equivalent labour, which is estimated for the three alternative processes.
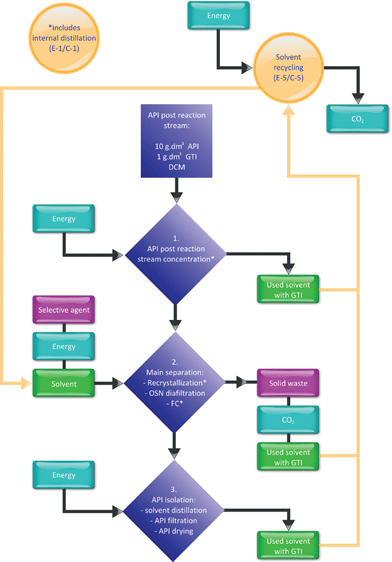 |
| | Fig. 7 Schematic of inputs and outputs of the purification processes. | |
Table 3 Summary of solvent and selective agent requirements per batch
| | | Flash chromatography | Recrystallization | OSN |
|---|
| | | DMAP | MeMS | | |
|---|
| Active layer (kg) | | 330 | 330 | 6 | 1.0 |
| | | (Silica) | (Silica) | (Charcoal) | (Membrane) |
| Fresh solvent | DCM (m3) | 3.9 | 3.1 | 1.03 | 8.25 |
| | EtOAc (m3) | 0.2 | 0.3 | | |
| | MeOH (m3) | | | 0.96 | |
| Internal distillation stage E-1/C-1 | DCM (m3) | 3.4 | 1.6 | 1.280 | 0.99 |
| | EtOAc (m3) | 0.1 | 0.3 | | |
| | MeOH (m3) | | | 0.610 | |
| Solvent disposed (A-3) or recovered by distillation (E-5/C-3) | DCM (m3) | 4.9 | 4.1 | 2.030 | 9.24 |
| | EtOAc (m3) | 0.2 | 0.3 | | |
| | MeOH (m3) | | | 0.95 | |
| Solvent make-up in case of recycle | DCM (m3) | 0.19 | 0.15 | 0.05 | 0.41 |
| | EtOAc (m3) | 0.01 | 0.02 | | |
| | MeOH (m3) | | | 0.05 | |
The selective agent (silica gel, charcoal or membrane) and solvent requirements per batch are shown in Fig. 8. DCM, EtOAc and MeOH costs are assumed as 998, 1039 and 340 euro per m3. Silica and activated carbon costs considered were 31.4 and 18.7 euro per kg and membrane cost was 2000 euro per m2. The process generating the largest amount of solid waste is flash chromatography with the disposal of 330 kg silica gel per batch (31.4 euro per kg). On the other hand, recrystallization resulting in 6 kg charcoal per batch (18.7 euro per kg) and the disposal of OSN membrane modules every two years are both negligible. The solvent in tank A-3 for disposal or recycle includes fresh solvent added during the process and the solvent from the crude API solution (1 m3). OSN is clearly the most solvent intensive process, recrystallization requiring the lowest amount of solvents. As described in Fig. 6, the processes include an internal distillation stage for API concentration and solvent exchange, which takes place at E-1/C-1. Such distillations are energy intensive, thus the amount of solvent distilled at these steps in each of the processes is also shown in Fig. 8A.
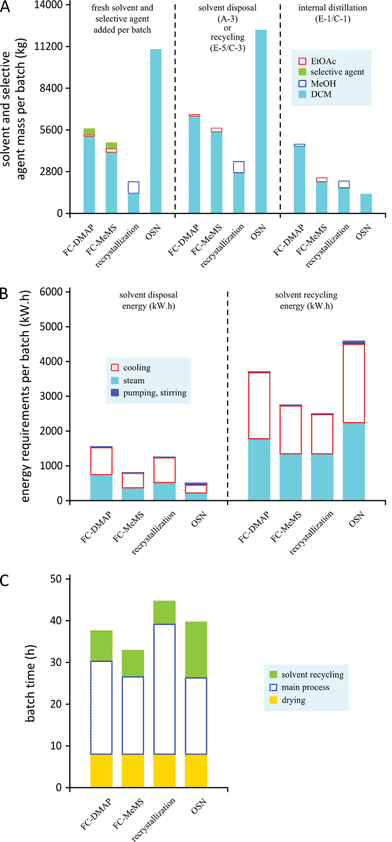 |
| | Fig. 8 Processes comparison concerning (A) solvent consumption, (B) energy consumption and (C) batch operation times. FC – flash chromatography, RC – recrystallization, and OSN – organic solvent nanofiltration. | |
The energy requirements for heating (steam) and cooling (brine) in the internal distillation stage (E-1/C-1), in the condenser C-2, in the cooling ramps of the crystallization (E-1) and for the external distillation unit (solvent recovery) were calculated taking into account solvent heat capacities and heat of vaporization and condensation. The outcome is shown in Fig. 8B.
Energy requirement calculations for pumping and stirring take into account power, time and volumes. Total batch times with and without the option of solvent recovery are considered and are shown in Fig. 8C. Taking into account main operation times, which include set-up, cleaning and shut-down times, but not drying time, between 2 and 3 shifts are required. Shifts for flash chromatography and the OSN process with two full time equivalents (FTE) of operational labour work are allocated for each shift. Recrystallization, on the other hand, given that it is a more time consuming process, is given 4 shifts and since these include operations that are more labour intensive, e.g. more handling slurries and solids, 4 FTEs are allocated for each shift for operational work. OSN is more solvent intensive, therefore for additional solvent recovery additional FTEs were considered being 2 for the OSN process, but only 1 for the other two processes. An average wage cost of 30000 euros per year was considered for operators. Total labour costs were calculated on the basis of 10 batches per year using the operating labour mentioned. Additional costs for supervision and analytical laboratory costs were calculated as 20% of operating labour costs, plant overheads being calculated as 50% of operating labour costs. Total yearly costs for the three processes are represented in Fig. 9. The process cost for purification of Meta by OSN or recrystallization is not significantly affected by which impurity, DMAP or MeMS, is removed. However, slightly different cost values were found when removing DMAP and MeMS by flash chromatography (FC) as presented in Fig. 9A and 9B.
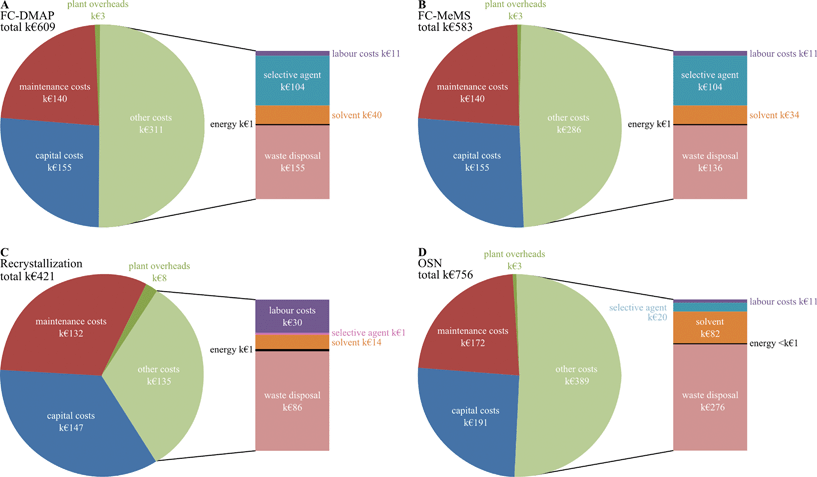 |
| | Fig. 9 Cost comparison of the three processes without solvent recycling. Similar cost structure was obtained for removal of the two GTIs by OSN and recrystallization, but slightly different values were found for removal of DMAP and MeMS by flash chromatography (FC). | |
This study considers the options of (i) sending the solvent to be disposed off-site or (ii) recovered by distillation in-site. The disposal of solvent takes place by solvent incineration implying the formation and emission of gases with a negative impact on both health and environment. The solvent recycling reduces the overall solvent requirement of the processes as well as solvent transport. These factors are not tackled in the current study, making the current analysis slightly biased towards solvent disposal. On the other hand, the energy generated by incineration was not considered which can bias towards the option of solvent recycling. The energy, potentially obtained from solvent combustion and steam generated, is significant, ranging between 5 and 25 kW h−1 depending on the actual process and efficiencies considered. These values have the potential to make the process self-sufficient in terms of steam. However, its annual economic value, between k€ 1.5 and k€ 5, is negligible in comparison with the values presented in Fig. 9. Although the current study assumes off-site liquid waste disposal, the energetic gain during solvent incineration may favour in-site incineration, an option taken in many plants. However, the analysis of building and operating an incineration unit versus off-site disposal is beyond the scope of the current study. Furthermore, the option of solvent disposal assumes that the liquid waste is sent to be disposed at a market value per volume of liquid waste with the corresponding potential economic value from energetic gains captured by the contractor and incorporated in the price charged for liquid disposal. Therefore, the economic impact of incineration is not considered in the analysis. On the other hand, incineration has an impact on carbon footprint and the respective CO2 generated is considered in the current study.
2.5 Environmental and economic impact
The three processes are conceptually quite different, however for cost comparison the variable costs, the inventory of inputs and outputs had been organized in four categories: (1) process performance indicators related to API loss and GTI removal; (2) mass intensity related to solvent consumption, discharged materials, selective agent (silica gel, charcoal or membrane) input and solid disposal; and (3) energy intensity and (4) carbon footprint. Further qualitative analysis was carried out related to (5) operation time and labour requirements; and (6) process complexity and scale-up complexity.Process performances are estimated as API loss and GTI removal and are illustrated in Fig. 3. Note that as scale increases, the fraction of API lost in a recrystallization process tends to decrease.44 The detailed data for the evaluation of mass and energy intensity are illustrated in Fig. 8. GSK suggests a metric system for assessment from 1 to 10 (the higher the better) of the impact of solvent use based on four vectors: (i) waste, considering solvent recycling, incineration, VOC and biotreatment issues; (ii) environmental impact addressing solvent fate and effect on the environment; (iii) health – acute and chronic effects and exposure potential; and (iv) safety, which considers explosivity, flammability and operational hazards. According to the GSK methodology,29 use of solvents categorized between 1 and 3 (red flag) is associated with major issues to which appropriate control procedures have to be implemented, between 4 to 7 (white flag) some issues have been identified and control procedures should be considered, and for values higher than 8 there are no issues identified. The mass intensity is dominated by the use of DCM, however it would be interesting to have an insight into mixtures with solvents of lower impact. EtOAc and methanol used in flash chromatography and recrystallization are used in high enough quantities to alter the weighted average of such impacts. The calculated values are presented in Table 4, where it is shown that only in the recrystallization process the use of higher fractions of methanol improves both the health vector to a value of 2, which is still flagged red, and the environmental impact to a value of 4, in the white flag region.
Table 4 Solvent impact on waste disposal, environment, health and safety
| | Waste | Environment | Health | Safety |
|---|
| DCM | 3 | 3 | 1 | 10 |
| EtOAc | 4 | 9 | 7 | 4 |
| MeOH | 3 | 8 | 4 | 8 |
| FC-DMAP | 3 | 3 | 1 | 10 |
| FC-MeMS | 3 | 3 | 1 | 10 |
| Recrystallization | 3 | 4 | 2 | 10 |
| OSN | 3 | 3 | 1 | 10 |
The batch time required for each process is illustrated in Fig. 8C. Note that all the processes have an 8 hour final drying step that is low labour intensive. Recrystallization is the most time consuming process and given the nature of the separation steps, strategies to decrease batch time are more challenging. However, scaling up of this process often results in a decrease of API losses and, due to the familiarity that regulator authorities have with API recrystallization, it is often a choice of preference. Scaling up flash chromatography implies a larger risk, with probable losses in efficiency. Reduction in the batch time would also be difficult without additional equipment or without losses in efficiency of the separation. OSN is regarded as a technique easily scaled up on the basis of membrane area. Batch time can be reduced by increasing membrane area. However, as OSN uses larger amounts of solvent with the option of solvent recovery significant amounts of time need to be allocated and additional distillation units deployed.
Fig. 10A shows mass intensity versus energy intensity for each of the processes and with disposal or recycling of the solvent. The efficiency of the solvent recycling was considered to be 95% for each batch, calling for 5% solvent make-up. This initial scenario might be too optimistic and therefore scenarios with only 75% and 90% efficiency were also included in Fig. 10C and 10D showing the effect on CO2 and costs. It is clearly possible to dramatically reduce mass intensity by recycling the solvent but at the cost of an increase in energy intensity, particularly for the OSN process, which is the process with the highest solvent requirements, and therefore with highest energy requirements, when the option of recycling the solvent is followed. To complement these analyses, economic (costs) and environment (CO2 intensity) metrics were considered as well. In the calculations of energy intensity, costs and associated carbon intensity, the source of energy was taken into account at 203.7 or 369 kg of CO2 and 27.4 or 93.5 euros per MW h, for steam and electricity, respectively. Solvent incineration is considered for solvent disposal. Interestingly, following the option of recycling narrows down process CO2 intensity to a range of about 100 kg of CO2 per kg of API (100 to 200 kg-CO2/kg-API), which implies a large reduction of the CO2 footprint for the OSN process (Fig. 10B). Fig. 10D shows that the cost options for solvent disposal (considering the costs of 1.35 and 3 euros per kg of chlorinated solid and liquid waste, respectively) and solvent recycle are fairly similar for flash chromatography and recrystallization but not for OSN. In the case of OSN the option of recycling is cheaper than disposal, with a yearly gain of k€ 275. The DCM used in the OSN (123 tons per year) is about double that used for flash chromatography, and thus well above the critical point at which it becomes cost effective to have a DCM in-site recovery unit (directed investment cost of k€ 150), with savings in solvent and waste treatment costs of k€ 78 and k€ 234. These figures are aligned with previous literature, a case study for reducing waste by DCM distillation in pharmaceutical processes by Dow Chemical Company,45 which aimed at an initial recycle of 50% of the DCM for a total use of 124 tons of DCM, and with a final aim of recycling 95%. The projected initial investment was k€ 140 and reported savings of raw materials and waste treatment costs were k€ 105 and k€ 335 respectively. Overall costs are very much dependent on the total API loss and Fig. 10B illustrates calculated values for the scenarios considered in the current study assuming an API value of 100 euro per kg using the values described above for the costs of API losses in addition to the GTI removal process costs.
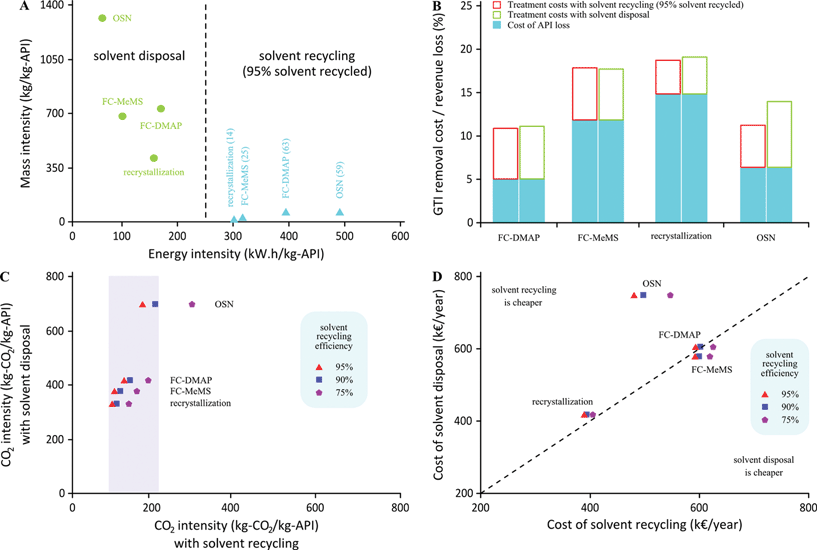 |
| | Fig. 10 Effect of solvent recycling on the environmental impact of the processes. | |
3. Conclusions
Degenotoxification of Mometasone furoate, meaning reduction of genotoxics in API post reaction streams corresponding to API related dairy intakes below the recommended TTC value of 1.5 μg day−1, was successfully achieved for DMAP and MeMS, at laboratory scale applying recrystallization, flash chromatography and OSN, except for the removal of DMAP by recrystallization. API losses during DMAP removal were 5% and 6.4% for OSN and flash chromatography, respectively. API losses during MeMS removal were 6.4%, 11.9% and 16.4% for OSN, flash chromatography and recrystallization, respectively. The cost analysis of the three processes concluded that recrystallization is the cheapest process, with intermediate energy intensity (due to the need of solvent exchanges by distillation) and lower mass and carbon intensity, although it is more labour intensive and time consuming. However, the cost analyses of the purification processes are dominated by the loss of revenue due to API loss which makes recrystallization the least cost effective process in the present study. To be considered is that during process scale-up API losses in recrystallization are usually mitigated. Recrystallization is the purification process approved in the manufacture of many APIs, therefore the use of recrystallization should not be discarded without careful analysis. Although flash chromatography is an efficient process for GTI removal, particularly for DMAP, it is the most difficult to scale-up and involves high loads of solid waste disposal. In this particular case of DMAP removal, the API ends up in a larger volume fraction of solvent (about 2.7 times larger than in the case of MeMs removal) and is then isolated after distillation, hence presenting higher energy intensity. OSN requires the use of 7 diavolumes, achieving adequate final GTI levels with acceptable API losses at the cost of high solvent consumption. Therefore, from an investment perspective, the option of solvent recycle becomes economically feasible only for OSN. In contrast, from an environmental perspective, solvent recycle (i) has a high impact in each process by reduction of mass intensity by two orders of magnitude (from 400–1300 to 14–63 kg-CO2/kg-API depending on the process) and (ii) makes the three processes comparable with regard to their carbon intensity having reduced this to a range of 100–180 kg-CO2/kg-API. The effect of solvent recycling also has a positive higher environmental impact on OSN due to lower overall solvent consumption. OSN is a process easy to scale-up with low labour intensity and batch time can be further reduced by increasing the membrane area. However, because of solvent recovery the batch time increases significantly. The three processes selected use DCM as the main solvent, with negligible amounts of EtOAc (2–5%) in flash chromatography and about 20% of methanol in recrystallization. The negative environment, health and waste impact of DCM calls for its replacement during optimization of the manufacturing process.4. Experimental procedure
4.1 Materials
GMT-oNF-2 membrane was purchased from Borsig Membrane Technology GmbH, Germany. MeOH, thin layer chromatographic (TLC) aluminium sheets (Silica Gel 60 F254) and Silica Gel 60 powder were purchased from Merck KGaA, Darmstadt, Germany. Shirasagi DC32 charcoal was purchased from Mitsubishi International Ltd. EtOAc, DCM, MeMS and ammonium hydroxide were purchased from Aldrich. DMAP was purchased from Fluka. Water from a Milli-Q-Gradient ultrapure water system (Millipore, Billerica, MA, USA) was used.4.2. Analytical methods
A GC Hewlett Packard Series II, model 6890 fitted with a 5973 Network Mass selective detector and an Agilent Technologies DB-1 3 μm, 30 m × 0.32 mm capillary column was used for MeMS quantification. The GC oven temperature was 130 °C for the first 5 min, then increased at 60 °C min−1 up to 280 °C and held for 1 min at this temperature. The injection temperature, GCMS interface and ion source temperatures were 140, 250 and 250 °C, respectively. Helium was used as the carrier gas at a flow rate of 3 cm−3 min−1. The ionizing energy was 70 eV. Mass spectra were collected at SIM mode with an m/z of 80 and Hewlett Packard MSD Chemstation 3.0 acquisition software was used. The retention time of MeMS was 3 min and compounds were identified using the National Institute of Standard Technology mass spectral library. The protocol of DMAP quantification in Meta has already been reported in the literature.464.3. Experimental process performance assessment
500 cm−3 crude API solution having 10000 mg dm−3 Meta and 1000 mg dm−3 DMAP and MeMS in DCM was prepared for each comparative assay. The feed solution was processed by (i) OSN based on the authors' recently published degenotoxification methodology,9 (ii) recrystallization based on the WO9800437 patent13 and (iii) flash chromatography based on the US4472393 patent15 (Fig. 2).4.3.2 Recrystallization procedure. The 500 cm−3 crude API solution was concentrated under reduced pressure to 10% in volume. 100 cm−3 MeOH was added and the solution was heated to 50 °C and the mixture was concentrated to 50 cm−3. Having repeated this procedure twice precipitation occurred. The solution was cooled to 20 °C over 1 hour, cooled further to 10 °C, and then agitated for 2 hours. The Meta was filtered and washed with 2 × 20 cm−3 MeOH cooled to 10 °C. To the wet cake 3 g of charcoal, 100 cm−3 MeOH and 100 cm−3 DCM were added and the API was dissolved at 50 °C followed by filtration of the charcoal. The equipment was rinsed with 2 × 20 cm−3 DCM which was combined with the API solution and concentrated under reduced pressure to 50 cm−3 yielding a slurry. 100 cm−3 MeOH was added and the mixture was concentrated under reduced pressure to 50 cm−3. The mixture was cooled to 23 °C over a period of 1 hour and then cooled further to 10 °C, followed by agitation for 2 hours. The Meta was filtered and washed with 2 × 20 cm−3 MeOH cooled to 10 °C. The product was dried in a vacuum oven at 70 °C for 24 hours.
4.3.3. OSN experimental setup and procedure. The METcell Cross-Flow System (Evonik MET) comprising high-pressure filtration cells, a tank base and a gear pump was used to carry out cross-flow filtrations of a total of 500 cm−3 crude Meta solution. Pressure was applied using nitrogen providing the driving force for the filtrations. The membranes were preconditioned by filtering 300 cm−3 pure solvent (Am = 52.8 cm2), until a constant solvent flux was obtained. Membrane rejections were estimated at 10 and 20 bar using single solute 500 cm−3 feed solutions of Meta and GTIs at concentrations of 10000 mg dm−3 and 1000 mg dm−3, respectively. Rejection values (Rx) were calculated (eqn (1)) on the basis of solute concentration in feed (CF,x) and the first 50 cm−3 permeate (CP,x) corresponding to a feed volume decrease of only 10%. Retentate concentrations (CR,x) were measured at the end of filtrations and solute mass balances were closed.| | | Rx (%) = 1 − CP,x/CF,x | (1) |
For the diafiltration assays, two filtration cells were used and 10 bar pressure was applied. An HPLC pump was connected to the tank during diafiltration, to introduce fresh solvent (VADD) to the system in order to compensate for the permeate volume (VP) and keep retentate volume constant at 500 cm−3. Mass balances were closed in the range of 3–4% and 5–6% for API and GTI, respectively. The number of diavolumes (D) is reported as defined in eqn (2). CR,x and CP,x can be estimated48 according to eqn (3) and (4). API loss, GTI removal and solvent flux were calculated by eqn (5)–(7), respectively.
| | | CR,x = CF,x exp[−VP(1 − Rx)/VF] = CF,x exp[−D(1 − Rx)] | (3) |
| | | VFCR,x = VFCR,x − VPCP,x | (4) |
| | | API loss = CR,API/CF,API (note VR = VF) | (5) |
| | | GTI removal = 1 − CR,GTI/CF,GTI (note VR = VF) | (6) |
Acknowledgements
The authors wish to acknowledge the financial support of the European Commission under Marie Cure Actions of the 7th Framework Programme, grant PITN-GA-2008-214226 [NEMOPUR] for the work described in this paper. The authors are thankful to Bruno Henriques for the analytical support and to Luís Olival for the assistance and useful discussions related to the cost analysis.References
- K. Cziner, T. Virkki-Hatakka, M. Hurme and I. Turunen, Evaluative approach for process development, Chem. Eng. Technol., 2005, 28, 1490–1499 CrossRef CAS.
- M. Degerman, N. Jakobsson and B. Nilsson, Designing robust preparative purification processes with high performance, Chem. Eng. Technol., 2008, 31, 875–882 CrossRef CAS.
- T. Winkelnkemper and G. Schembecker, Purification fingerprints for experimentally based systematic downstream process development, Sep. Purif. Technol., 2010, 71, 356–366 CrossRef CAS.
- C. Jimenez-Gonzalez, D. J. C. Constable and C. S. Ponder, Evaluating the “Greenness” of chemical processes and products in the pharmaceutical industry — a green metrics primer, Chem. Soc. Rev., 2012, 41, 1485–1498 RSC.
- C. Jimenez-Gonzalez, C. S. Ponder, Q. B. Broxterman and J. B. Manley, Using the right green yardstick: why process mass intensity is used in the pharmaceutical industry to drive more sustainable processes, Org. Process Res. Dev., 2011, 15, 912–917 CrossRef CAS.
- D. J. C. Constable, A. D. Curzons and V. L. Cunningham, Metrics to ‘green’ chemistry — which are the best?, Green Chem., 2002, 4, 521–527 RSC.
- A. D. Curzons, D. J. C. Constable, D. N. Mortimer and V. L. Cunningham, So you think your process is green, how do you know? — Using principles of sustainability to determine what is green – a corporate perspective, Green Chem., 2001, 3, 1–6 RSC.
- C. Jimenez-Gonzalez, P. Poechlauer, Q. B. Broxterman, B. S. Yang, D. am Ende, J. Baird, C. Bertsch, R. E. Hannah, P. Dell'Orco, H. Noorman, S. Yee, R. Reintjens, A. Wells, V. Massonneau and J. Manley, Key green engineering research areas for sustainable manufacturing: a perspective from pharmaceutical and fine chemicals manufacturers, Org. Process Res. Dev., 2011, 15, 900–911 CrossRef CAS.
- Gy. Székely, J. Bandarra, W. Heggie, B. Sellergren and F. C. Ferreira, Organic solvent nanofiltration: a platform for removal of genotoxins from active pharmaceutical ingredients, J. Membr. Sci., 2011, 381, 21–33 CrossRef.
- R. Kecili, D. Nivhede, J. Billing, M. Leeman, B. Sellergren and E. Yilmaz, Removal of acrolein from active pharmaceutical ingredients using aldehyde scavengers, Org. Process Res. Dev., 2012, 16, 1225–1229 CrossRef CAS.
- Gy. Székely, E. Fritz, J. Bandarra, W. Heggie and B. Sellergren, Removal of potentially genotoxic acetamide and arylsulfonate impurities from crude drugs by molecular imprinting, J. Chromatogr., A, 2012, 1240, 52–58 CrossRef.
- J. Bousquet, Mometasone furoate: an effective anti-inflammatory with a well-defined safety and tolerability profile in the treatment of asthma, Int. J. Clin. Pract., 2009, 63, 806–819 CrossRef CAS.
- D. Kwok, D. J. Tsai, C. Tann and X. Fu, Process for the preparation of 17-esters of 9α,21-dihalo-pregnane-11β,17α-diol-20-ones, WO9800437, June 1997 Search PubMed.
- E. L. Shapiro, 3,20-dioxo-1,4-pregnadiene-17α-ol 17-aromatic heterocycle carboxylates, US4,472,393, Sept 1984 Search PubMed.
- W. Heggie and J. Bandarra, Process for the preparation of mometasone furoate, US 6,177,560, Jan 2001 Search PubMed.
- R. W. Draper, B. Hu, A. T. McPhail, M. S. Puar, E. J. Vater and L. Weber, Unusual hydroxy-γ-sultone byproducts of steroid 21-methanesulfonylation: an efficient synthesis of mometasone 17-furoate (Sch 32088), Tetrahedron, 1999, 55, 3355–3364 CrossRef CAS.
- C. K. Hwang, W. S. Li and K. C. Nicolaou, Reactions of hydroxyl groups with tosylchloride-dimethylaminopyridine system: direct synthesis of chlorides from hydroxycompounds, Tetrahedron Lett., 1984, 25, 2295–2296 CrossRef CAS.
- Y. Yoshida, Y. Sakakura, N. Aso, S. Okada and Y. Tanabe, Practical and efficient methods for sulfonylation of alcohols using Ts(Ms)Cl/Et3N and catalytic Me3N·HCl as combined base: promising alternative to traditional pyridine, Tetrahedron, 1999, 55, 2183–2192 CrossRef CAS.
- L. Muller, R. J. Mauthe, C. M. Riley, M. M. Andino, D. De Antonis, C. Beels, J. DeGeorge, A. G. M. De Knaep, D. Ellison, J. A. Fagerland, R. Frank, B. Fritschel, S. Galloway, E. Harpur, C. D. N. Humfrey, A. S. Jacks, N. Jagota, J. Mackinnon, G. Mohan, D. K. Ness, M. R. O'Donovan, M. D. Smith, G. Vudathala and L. Yotti, A rationale for determining, testing, and controlling specific impurities in pharmaceuticals that possess potential for genotoxicity, Regul. Toxicol. Pharmacol., 2006, 44(3), 198–211 CrossRef.
- G. Székely, J. Bandarra, W. Heggie, F. C. Ferreira and B. Sellergren, Design, preparation and characterization of novel molecularly imprinted polymers for removal of potentially genotoxic 1,3-diisopropylurea from API solutions, Sep. Purif. Technol., 2012, 86, 190–198 CrossRef.
- S. Darvishmanesh, L. Firoozpour, J. Vanneste, P. Luis, J. Degreve and B. Van der Bruggen, Performance of solvent resistant nanofiltration membranes for purification of residual solvent in the pharmaceutical industry: experiments and simulation, Green Chem., 2011, 13, 3476–3483 RSC.
- J. T. Scarpello, D. Nair, L. M. F. dos Santos, L. S. White and A. G. Livingston, The separation of homogeneous organometallic catalysts using solvent resistant nanofiltration, J. Membr. Sci., 2002, 203, 71–85 CrossRef CAS.
- E. Rundquist, C. Pink, E. Vilminot and A. Livingston, Facilitating the use of counter-current chromatography in pharmaceutical purification through use of organic solvent nanofiltration, J. Chromatogr., A, 2012, 1229, 156–163 CrossRef CAS.
- Q. Nie, J. Wang and Q. Yin, Separation and purification of two isomorphic steroids by a novel extractive drowning out crystallization, Sep. Purif. Technol., 2006, 50, 342–346 CrossRef CAS.
- Gy. Székely, J. Bandarra, W. Heggie, B. Sellergren and F. C. Ferreira, A hybrid approach to reach stringent low genotoxic impurity contents in active pharmaceutical ingredients: combining molecularly imprinted polymers and organic solvent nanofiltration for removal of 1,3-diisopropylurea, Sep. Purif. Technol., 2012, 86, 79–87 CrossRef.
- B. P. Chekal, A. M. Campeta, Y. A. Abramov, N. Feeder, P. P. Glynn, R. W. McLaughlin, P. A. Meenan and R. A. Singer, The challenges of developing an API crystallization process for a complex polymorphic and highly solvating system, Org. Process Res. Dev., 2009, 13, 1327–1337 CrossRef CAS.
- E. Rundquist, C. Pink and A. Livingston, Organic solvent nanofiltration: a potential alternative to distillation for solvent recovery from crystallisation mother liquors, Green Chem., 2012, 14, 2197–2205 RSC.
- W. M. Nelson, Green Solvents for Chemistry: Perspectives and Practice, Oxford University Press, 2003 (Table 7.2 and Table 7.12) Search PubMed.
- Chemistry Innovation website – February 2010, http://www.chemistryinnovation.co.uk/roadmap/sustainable/roadmap.asp?id=84.
- A. D. Curzons, D. C. Constable and V. L. Cunningham, Solvent selection guide: a guide to the integration of environmental, health and safety criteria into the selection of solvents, Clean Prod. Process., 1999, 1, 82–90 Search PubMed.
- R. K. Henderson, C. Jiménez-González, D. J. C. Constable, S. R. Alston, G. G. A. Inglis, G. Fisher, J. Sherwood, S. P. Binks and A. D. Curzons, Expanding GSK's solvent selection guide – embedding sustainability into solvent selection starting at medicinal chemistry, Green Chem., 2011, 13, 854–862 RSC.
- K. Alfonsi, J. Colberg, P. J. Dunn, T. Fevig, S. Jennings, T. A. Johnson, H. Peter Kleine, C. Knight, M. A. Nagy, D. A. Perry and M. Stefaniak, Green chemistry tools to influence a medicinal chemistry and research chemistry based organisation, Green Chem., 2008, 10, 31–33 RSC.
- A. D. Curzons, D. C. Constable and V. L. Cunningham, Solvent selection guide: a guide to the integration of environmental, health and safety criteria into the selection of solvents, Clean Prod. Process., 1999, 1, 82–90 Search PubMed.
- R. K. Henderson, C. Jiménez-González, D. J. C. Constable, S. R. Alston, G. G. A. Inglis, G. Fisher, J. Sherwood, S. P. Binks and A. D. Curzons, Expanding GSK's solvent selection guide – embedding sustainability into solvent selection starting at medicinal chemistry, Green Chem., 2011, 13, 854–862 RSC.
- D. J. C. Constable, C. Jimenez-Gonzalez and R. K. Henderson, Perspective on Solvent Use in the Pharmaceutical Industry, Org. Process Res. Dev., 2007, 11, 133–137 CrossRef CAS.
- M. Berrios and R. L. Skelton, Comparison of purification methods for biodiesel, Chem. Eng. J., 2008, 144, 459–465 CrossRef CAS.
- T. Winkelnkemper and G. Schembecker, Purification performance index and separation cost indicator for experimentally based systematic downstream process development, Sep. Purif. Technol., 2010, 72, 34–39 CrossRef CAS.
- J. García-Serna, J. L. Martínez and M. J. Cocero, Green HAZOP analysis: incorporating green engineering into design, assessment and implementation of chemical processes, Green Chem., 2007, 9, 111–124 RSC.
- C. Jimenez-Gonzalez, A. D. Curzons, D. J. C. Constable and V. L. Cunningham, Cradle-to-gate life cycle inventory and assessment of pharmaceutical compounds, Int. J. Life Cycle Assess., 2004, 9(2), 114–121 CrossRef.
- C. Jimenez-Gonzalez, A. D. Curzons, D. J. C. Constable, M. R. Overcash and V. L. Cunningham, How do you select the “greenest” technology? Development of guidance for the pharmaceutical industry, Clean Prod. Processes, 2001, 3, 35–41 CrossRef.
- EMEA guidelines “Limits for Genotoxic Impurities” EMEA/CHMP/QWP/251334/2006.
- R. K. Sinnott, Chemical Engineering Design, Butterworth-Heinemann, 4 edn, vol. 6, 2005 Search PubMed.
- Impact assessment of potential restrictions on the marketing and use of dichloromethane in paint strippers, Final report for European Commission's Directorate-General Enterprise and Industry by Risk & Policy Analysts Limited, Norfolk, UK, 2007.
- S. Lee and G. Robinson, Process Development Fine Chemicals from Grams, Oxford University Press, 1995 Search PubMed.
- Impact assessment of potential restrictions on the marketing and use of dichloromethane in paint strippers, Final Report – April 2007, prepared for European Commission Directorate-General Enterprise and Industry by Risk & Policy Analysts Limited, Norfolk, UK.
- Gy. Székely, B. Henriques, M. Gil, A. Ramos and C. Alvarez, Design of experiments as a tool for LC–MS/MS method development for the trace analysis of the potentially genotoxic 4-dimethylaminopyridine impurity in glucocorticoids, J. Pharm. Biomed. Anal., 2012, 70, 251–258 CrossRef.
- W. Clark Still, M. Kahn and A. Mitra, Rapid chromatographic technique for preparative separations with moderate resolution, J. Org. Chem., 1978, 43(14), 2923–2925 CrossRef.
- M. Mulder, Basic Principles of Membrane Technology, Kluwer Academic Publishers, Dordrecht, Netherlands, 1996 Search PubMed.
|
| This journal is © The Royal Society of Chemistry 2013 |
Click here to see how this site uses Cookies. View our privacy policy here.