Redox-responsive catiomer based on PEG-ss-chitosan oligosaccharide-ss-polyethylenimine copolymer for effective gene delivery
Lejiao Jiaa, Zhenyu Lib, Dianrui Zhang*a, Qiang Zhang*c, Jingyi Shena, Hejian Guoa, Xiaona Tiana, Guangpu Liua, Dandan Zhenga and Lisi Qia
aDepartment of Pharmaceutics, College of Pharmacy, Shandong University, 44 Wenhua Xilu, Jinan250012, PR China. E-mail: zhangdianrui2006@163.com; Fax: +86 531 88382015; Tel: +86 531 88382015
bKey Laboratory of Chemical Biology of Ministry of Education, College of Pharmacy, Shandong University, 44 Wenhua Xilu, Jinan250012, PR China
cState Key Laboratory of Natural and Biomimetic Drugs, School of Pharmaceutical Sciences, Peking University, 38 Bei Xueyuan Road, Beijing 100083, PR China. E-mail: zqdodo@bjmu.edu.cn; Fax: +86 10 82802791; Tel: +86 10 82802791
First published on 18th October 2012
Abstract
The chitosan oligosaccharide-based disulfide-containing polyethylenimine derivative PEG-ss-COS-ss-PEI was synthesized and evaluated as a nonviral gene delivery carrier. The structure of the obtained polymers was confirmed by 1H NMR and FTIR. PEG-ss-COS-ss-PEI copolymers could effectively condense DNA into small particles with average diameters less than 120 nm and the zeta potential of +15.7 mV at the N/P ratio of 15/1. Additionally, the resultant polyplexes showed excellent colloidal stability against 150 mM NaCl and had a better buffering capacity of ∼44%, which was more than double the buffering capacity of PEI1.8k (∼20%). In the presence of 10 mM glutathione (GSH), however, polyplexes of PEG-ss-COS-ss-PEI were rapidly unpacked, as revealed by significant increase of particle sizes to over 800 nm. In vitro experiments revealed that the PEG-ss-COS-ss-PEI copolymers not only had much lower cytotoxicity, but also displayed high transfection efficiency as compared to the control branch 25 kDa PEI. This study indicates that a reducibly degradable copolymer PEG-ss-COS-ss-PEI composed of low molecular weight PEI, chitosan oligosaccharide and PEG via disulfide-containing linkages can be a promising gene delivery carrier.
1. Introduction
Gene therapy has attracted more and more attention for treatment of diseases of genetic defects over the past two decades.1–3 Effective gene therapy greatly depends on the availability of suitable delivery vectors, which are mainly categorized into viral vectors and nonviral vectors. Although viral vectors exhibit rather good transfection properties, their limitations such as safety, low transgenic size, immunogenicity and high cost, have provided impetus for researchers to focus on nonviral vectors.4–8 These nonviral vectors consist of a diverse set of materials which are typically cationic, and include natural and synthetic polymers, lipids, peptides, dendrimers and combinations of these structures.9–11 Cationic polymers bind and condense nucleic acids to form DNA–polymer complexes (“polyplexes”) which can protect nucleic acids from degradation and improve transfection efficiency compared with DNA alone.12,13Among the cationic polymers, polyethylenimine (PEI) has been proven to be one of the most potent nonviral gene carriers,14 due to its proton sponge effect which can buffer the environment of endosome and promote the release of the polyplexes into the cytoplasm. The well-known commercial linear or branched 25 kDa PEI, as an effective transfection reagent in vitro and in vivo, has high transfection efficiency.15,16 However, golden standard high molecular weight PEI (25 kDa) with efficient transfection, is difficult to degrade due to the absence of degradable linkages, and hence is too toxic for therapeutic applications. On the other hand, low molecular weight PEI has much less toxicity but almost no transfection activity.17 To overcome this problem, one rational approach was to combine low molecular weight PEI together using degradable linkages to form polymers or copolymers with suitable high molecular weights.
Recently, researchers have begun to focus on incorporating disulfide bonds into the structure of the gene or drug delivery vehicles.18,19 The cleavage of disulfide bond in the delivery vehicles could be mediated by thiol/disulfide exchange reactions with small redox molecules like glutathione (GSH); either alone or with the help of redox enzymes.20 It is found that the concentration of extracellular GSH is typically 100–1000 times lower than intracellular GSH,21 and therefore these disulfide linkages are relatively stable in the extracellular environment of cells, but are cleaved in the reducing intracellular environment of cells. As a result, disulfide-containing polyplexes not only exhibit high complex stability in the extracellular environment as well as in the blood, but also have greater intracellular cargo release. Nevertheless, gelation might occur easily when low molecular weight PEIs were combined with each other using degradable linkers and it is difficult to obtain soluble products.22 The alternative approach is to graft low molecular weight PEI onto chain transfer carriers such as biocompatible polymers. Chitosan, poly[b-(1,4)-linked-2-amino-2-deoxy-D-glucose], a natural-based polymer obtained by alkaline deacetylation of chitin, has been widely investigated as gene/drug vehicles since it is biocompatible, nontoxic and biodegradable.23,24 However, its high molecular weight, high viscosity and insolubility at physiological pH values (7.2–7.4) greatly restrict its successful application. Therefore, chitosan oligosaccharide (COS), the chitosan depolymerization products with low molecular weight, has attracted more and more attention as it is water-soluble and can overcome the limitations of chitosan as gene/drug carriers. Moreover, COS has reactive amino and hydroxyl groups, thus many COS derivatives for pharmaceutical application can be obtained by chemically altering its properties under mild reaction conditions.25–27
In this study, we choose COS as the chain transfer carrier in the cationic polymerization of low molecular weight PEI with the help of 3,3′-dithiodipropionic acid, which provides the disulfide linkage. Meanwhile, poly(ethylene glycol) (PEG) was introduced into the copolymer to improve the colloidal stability and reduce the toxicity of the carrier. In addition, surfaces covered with the PEG shell could protect polyplexes from uptake by the reticuloendothelial system (RES), effectively prolonging in vivo circulation time.28,29 Therefore, our gene carrier, denoted as PEG-ss-COS-ss-PEI could be relatively stable in the extracellular environment of cells and in the blood. Once the polyplex is taken up by cells, it would be disassembled to fragments of polymers with low molecular weight and release the DNA cargoes (as illustrated in Scheme 1). The released DNA enters the nucleus to perform their functions and the low molecular weight polymers could be easily degraded, thus low cytotoxicity is obtained.
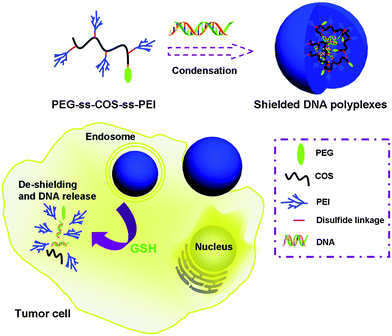 | ||
| Scheme 1 Schematic diagram illustrating PEG-ss-COS-ss-PEI copolymer for DNA encapsulation and the intracellular stimulus responsive DNA release. | ||
2. Experimental section
2.1 Materials
Chitosans (Mw = 3000 Da, deacetylation degree ≥ 85%) were purchased from Haidebei Marine Bioengineering Co. Ltd., Jinan, China. 3,3′-Dithiodipropionic acid was purchased from Tokyo Chemical Industry Co. Ltd, Japan. Branched polyethylenimine (PEI) with a molecular weight of 1800 Da was obtained form Alfa Aesar (Heysham, Lancs). 1-Ethyl-3-(3-dimethylaminopropyl) carbodiimide hydrochloride (EDC), N-hydroxysuccinimide (NHS), branched polyethylenimine (PEI) with molecular weight of 25 kDa, 3-(4, 5-dimethylthiazol-2-yl)-2,5-diphenyltetrazolium bromide (MTT) and dimethyl sulfoxide (DMSO) were obtained from Sigma Co., Ltd. (USA). Methoxypolyethylene glycol amine (mPEG-NH2, 2000 Da) was purchased from Aladdin, China. Dnase I, heparin and glutathione (GSH) were obtained form Roche, Sweden. pEGFP plasmid was kindly donated by the Department of Pharmacology, School of Medicine, Shandong University.2.2 Cell culture
Hela cells were kindly donated by the Department of Pharmacology, School of Pharmacy, Shandong University. The cells were cultured in DMEM medium, supplemented with 10% FBS, 100 U mL−1 of penicillin and 100 μg mL−1 of streptomycin. All the cells were cultured in incubators maintained at 37 °C with 5% CO2 under fully humidified conditions. All experiments were performed on cells in the logarithmic phase of growth.2.3 Synthesis of PEG-ss-COS-ss-PEI polymer
1 g of 3,3′-dithiodipropionic acid was added to 5 mL of acetyl chloride and refluxed at 65 °C for 2 h. The resultant solution was cooled to room temperature and the solvent was evaporated. Then, the residue was precipitated in diethyl ether and washed with diethyl ether repeatedly. The product 3,3′-dithiodipropionic anhydride was dried in a vacuum desiccator overnight and used directly in the next step. 80 mg of COS powder was dissolved in distilled water (25 mL) and then this solution was diluted with DMF (10 mL). Subsequently, 3,3′-dithiodipropionic anhydride (192 mg, 1 mmol) which had been dissolved in 10 mL DMF beforehand was added dropwise into the above system and stirred at room temperature for 8 h. The obtained product was purified by dialysis against DMF and water, and collected by lyophilization. The product was denoted as COS-ss-COOH.In the next step, the COS-ss-COOH obtained as above was dissolved in 20 mL of distilled water, and then 191.7 mg EDC (1 mmol) and 115 mg NHS (1 mmol) were added. After the reaction was stirred at room temperature for 30 min, 100 mg mPEG-NH2 (0.05 mmol) was added and the reaction was stirred for another 30 min. Subsequently, the mixture was added to the PEI solution which was obtained by dissolving 1.35 g of PEI (1800 Da) in 10 mL of distilled water. After the reaction was stirred for 24 h, the product was purified by dialysis against water and collected by lyophilization.
2.4 Chemical properties of PEG-ss-COS-ss-PEI copolymer
Proton nuclear magnetic resonance (1H NMR) spectra were recorded on Varian inova 600 MHz spectrometer (USA) using D2O as solvent. Fourier transform infrared spectrometer (FT-IR) spectra were collected on an FT-IR spectrometer (BRUKER VERTEX 70, German). The IR spectra, in absorbance mode, were obtained over the spectral region 400 to 4000 cm−1. The molecular weight (Mw) of polymers was determined by GPC (Waters 1515, USA) equipped with a refractive index detector (Waters 2414) and columns (Wasters Ultrahydrogel 250). A buffer solution (0.2 M sodium acetate–0.2 M acetic acid = 47![[thin space (1/6-em)]](https://www.rsc.org/images/entities/char_2009.gif) :
:![[thin space (1/6-em)]](https://www.rsc.org/images/entities/char_2009.gif) 58) was used as eluent at flow rate of 1 mL min−1. The PEI content in the PEG-ss-COS-ss-PEI polymer was quantified by spectrophotometry of its copper chelate at 630 nm as described earlier.30
58) was used as eluent at flow rate of 1 mL min−1. The PEI content in the PEG-ss-COS-ss-PEI polymer was quantified by spectrophotometry of its copper chelate at 630 nm as described earlier.302.5. Buffering capacity of PEG-ss-COS-ss-PEI polymer
A polymeric carrier's buffering capacity can affect its potential for endolysosomal escape and its delivery success.31 Buffering capacity is defined as the percentage of positively charged groups that become protonated from pH 7.5–5.1.32 The buffer capabilities of PEG-ss-COS-ss-PEI polymer, branch PEI with the molecular weight of 25 kDa (PEI25k) and branch PEI with the molecular weight of 1.8 kDa (PEI1.8k) were determined by acid–base titration assays over a pH range from 4.0 to 11.0. Briefly, the polymer (0.1 mmol nitrogen atoms) was dissolved in 20 mL of 150 mM NaCl solution. The solution was brought to a starting pH ∼ 11 with 0.1 M NaOH and then 0.1 M HCl was added to polymer solutions in the increments of 40 μL. The pH was measured at each point. The buffer capacity was calculated according to the following equation:| The buffer capacity (%) = (δVHCl × 0.1 M)/N (mmol) × 100 |
2.6 DNA binding efficiency of cationic polymers
To assess DNA condensation ability of the polymers, DNA binding assay was performed. Briefly, 6 μL of plasmid (0.1 μg) was mixed with the required amount of polymer to obtain the N/P ratios at 1, 2.5, 5, 10, 20, 40 and 60, wherein N/P ratio is the ratio of concentrations of total nitrogen atoms (N) of the polymer to the phosphate groups (P) of DNA. After the mixture was incubated at ambient temperature for 30 min, the formed polyplex was mixed with loading buffers and loaded into a 1% agarose gel containing ethidium bromide. Gel electrophoresis was run at room temperature in TAE buffer at 150 V for 20 min. DNA bands were visualized by Bio-Rad Molecular Imager (ChemiDoc™ XRS+, Hercules, CA.)2.7 Dnase I protection assay
For successful gene delivery, polymeric carriers could be able to protect gene cargoes from in vivo enzymatic degradation. A Dnase I protection assay was performed to determine the DNA protection potential of PEG-ss-COS-ss-PEI copolymers relative to the unmodified polymer PEI25k. Briefly, polyplexes were prepared as previously described and subsequently exposed to Dnase I (1U per μg pDNA) for 30 min. The Dnase I was inactivated by adding 8 μL of EDTA (0.5 M, pH 8.0). Then 3 μL of heparin was added and the mixture was incubated for 5 min. The pDNA integrity was assessed by agarose gel electrophoresis as described above.2.8 Particle size, ζ-potential and morphology measurement
Particle size and ζ-potential were measured by Zetasizer 3000 (Malvern Instruments Ltd., UK). The complexes at the N/P ratios at 5, 10, 15 and 20 were prepared as described above. If necessary, the polyplexes were diluted by 150 mM NaCl solution prior to measurement. To visualize PEG-ss-COS-ss-PEI–pDNA complexes, polyplexes were prepared at the N/P ratio of 15/1 and the sample was investigated by transmission electron microscopy (TEM) (H-7000, Hitachi, Japan).2.9 The redox-responsive destabilization and colloidal stability of polyplexes
To assess the responsive capacity of polyplexes to the reductive environment, particle changes determined by DLS and gel electrophoresis are the most common methods and our test was performed following a protocol previously published.33–35 In brief, the polyplexes were formed at the N/P ratio of 15/1, and an adequate amount of GSH was added to establish a 10 mM GSH solution mimicking intracellular microenvironment redox conditions. The particle sizes of this suspension were measured at 0 h, 1 h, 2 h and 4 h, respectively. To determine whether our reducible polymers are sufficient to facilitate release of pDNA, bioreducible polymer was reduced with GHS and the amount of released pDNA was assessed by agarose gel electrophoresis in the presence of heparin, which could make the results more visible. PEG-ss-COS-ss-PEI–pDNA polyplexes were incubated in 10 mM GSH for 2 h and 1 μL of heparin was added. Other experimental conditions are the same as described above.The colloidal stabilities of PEG-ss-COS-ss-PEI–pDNA and COS-ss-PEI–pDNA polyplexes were also studied. The polyplexes were prepared as described above following addition of 150 mM NaCl. The particle sizes of polyplexes were measured at 0 h, 1 h, 2 h and 4 h, respectively.
2.10 Evaluation of cytotoxicity
The cytotoxicity of polyplexes was determined by 3-(4,5-dimethylthiazol-2-yl)-2,5-diphenylazolium bromide dye reduction method (the MTT assay). Briefly, Hela cells were seeded in 96-well plates at the density of 4 × 10³ cells per well per 100 μL. After the cells had been incubated for 24 h, the polyplexes dispersions were added to give varying N/P ratios from 1/1 to 60/1, and the cells were cultured for 4 h at 37 °C. Next, the polyplexes were removed, 180 μL of fresh culture medium containing 10% serum was added, and the cells were cultured for another 48 h. 20 μL of MTT (5 mg mL−1) solution were added to each well. The plate was incubated for an additional 4 h allowing viable cells to reduce the yellow tetrazolium salt (MTT) into purple blue formazan crystals, and then the medium was removed. 200 μL DMSO was added to each well to dissolve any purple formazan crystals formed. The plates were vigorously shaken before taking measurement of relative color intensity. The absorbance of each well was measured by a microplate reader (Bio-Rad680, USA) at a test wavelength of 570 nm. The cell inhibitory rate was calculated as follows: inhibitory rate = (1 − Abs570treated cells/Abs570control cells) × 100%.2.11 In vitro gene transfection
Transfection experiments were performed in Hela cells using the plasmid pEGFP as a reporter gene. Transfection studies were conducted using polyplexes formed at N/P ratio of 5/1 to 20/1. The cells were plated in 24-well plates (4 × 10⁴ cells per well) and maintained in DMEM supplemented with 10% FBS until 70–80% confluency. The cells were rinsed with PBS and incubated with 100 μL of polyplex dispersions (1 μg of plasmid DNA per well) and 400 μL of culture medium without serum for 4 h at 37 °C. Next, the polyplexes were removed, 500 μL of fresh culture medium containing 10% serum was added, and the cells were cultured for 48 h. GFP-positive cells were then observed using fluorescence microscope (OLYMPUS, IX 71, Japan). To quantitatively study the transfection efficiency, cells were collected and measured with flow cytometer (FACScan, Becton Dickinson, CA). The PEI25k–DNA complex, prepared at an optimal N/P ratio of 10/1, was used as a reference.3. Results and discussion
3.1 Polymer synthesis and characterization
The cationic copolymer PEG-ss-COS-ss-PEI was synthesized by two steps, as shown in Fig. 1. Due to 3,3′-dithiodipropionic acid having two active carboxyl groups, crosslinking copolymerization among COS could easily happen, if 3,3′-dithiodipropionic acid was directly reacted with COS. Therefore, 3,3′-dithiodipropionic acid was firstly dehydrated to form 3,3′-dithiodipropionic anhydride and then 3,3′-dithiodipropionic anhydride was reacted with the amino groups of COS. In order to carboxylate COS as more as possible, the feed ratio of 3,3′-dithiodipropionic anhydride and amino groups of COS was controlled at 3![[thin space (1/6-em)]](https://www.rsc.org/images/entities/char_2009.gif) :
:![[thin space (1/6-em)]](https://www.rsc.org/images/entities/char_2009.gif) 1 (according to our preliminary study). The excess of 3,3′-dithiodipropionic acid was removed through dialysis after reaction to avoid crosslinking in the next step. Then the obtained COS-ss-COOH was activated by NHS ester, and mPEG-NH2 was added into the reaction. After reaction for 0.5 h, the mixture was added into the PEI1.8k solution for reacting additional 24 h to obtain the final product PEG-ss-COS-ss-PEI. In our preliminary study, chitosan (60 kDa) was chosen as the chain transfer carrier to synthesis the PEG-ss-COS-ss-PEI polymer. However, due to its insolubility at neutral pH value and high viscosity, the soluble product was difficult to obtain. When COS was used as the carrier, the soluble product was easily gained, probably contributing to the COS having good solubility at the neutral water and low viscosity.
1 (according to our preliminary study). The excess of 3,3′-dithiodipropionic acid was removed through dialysis after reaction to avoid crosslinking in the next step. Then the obtained COS-ss-COOH was activated by NHS ester, and mPEG-NH2 was added into the reaction. After reaction for 0.5 h, the mixture was added into the PEI1.8k solution for reacting additional 24 h to obtain the final product PEG-ss-COS-ss-PEI. In our preliminary study, chitosan (60 kDa) was chosen as the chain transfer carrier to synthesis the PEG-ss-COS-ss-PEI polymer. However, due to its insolubility at neutral pH value and high viscosity, the soluble product was difficult to obtain. When COS was used as the carrier, the soluble product was easily gained, probably contributing to the COS having good solubility at the neutral water and low viscosity.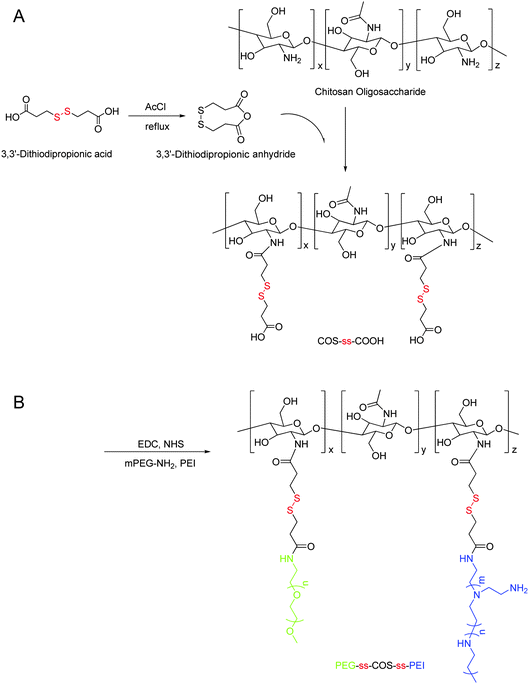 | ||
| Fig. 1 Synthesis of the PEG-ss-COS-ss-PEI copolymer. | ||
The structure confirmation of the PEG-ss-COS-ss-PEI copolymer was resorted to 1H NMR and FT-IR spectra. The 1H NMR spectra of the polymers were shown in Fig. 2. Compared with the spectrum of COS, COS-ss-COOH exhibited some new proton peaks at 2.39–2.44 and 2.7–2.7 ppm which were contributed to –CH2CH2S–. Hence, it was indicated that 3,3′-dithiodipropionic acid was successfully grafted to the COS chain. As for PEG-ss-COS-ss PEI copolymer, the very strong proton peaks of –CH2CH2O– showed at 3.4–3.5 ppm implying that PEG chain was grafted to the COS chain. As for grafting PEI, it was confirmed by its proton peaks (–NHCH2CH2–) appeared at 2.5–3.0 ppm.
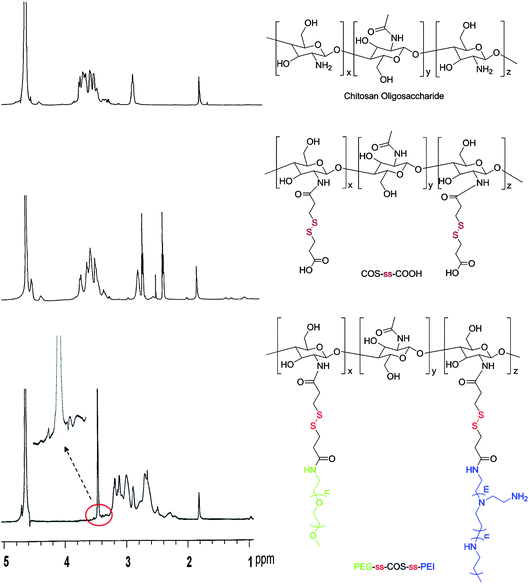 | ||
| Fig. 2 The 1H NMR spectra of the polymers. | ||
The FT-IR spectrum of the polymer was shown in Fig. 3. The FT-IR spectrum of the PEG-ss-COS-ss-PEI copolymer (Fig. 3(D)) shows a peak at 896 cm−1 in the fingerprint region which was contributed to by νC–O in the pyranose ring of COS, and hence it indicated that COS was the framework of our copolymer PEG-ss-COS-ss-PEI. The bands around at 1648 cm−1 and 1566 cm−1 are due to the absorption of νC![[double bond, length as m-dash]](https://www.rsc.org/images/entities/char_e001.gif) O and δNH of the –CONH– group; nevertheless strengths of these peaks were significantly stronger than those in COS (Fig. 3(C)). Therefore, it was confirmed the disulfide linker was successfully grafted on the COS. Besides, peaks appeared at 1472, 1412 and 816 cm−1 were attributed to the absorption of –CH2CH2NH– moieties which were from PEI1.8k. As for PEG, its characteristic peak at 842 cm−1 contributing to the absorption of δCH2 from –[CH2CH2O]n– was also found in the spectrum of the PEG-ss-COS-ss-PEI polymer. So, 1H NMR and FT-IR spectra results suggested that the PEG-ss-COS-ss-PEI copolymer were successfully synthesized.
O and δNH of the –CONH– group; nevertheless strengths of these peaks were significantly stronger than those in COS (Fig. 3(C)). Therefore, it was confirmed the disulfide linker was successfully grafted on the COS. Besides, peaks appeared at 1472, 1412 and 816 cm−1 were attributed to the absorption of –CH2CH2NH– moieties which were from PEI1.8k. As for PEG, its characteristic peak at 842 cm−1 contributing to the absorption of δCH2 from –[CH2CH2O]n– was also found in the spectrum of the PEG-ss-COS-ss-PEI polymer. So, 1H NMR and FT-IR spectra results suggested that the PEG-ss-COS-ss-PEI copolymer were successfully synthesized.
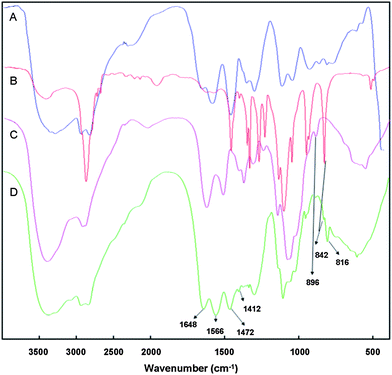 | ||
| Fig. 3 The FT-IR spectra: (A) PEI1.8k; (B) mPEG-NH2; (C) COS; (D) PEG-ss-COS-ss-PEI. | ||
Due to the amino content affecting the DNA delivery capacity of polymers, the effect of the feed ratio of PEI to the COS monomers on the PEI grafting degree was evaluated. As shown in Fig. 4(A), the PEI grafting degree increased with the feed ratio increasing. When the feed ratio was greater than one, it had little effect on the PEI grafting degree. Consequently, the feed ratio was fixed at 1.5![[thin space (1/6-em)]](https://www.rsc.org/images/entities/char_2009.gif) :
:![[thin space (1/6-em)]](https://www.rsc.org/images/entities/char_2009.gif) 1 to synthesize our copolymer which was used for further study. The PEI content in the PEG-ss-COS-ss-PEI polymer was quantified by spectrophotometry of its copper chelate at 630 nm. The regression equation was Y = 0.8362C − 0.008 (r = 0.9999, where A represents the absorbance at 630 nm and C represents the concentration of PEI1.8k) and the PEI content was 64.1% (w/w). The PEG grafting degree (the grafting degree was defined as the percentage of PEG grafted to COS per glucosamine unit, including nonacetylated and acetylated glucosamine units) was determined by comparing the 1H NMR signal integrals from –CH2CH2O– protons of PEG with integrals of the polysaccharide backbone proton signals and the result was 11.4%. The molecular weight of PEG-ss-COS-ss-PEI was 22.3 kDa (Mw) measured by GPC with a PDI of 1.21 (the representative GPC trace of PEG-ss-COS-ss-PEI was shown in Fig. 4(B)).
1 to synthesize our copolymer which was used for further study. The PEI content in the PEG-ss-COS-ss-PEI polymer was quantified by spectrophotometry of its copper chelate at 630 nm. The regression equation was Y = 0.8362C − 0.008 (r = 0.9999, where A represents the absorbance at 630 nm and C represents the concentration of PEI1.8k) and the PEI content was 64.1% (w/w). The PEG grafting degree (the grafting degree was defined as the percentage of PEG grafted to COS per glucosamine unit, including nonacetylated and acetylated glucosamine units) was determined by comparing the 1H NMR signal integrals from –CH2CH2O– protons of PEG with integrals of the polysaccharide backbone proton signals and the result was 11.4%. The molecular weight of PEG-ss-COS-ss-PEI was 22.3 kDa (Mw) measured by GPC with a PDI of 1.21 (the representative GPC trace of PEG-ss-COS-ss-PEI was shown in Fig. 4(B)).
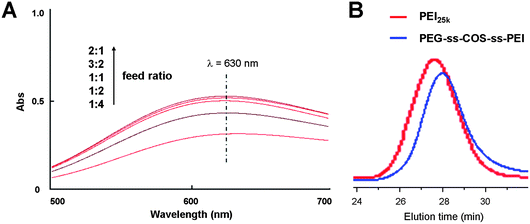 | ||
| Fig. 4 (A) The UV absorption spectra of copper chelates of PEG-ss-COS-ss-PEI prepared by different feed ratio of PEI to the COS monomers. (B) The representative GPC trace of PEG-ss-COS-ss-PEI. | ||
3.2 Buffering capacity of PEG-ss-COS-ss-PEI copolymer
After the polyplexes are taken up by cells, successful endosome escape is vital for the effective transfection. The endosome has a pH ∼ 7.0, which ultimately drops to pH ∼ 4 as the vesicle matures from an endosome to a lysosome.36,37 If the polyplexes could not escape from the endolysosome, it would be eventually degraded. It was reported that lipoplexes (complexes containing cationic lipids and nucleic acids) has been shown to promote endosomal release by increasing the interactions between the liposomal and endosomal membranes.38,39 For the polyplexes, it has been mainly attributed to their high buffering capacity, which has been showed to mediate endosomal release via the proton-sponge effect.40 To determine the buffering capacity of our cationic copolymers, we performed a titration assay in which 0.1 M HCl was added to polymer solutions in increments of 40 μL and the change in pH value was recorded. For the polymers with the high buffering capacity, a greater amount of acid need be added for decreasing the pH value of the polymer solution. The buffering capacity was calculated as the percentage of amine groups being protonated when the pH drops from pH 7.4 to 5.1. The results showed that the PEG-ss-COS-ss-PEI polymer had a buffering capacity of ∼44%, which was more than double the buffering capacity of PEI1.8k (∼20%). Compared with the buffering capacity of PEI25k (∼32%), the buffering capacity of our fabricated copolymer was still significantly improved (p < 0.05). The improvement in buffering capacity is also evident in the obtained titration curves (Fig. 5).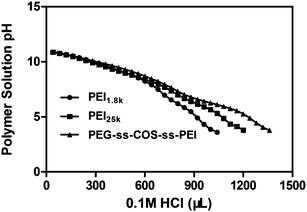 | ||
| Fig. 5 The pH titration of PEI1.8k, PEI25k and PEG-ss-COS-ss-PEI polymers. | ||
3.3 Biophysical characterization of DNA polyplexes
Cationic polymers bind genes through electrostatic interactions between the positively charged polymer and the negatively charged DNA. The amines of a polymer backbone, however, have been related to high cytotoxicity.41 Therefore, it would be beneficial to develop a carrier that can carry larger amounts of DNA cargo at lower polymer concentrations. We compared the ability of PEI25k and our fabricated copolymer PEG-ss-COS-ss-PEI to complex pDNA at N/P ratios ranging from 1![[thin space (1/6-em)]](https://www.rsc.org/images/entities/char_2009.gif) :
:![[thin space (1/6-em)]](https://www.rsc.org/images/entities/char_2009.gif) 1 to 60
1 to 60![[thin space (1/6-em)]](https://www.rsc.org/images/entities/char_2009.gif) :
:![[thin space (1/6-em)]](https://www.rsc.org/images/entities/char_2009.gif) 1 using agarose gel electrophoresis, as shown in Fig. 6. As for PEI25k, it could condense pDNA at the N/P ratio of 1
1 using agarose gel electrophoresis, as shown in Fig. 6. As for PEI25k, it could condense pDNA at the N/P ratio of 1![[thin space (1/6-em)]](https://www.rsc.org/images/entities/char_2009.gif) :
:![[thin space (1/6-em)]](https://www.rsc.org/images/entities/char_2009.gif) 1, while an obscure strip was still found (Fig. 6(A)). For the PEG-ss-COS-ss-PEI copolymer, the absence of a UV-intensive band at N/P ratios ≥1/1 implies effective pDNA condensation (Fig. 6(B)). It was considered that PEI1.8k was effectively polymerized based on COS as the chain transfer carrier and our constructed polymer showed superior pDNA binding capacity.
1, while an obscure strip was still found (Fig. 6(A)). For the PEG-ss-COS-ss-PEI copolymer, the absence of a UV-intensive band at N/P ratios ≥1/1 implies effective pDNA condensation (Fig. 6(B)). It was considered that PEI1.8k was effectively polymerized based on COS as the chain transfer carrier and our constructed polymer showed superior pDNA binding capacity.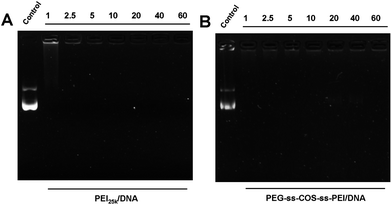 | ||
| Fig. 6 Agarose gel electrophoresis of polyplexes prepared at different N/P ratio: (A) PEI25k; (B) PEG-ss-COS-ss-PEI. | ||
The particle size of the polyplexes is a critical factor for gene delivery and could affect the transfection efficiency. The particle sizes of polyplexes at N/P ratio from 5 to 20 were investigated. As shown in Fig. 7(B), the particle sizes of PEG-ss-COS-ss-PEI–pDNA complexes were similar with the PEI25k–pDNA complexes. Both two kinds of polymers could form compact complexes with the particle size below 200 nm. The particle size became smaller with increasing the N/P ratio from 5 to 15. When the N/P ratio is increased further, the particle size of polyplexes did not alter. The surface charge of the polyplexes was estimated by measuring the zeta-potential of the polyplexes. As shown in Fig. 7(C), at the N/P ratios from 5 to 20, the zeta potentials are positive which implied complete condensation. With increasing the N/P ratio, the zeta potential of the PEI25k–pDNA complexes rapidly increased compared with that of PEG-ss-COS-ss-PEI–pDNA complexes. Besides, at the same N/P ratio, zeta potential of PEI25k–pDNA complexes was significantly higher than that of PEG-ss-COS-ss-PEI–pDNA complexes. For example, at the N/P ratio of 15, the zeta potential of PEI25k–pDNA complexes was +28.4 mV, while for the PEG-ss-COS-ss-PEI–pDNA complexes, it was +15.7 mV. It was indicated that the positive charges of the surface of PEG-ss-COS-ss-PEI–pDNA complexes were partly shielded by the hydrophilic PEG chains.42,43 Although, the zeta potential decrease might affect the stability of polyplexes, the polyplexes could have the same good stability resulting from the steric hindrance from PEG chains.44
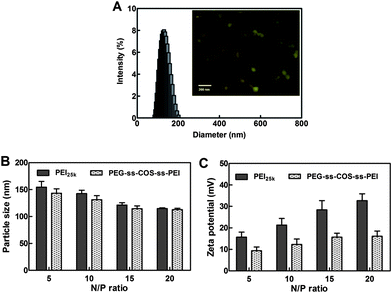 | ||
| Fig. 7 (A) The size distribution and TEM (inset) of representative polyplexes. (B) The particle sizes of polyplexes at different N/P ratio (n = 3). (C) The zeta potential of polyplexes at different N/P ratio (n = 3). | ||
The particle size distribution displayed in Fig. 7(A) reveals a narrow distribution of polyplexes with a mean particle size of ∼120 nm. The inset in Fig. 7(A) exhibited a representative TEM image where polyplexes are shown as spherical aggregates with a particle size between 40 and 80 nm. Particle size displayed by microscopy is considered as an absolute measurement of particle size and it can distinguish aggregates from single particles. The mechanism of particle size measurement for DLS technology is to determine the size distribution of the particles scattering light. Hence, the particle size revealed by DLS is larger than that measured by microscopy.
3.4 Dnase I protection assay
To further evaluate the ability of PEG-ss-COS-ss-PEI to protect pDNA against enzymatic degradation, polymer–pDNA prepared at the N/P ratios from 1 to 60 were exposed to DNase I. As controls, PEI25k–pDNA was treated with DNase I as above. As shown in Fig. 8(A), the naked pDNA was completely degraded by DNase I. After the pDNA was delivered by PEI25k, the resistance toward DNase I was enhanced compared with the naked pDNA; nevertheless, the N/P ratio of PEI25k–pDNA was required up to 10 (Fig. 8(B)). As for PEG-ss-COS-ss-PEI, it could effectively protect DNA with the N/P ratio up to 5 (Fig. 8(C)). Besides, the protection capacities of PEG-ss-COS-ss-PEI were all stronger than that of PEI25k at the same N/P ratio. These findings suggest that pDNA incorporated into the PEG-ss-COS-ss-PEI complexes is better protected than that in PEI25k complexes.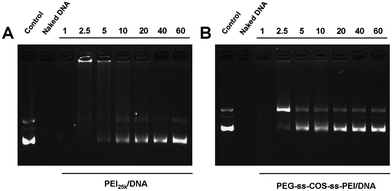 | ||
| Fig. 8 Polymers protect pDNA from enzymatic degradation at different N/P ratios: (A) PEI25k; (B) PEG-ss-COS-ss-PEI. | ||
3.5 The colloidal stability and redox-responsive destabilization of polyplexes
The PEG modifications have been explored to enhance the colloidal stability of polyplexes and to prolong their circulation time. The colloidal stability of PEG-ss-COS-ss-PEI polyplexes prepared at an N/P ratio of 15/1 was studied. Remarkably, no change in particle size was observed for polyplexes within 12 h following addition of 150 mM NaCl (Fig. 9(A)), while the particle size of COS-ss-PEI was changed to about 320 nm. Therefore the PEG-ss-COS-ss-PEI polyplex had good colloidal stability likely due to the PEG shield.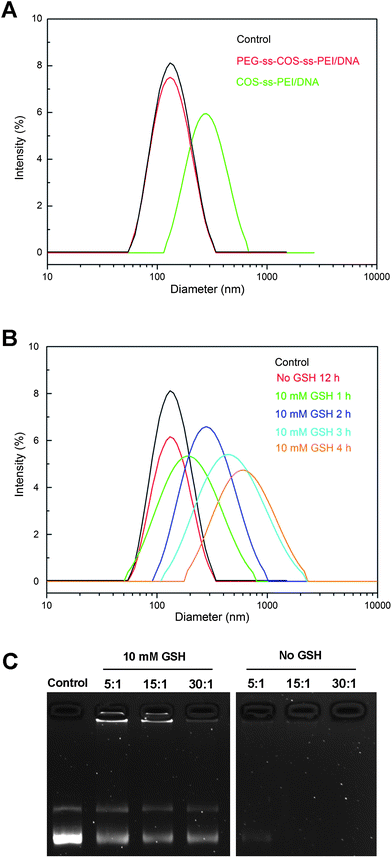 | ||
| Fig. 9 (A) The influence of 150 mM NaCl on the particle size of polyplexes; (B) the influence of 10 mM GSH on particle size of polyplexes prepared from PEG-ss-COS-ss-PEI polymer at the N/P ratio of 15/1; (C) redox-induced release of pDNA from PEG-ss-COS-ss-PEI polyplexes. | ||
To investigate whether polyplexes based on PEG-ss-COS-ss-PEI copolymer would be unpacked under an intracellular mimicking reductive environment, particle sizes of polyplexes were determined in response to 10 mM GSH from 1 h to 4 h. It was found that the particle sizes of PEG-ss-COS-ss-PEI–pDNA complexes rapidly increased to over 800 nm in 4 h following addition of 10 mM GSH (Fig. 9(B)). While for the PEG-ss-COS-ss-PEI–pDNA complexes without adding of GSH, the particle size was almost unchanged. The response of the complexes to GSH was also assessed by agarose gel electrophoresis. As shown in Fig. 9(C), most of the pDNA was retained in the wells by complexation with PEG-ss-COS-ss-PEI under no GSH conditions and even in the presence of heparin, pDNA was still not released from the polyplexes. However, reduction of PEG-ss-COS-ss-PEI by 10 mM GSH led to release of pDNA into the gel when heparin with the same low concentration as above was added. It is most likely attributed to cleavage of disulfide bond resulting in PEI1.8k and COS fractions that are not able to condense DNA effectively due to their low charge density. Hence, heparin with a low concentration could effectively release pDNA from polyplexes. Although the integrity and stability are important for polyplexes to escape from endosome and to protect DNA from degradation, the too strong association of polymers with DNA remained a major rate-limiting step for the release of DNA in cytosol, which is essential for effective DNA transcription and protein expression. The results above showed that the introduction of disulfide bonds in the copolymers could not only improve the stability of polyplexes but also make the DNA release more easily in cytosol. The reason is as follows. The disulfide bonds within PEG-ss-COS-ss-PEI could largely be cleaved by intracellular GSH through disulfide cleavage fractions, which favored complex dissociation, DNA release in the cytosol, and subsequent nucleic transport.
3.6 In vitro cytotoxicity and transfection
The cytotoxicity of PEG-ss-COS-ss-PEI polyplexes was evaluated in Hela cells by MTT assays at varying N/P ratios from 1/1 to 60/1. The COS-ss-PEI, PEI1.8k and PEI25k were used as controls. As shown in Fig. 10, the results displayed that polyplexes of PEI1.8k and PEG-ss-COS-ss-PEI induced low cytotoxic effect and the cell viabilities were above 80% when the N/P ratio was up to 40/1. In comparison, significant toxicity with a cell viability of 31.3% was observed for PEI25k at an N/P ratio of 20/1. Up the N/P ratio of 2.5, COS-ss-PEI exhibited higher cytotoxicity than PEG-ss-COS-ss-PEI (p < 0.05), though it was more biocompatible than PEI25k. Therefore, applying COS as the chain transfer carrier and disulfide bond as the linker to crosslink PEI1.8k and PEG could remarkably decrease the cytotoxicity, although the molecular weight of our fabricated polymer was similar with that of PEI25k.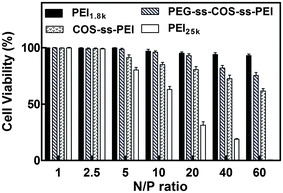 | ||
| Fig. 10 Cell viabilities of polymer–pDNA complexes in Hela cells at N/P ratios from 1/1 to 60/1 (n = 3). | ||
The in vitro transfection activity of PEG-ss-COS-ss-PEI was evaluated at the N/P ratios from 5/1 to 20/1 in Hela cells using pEGFP as a reporter gene. pEGFP expression in Hela cells following exposure to polyplexes was qualitatively evaluated by fluorescence microscopy and quantitatively assessed using flow cytometry. The density of fluorescent cells visible under the microscope after transfection with PEG-ss-COS-ss-PEI was obtained. Among them the highest fluorescent density was achieved when cells were exposed to polyplexes at the N/P ratio of 15/1 and 20/1, and the representative picture was shown in Fig. 11(A). Hela cells had better growth shapes in the picture, which was consist with the results of in vitro cytotoxicity assay (cell viability was above 90%, when cells were exposed to the polyplexes at the N/P ratio of 20). pEGFP expression was quantitatively evaluated by flow cytometry, the result was displayed as Fig. 11(D). The high transfection efficiencies were gained when the N/P ratios of polyplexes were 15/1 and 20/1 (p > 0.05). The transfection efficiency of polyplexes at the N/P ratio of 15/1 was over 1.5-fold higher than that of PEI25k control. To investigate whether introduction of PEG to the copolymer could influence the transfection, the transfection efficiency of COS-ss-PEI was also studied as control. The results (Fig. 10(B) and (D)) showed that there was no significant difference of transfection efficiency (p > 0.05) between PEG-ss-COS-ss-PEI and COS-ss-PEI. It was reported that the stealth effect of PEG while enhancing polyplexes colloidal stability and reducing the cytotoxicity of polyplexes usually results in diminished transfection potency in vitro and in vivo due to poor cellular uptake.45 Interestingly, we found that our PEG-ss-COS-ss-PEI copolymer exhibit low cytotoxicity and enhanced transfection efficiency comparable to 25 kDa PEI standards. It was probably due to that the polymer only partially shielded DNA polyplexes.46,47 Hence, it appears that grafting PEG and low molecular weight PEI to COS with the help of disulfide bonds is a potential approach to obtain nontoxic and efficient nonviral gene transfer agents.
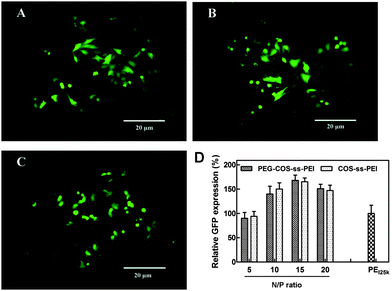 | ||
| Fig. 11 Transfection efficiency of the polyplexes: (A) the representative fluorescence image of the cells exposed to PEG-ss-COS-ss-PEI–DNA complex at the N/P ratio of 15/1; (B) the representative fluorescence image of the cells exposed to COS-ss-PEI–DNA complex at the N/P ratio of 15/1; (C) the representative fluorescence image of the cells exposed to the PEI25k–DNA complex at the N/P ratio of 10/1 as the control; (D) the relative GFP expression efficiency of polyplexes (n = 3). | ||
4. Conclusions
We have developed a redox-responsive PEG-ss-COS-ss-PEI copolymer based on COS as the transfer chain to polymerize PEG and low molecular weight PEI with the help of disulfide bonds. The synthesized PEG-ss-COS-ss-PEI copolymer as a gene delivery carrier shows excellent transfection efficiency in Hela cells. The introduction of PEG into the copolymer could improve the colloidal stability and reduce the cytotoxicity of the carrier. Besides, the PEG-ss-COS-ss-PEI can protect the pDNA from nuclease degradation during extracellular transit. When the polyplex was taken up by cells, it was dissociated owing to disulfide cleavage induced by intracellular GSH, and pDNA release for nuclear transport and gene transcription. Additionally, the toxicity of PEG-ss-COS-ss-PEI is very low compared to the control PEI25k. In summary, PEG-ss-COS-ss-PEI shows great potential as an efficient and safe nonviral gene vector.Acknowledgements
The financial support of this work is the National Basic Research Program of China (973 Program; no. 2009CB930300).References
- X. Guo and L. Huang, Acc. Chem. Res., 2012, 45, 971–979 CrossRef CAS.
- S. B. Hartono, W. Gu, F. Kleitz, J. Liu, L. He, A. P. J. Middelberg, C. Yu, G. Q. Lu and S. Z. Qiao, ACS Nano, 2012, 6, 2104–2117 CrossRef CAS.
- H. Y. Xue and H. L. Wong, ACS Nano, 2011, 5, 7034–7047 CrossRef CAS.
- G. G. d'Ayala, A. Calarco, M. Malinconico, P. Laurienzo, O. Petillo, A. Torpedine and G. Peluso, J. Biomed. Mater. Res., Part A, 2010, 94, 619–630 Search PubMed.
- S. Zhang, Y. Zhao, B. Zhao and B. Wang, Bioconjugate Chem., 2010, 21, 1003–1009 CrossRef CAS.
- M. Kumar, K. Jinturkar, M. R. Yadav and A. Misra, Crit. Rev. Ther. Drug Carrier Syst., 2010, 27, 237–278 CrossRef CAS.
- X. Xu, H. Yuan, J. Chang, B. He and Z. Gu, Angew. Chem., 2012, 124, 3184–3187 CrossRef.
- H. Dong, J. Lei, H. Ju, F. Zhi, H. Wang, W. Guo, Z. Zhu and F. Yan, Angew. Chem., 2012, 124, 4685–4690 CrossRef.
- G. Romano, Drug News Perspect., 2007, 20, 227–231 CAS.
- D. A. Jackson, S. Juranek and H. J. Lipps, Mol. Ther., 2006, 14, 613–626 CrossRef CAS.
- C. Cheng, A. J. Convertine, P. S. Stayton and J. D. Bryers, Biomaterials, 2012, 33, 6868–6876 CrossRef CAS.
- M. H. Allen, M. D. Green, H. K. Getaneh, K. M. Miller and T. E. Long, Biomacromolecules, 2011, 12, 2243–2250 CrossRef CAS.
- K. Anderson, A. Sizovs, M. Cortez, C. Waldron, D. M. Haddleton and T. M. Reineke, Biomacromolecules, 2012, 13, 2229–2239 CrossRef CAS.
- U. Lungwitz, M. Breunig, T. Blunk and A. Göpferich, Eur. J. Pharm. Biopharm., 2005, 60, 247–266 CrossRef CAS.
- S. M. Zou, P. Erbacher, J. S. Remy and J. P. Behr, J. Gene Med., 2000, 2, 128–134 CrossRef CAS.
- A. Baker, M. Saltik, H. Lehrmann, I. Killisch, V. Mautner, G. Lamm, G. Christofori and M. Cotten, Gene Ther., 1997, 4, 773–782 CAS.
- H. Huang, H. Yu, G. Tang, Q. Wang and J. Li, Biomaterials, 2010, 31, 1830–1838 CrossRef CAS.
- G. Zhang, J. Liu, Q. Yang, R. Zhuo and X. Jiang, Bioconjugate Chem., 2012, 23, 1290–1299 CrossRef CAS.
- S. Li, Y. Wang, S. Wang, J. Zhang, S. F. Wu, B. L. Wang, W. Zhu and X. Q. Yu, Bioorg. Med. Chem., 2012, 20, 1380–1387 CrossRef CAS.
- J. E. Biaglow, J. Donahue, S. Tuttle, K. Held, C. Chrestensen and J. Mieyal, Anal. Biochem., 2000, 281, 77–86 CrossRef CAS.
- R. Cheng, F. Feng, F. Meng, C. Deng, J. Feijen and Z. Zhong, J. Controlled Release, 2011, 152, 2–12 CrossRef CAS.
- K. Wong, G. Sun, X. Zhang, H. Dai, Y. Liu, C. He and K. W. Leong, Bioconjugate Chem., 2006, 17, 152–158 CrossRef CAS.
- I. A. Sogias, A. C. Williams and V. V. Khutoryanskiy, Biomacromolecules, 2008, 9, 1837–1842 CrossRef CAS.
- D. Filion, M. Lavertu and M. D. Buschmann, Biomacromolecules, 2007, 8, 3224–3234 CrossRef CAS.
- K. Kim, S. Kwon, J. H. Park, H. Chung, S. Y. Jeong, I. C. Kwon and I. S. Kim, Biomacromolecules, 2005, 6, 1154–1158 CrossRef CAS.
- F. Q. Hu, M. D. Zhao, H. Yuan, J. You, Y. Z. Du and S. Zeng, Int. J. Pharm., 2006, 315, 158–166 CrossRef CAS.
- Y. Z. Du, P. Lu, J. P. Zhou, H. Yuan and F. Q. Hu, Int. J. Pharm., 2010, 391, 260–266 CrossRef CAS.
- Y. Nie, M. Günther, Z. Gu and E. Wagner, Biomaterials, 2011, 32, 858–869 CrossRef CAS.
- T. Nomoto, Y. Matsumoto, K. Miyata, M. Oba, S. Fukushima, N. Nishiyama, T. Yamasoba and K. Kataoka, J. Controlled Release, 2011, 151, 104–109 CrossRef CAS.
- K. Kunath, A. von Harpe, H. Petersen, D. Fischer, K. Voigt, T. Kissel and U. Bickel, Pharm. Res., 2002, 19, 810–817 CrossRef CAS.
- S. Tseng, S. Tang, M.-D. Shau, Y. Zeng, J. Cherng and M. Shih, Bioconjugate Chem., 2005, 16, 1375–1381 CrossRef CAS.
- M. Ou, X. L. Wang, R. Xu, C. W. Chang, D. A. Bull and S. W. Kim, Bioconjugate Chem., 2008, 19, 626–633 CrossRef CAS.
- G. Zhang, J. Liu, Q. Yang, R. Zhuo and X. Jiang, Bioconjugate Chem., 2012, 23, 1290–1299 CrossRef CAS.
- H. Sun, B. Guo, R. Cheng, F. Meng, H. Liu and Z. Zhong, Biomaterials, 2009, 30, 6358–6366 CrossRef CAS.
- C. Zhu, M. Zheng, F. Meng, F. M. Mickler, N. Ruthardt, X. Zhu and Z. Zhong, Biomacromolecules, 2012, 13, 769–778 CrossRef CAS.
- W. B. Liechty and N. A. Peppas, Eur. J. Pharm. Biopharm., 2012, 80, 241–246 CrossRef CAS.
- X. L. Wu, J. H. Kim, H. Koo, S. M. Bae, H. Shin, M. S. Kim, B. H. Lee, R. W. Park, I. S. Kim and K. Choi, Bioconjugate Chem., 2010, 21, 208–213 CrossRef CAS.
- H. Farhood, N. Serbina and L. Huang, Biochim. Biophys. Acta, Biomembr., 1995, 1235, 289–295 CrossRef.
- J. Heyes, L. Palmer, K. Bremner and I. MacLachlan, J. Controlled Release, 2005, 107, 276–287 CrossRef CAS.
- N. D. Sonawane, F. C. Szoka, Jr. and A. S. Verkman, J. Biol. Chem., 2003, 278, 44826–44831 CrossRef CAS.
- I. Bacalocostantis, V. P. Mane, M. S. Kang, A. S. Goodley, S. Muro and P. Kofinas, Biomacromolecules, 2012, 13, 1331–1339 CrossRef CAS.
- X. Luo, M. Feng, S. Pan, Y. Wen, W. Zhang and C. Wu, J. Mater. Sci.: Mater. Med., 2012, 23, 1685–1695 CrossRef CAS.
- Y. Tang, Y. B. Li, B. Wang, R. Y. Lin, M. van Dongen, D. M. Zurcher, X. Y. Gu, M. M. Banaszak Holl, G. Liu and R. Qi, Mol. Pharmaceutics, 2012, 9, 1812–1821 CrossRef CAS.
- S. Bauhuber, R. Liebl, L. Tomasetti, R. Rachel, A. Goepferich and M. Breunig, J. Controlled Release, 2012, 162, 446–455 CrossRef CAS.
- S. Mishra, P. Webster and M. E. Davis, Eur. J. Cell Biol., 2004, 83, 97–111 CrossRef CAS.
- Z. Zhong, J. Feijen, M. C. Lok, W. E. Hennink, L. V. Christensen, J. W. Yockman, Y. H. Kim and S. W. Kim, Biomacromolecules, 2005, 6, 3440–3448 CrossRef CAS.
- M. Zheng, Z. Zhong, L. Zhou, F. Meng and R. Peng, Biomacromolecules, 2012, 13, 881–888 CrossRef CAS.
| This journal is © The Royal Society of Chemistry 2013 |
