 Open Access Article
A cyclic peptide inhibitor of C-terminal binding protein dimerization links metabolism with mitotic fidelity in breast cancer cells†
Charles N.
Birts‡
ab,
Sharandip K.
Nijjar‡
ab,
Charlotte A.
Mardle
ab,
Franciane
Hoakwie
a,
Patrick J.
Duriez
b,
Jeremy P.
Blaydes
*bc and
Ali
Tavassoli
*abc
aChemistry, University of Southampton, Southampton, SO17 1BJ, UK. E-mail: a.tavassoli@soton.ac.uk
bCancer Sciences, Faculty of Medicine, University of Southampton, Southampton, SO16 6YD, UK. E-mail: j.p.blaydes@soton.ac.uk
cInstitute for Life Sciences, University of Southampton, UK
First published on 4th June 2013
Abstract
Identification of direct modulators of transcription factor protein–protein interactions is a key challenge for ligand discovery that promises to significantly advance current approaches to cancer therapy. Here, we report an inhibitor of NADH-dependent dimerization of the C-terminal binding protein (CtBP) transcriptional repressor, identified by screening genetically encoded cyclic peptide libraries of up to 64 million members. CtBP dimers form the core of transcription complexes associated with epigenetic regulation of multiple genes that control many characteristics of cancer cells, including proliferation, survival and migration. CtBP monomers also have distinct and critical cellular function, thus current experimental tools that deplete all forms of a targeted protein (e.g. siRNA) do not allow the cellular consequences of this metabolically regulated transcription factor to be deciphered. The most potent inhibitor from our screen (cyclo-SGWTVVRMY) is demonstrated to disrupt CtBP dimerization in vitro and in cells. This compound is used as a chemical tool to establish that the NADH-dependent dimerization of CtBPs regulates the maintenance of mitotic fidelity in cancer cells. Treatment of highly glycolytic breast cancer cell lines with the identified inhibitor significantly reduced their mitotic fidelity, proliferation and colony forming potential, whereas the compound does not affect mitotic fidelity of cells with lower glycolytic flux. This work not only links the altered metabolic state of transformed cells to a key determinant of the tumor cell phenotype, but the uncovered compound also serves as the starting point for the development of potential therapeutic agents that target tumors by disrupting the CtBP chromatin-modifying complex.
Introduction
Molecular control of transcription factor assembly remains a highly desirable, but significantly challenging endeavor that promises significant advances in the approach to cancer therapy.1,2 Transcription factors are considered to be some of the most chemically intractable biological targets, but the possibility of regulating oncogenic signaling pathways at the earliest stages has resulted in ongoing efforts in this area.3–5 Molecules capable of disrupting these key protein–protein interactions would not only form the starting point for the development of therapeutic agents, but also serve as chemical tools that enable unparalleled insight into the role of transcription factors in tumorigenesis and cancer cell biology.Constitutively upregulated aerobic glycolysis, a phenotype known as the Warburg effect, is a key feature of cancer cells;6,7 the resulting changes in intracellular metabolite concentrations further affect metabolic pathways8,9 and lead to altered regulation of critical signaling molecules and transcription factors.7,9,10 Acquired mutations in genes that control the stringency of cell cycle checkpoints also provide an advantage to cancer cells by increasing both the rate of cell division and the degree of genomic instability.6 Evidence from a number of independent studies has recently uncovered bidirectional interplay between the regulators and sensors of glycolytic metabolism and processes that control genome stability and transit through mitosis,9,11–15 potentially linking two key determinants of cancer cells via metabolite sensing transcriptional regulators.
The two vertebrate C-terminal binding proteins (CtBP1 and CtBP2) are highly homologous metabolic sensors with unique and overlapping roles during development.16 The central region of both CtBPs contains a NADH-dependent homo- and hetero-dimerization domain17,18 that promotes dimerization in response to elevated NADH levels. CtBP dimers nucleate the assembly of chromatin modifying complexes (including various histone deacetylases and histone demethylases)19 that are recruited to chromatin through their association with over 30 different DNA-binding transcription factors (via CtBP-binding motifs PXDLS and RRT).20,21 Interestingly, a number of distinct activities have also been specifically attributed to the NADH-unbound forms of CtBPs, including interaction with specific transcriptional regulators,22,23 maintenance of Golgi membrane architecture,24 and transcriptional activation of Wingless pathway targets.25 This latter study in particular clearly demonstrates that deciphering the role of CtBPs in the control of cellular responses to altered glycolytic metabolism is highly dependent on the availability of tools that manipulate the dimerization status of CtBPs in cells.
NADH-dependent CtBP dimerization is thought to cause transcriptional repression of a broad network of genes that respond to the tumor cell phenotype.26,27 As NADH is a key indicator of glycolytic cells,8,28 the CtBP family of proteins may be considered key regulators of the phenotype of highly glycolytic tumor cells.17,26,27 The role of CtBPs as metabolic sensors that control cell survival and migration in response to increased hypoxic and aerobic glycolysis has been demonstrated,29,30 with down-regulation of CtBP-targeted genes distinguishing the aggressive subtype of breast cancer.31 Furthermore, elevated nuclear CtBP levels has recently been shown to correlate to poor survival in breast cancer patients.31
Use of siRNA or dominant negative CtBP fragments have revealed the requirement for interaction of CtBPs with PXDLS motif-containing factors in the nucleus in interphase for normal progression through the subsequent mitosis;32,33 knockdown of CtBPs results in the activation of an extended spindle assembly checkpoint prior to the completion of an aberrant mitosis, and the generation of daughter cells with an abnormal chromosome content.32,33 Aberrant chromosome segregation, caused by failures in the spindle assembly checkpoint, leads to defects in cytokinesis and the generation of aneuploid or polyploid daughter cells, a feature of many cancer cells that facilitates the acquisition of further genetic mutation. Experimental reduction of the stringency of this checkpoint either promotes tumor formation, or where a mitotic defect is so severe as to be incompatible with cell survival, inhibits tumor growth;34 CtBP-depleted cells undergo apoptosis, unless protected by a p53 checkpoint in G1.32
The above studies have not established whether it is the monomeric or NADH-bound dimeric forms of CtBPs that are critical for this process, limiting our fundamental understanding of how the Warburg effect drives tumorigenesis. It is currently not clear whether the conversion of CtBP monomers to dimers (that occurs in highly glycolytic tumour cells) increases mitotic fidelity and hence promotes proliferation, or has the opposing effect on mitosis, thus promoting tumorigenesis though increasing genomic instability. Conventional methods such as gene knockout or siRNA knockdown are not able to address this question as they equally deplete monomeric and dimeric CtBPs, and whilst NADH-binding mutants of CtBPs can be used, it is difficult to ensure that they will be expressed at the correct stoichiometry with their interacting partners to avoid possible dominant negative effects. A molecular modulator of CtBP dimerization would therefore serve as a valuable chemical tool that advances our understanding of how these key processes in cancer biology are linked. In addition to this, pharmacological targeting of CtBPs has long been proposed as a promising approach to disrupting the links between the metabolic and epigenetic networks that are responsible for the malignant reprogramming of cells.26 The only currently known CtBP inhibitor is 2-keto-4-methylthiobutyrate (MTOB),35,36 an intermediate in the methionine salvage pathway that has been shown to reverse the repression of the pro-apoptotic gene BIK in colon cancer cells,36 and to reverse the repression of multiple CtBP-targeted genes in breast cancer cells.31 MTOB acts as a substrate for the pyruvate binding pocket on the catalytic dehydrogenase domain of CtBPs, with high concentrations of MTOB inhibiting the recruitment of CtBPs to target promoters.37 As a consequence of its mode of action, MTOB has to be used at high concentrations to elicit a cellular response (4 mM and 10 mM in the studies cited above).31,36
We therefore set out to identify a molecular modulator of CtBP dimerization using a genetically encoded high-throughput screening platform that rapidly assesses SICLOPPS (split-intein circular ligation of peptides and proteins) cyclic peptide libraries of up to a hundred million members38,39 for inhibitors of a given protein–protein interaction.40,41 The identified compounds would not only enable the role of the NADH-dependent dimerization of CtBP1 and CtBP2 in maintaining mitotic fidelity in rapidly dividing breast cancer cells to be determined, they would serve to further validate the role of CtBPs in driving tumorigenesis, and also form the starting point for the development of potential therapeutic agents that target the epigenetic changes that drive cancer cell phenotypes.
Results
Knockdown of CtBPs increases aberrant mitosis in highly glycolytic cells
We have previously demonstrated that the combined knockdown of both CtBP1 and CtBP2 by siRNA causes aberrant mitosis in MCF-7 cells.32 We conducted further experiments using siRNA targeting CtBP1 or CtBP2 individually and demonstrated that depletion of both proteins is required to cause this phenotype in MCF-7 cells (Fig. 1a, in which we present the accumulation of micronuclei; a cumulative measure of cells that have undergone mitosis with aberrant chromosome segregation). To determine the effect of cellular glycolytic state on the consequences of CtBP loss, we compared micronuclei formation in CtBP-depleted HeLa cells cultured in either 25 mM glucose or 10 mM fructose. This change in sugar source alters the metabolism of HeLa from highly glycolytic (with glucose) to essentially non-glycolytic with a high dependency on glutaminolysis (with fructose).42 We observed comparable levels of micronuclei in CtBP-depleted HeLa cells cultured with 25 mM glucose, as that observed for the highly glycolytic MCF-7 breast cancer cells (Fig. 1b). In contrast, CtBP-depletion in HeLa cells grown in 10 mM fructose did not affect micronuclei formation. These data demonstrate that a switch to glycolytic metabolism renders these cancer cells dependent upon CtBPs for their ability to accurately execute cell division. Given the pre-established literature on the molecular control of CtBP function by glycolysis-derived NADH, we hypothesize that the NADH-dependent dimerization of CtBPs is critical in this process. To enable better testing of this hypothesis, we therefore sought to identify a molecular modulator of the dimerization of both CtBP1 and CtBP2 in cells.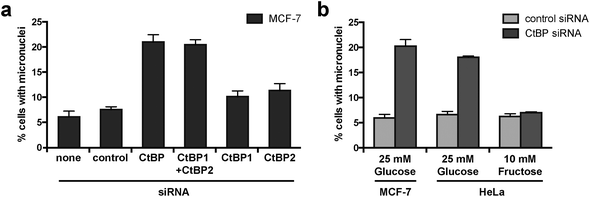 | ||
| Fig. 1 CtBP knockdown increases micronuclei formation in glycolytic cells. (a) The effect of individual and combined knockdown of CtBP1 and CtBP2 on micronuclei formation in MCF-7 cells. CtBP siRNA targeting a common region in both CtBP1 and CtBP2 has been described previously, as have siRNAs targeting individual CtBP1 and CtBP2 mRNAs.32 Effectiveness of siRNA knockdown is shown in Fig. S1.† (b) The effect of upregulated glycolysis on the requirement for CtBPs for the maintenance of mitotic fidelity. Cells cultured in medium containing either glucose or fructose were transfected with the indicated siRNA. | ||
Identification of cyclic peptide inhibitors of CtBP dimerization
We began by constructing a bacterial reverse two-hybrid system (RTHS), to link the survival of a host strain of E. coli on selective media to the disruption of CtBP1 homodimers fused to the bacteriophage 434 repressor. Homodimerization of the CtBP1 fusion protein reconstitutes the 434 repressor, which binds to operator sites incorporated onto the E. coli chromosome, preventing the expression of three downstream reporter genes (Fig. 2a), resulting in cell death on selective media. The repressor complex does not form if the targeted proteins do not interact or in the presence of an inhibitor of the targeted protein–protein interaction, allowing expression of the reporter genes and survival of the host cell on selective media. CtBP1 homodimerization and formation of a functional repressor was confirmed by IPTG-dependent reduction of β-galactosidase activity (Fig. 2b) and inhibition of cell growth by drop spotting onto selective media (Fig. 2c). A CtBP2 RTHS was also constructed and shown to be functional using the same approach (Fig. 2b and c). A control RTHS built using a NADH-binding incompetent mutant of CtBP2 (CtBP2G189A),22 did not show the formation of a functional repressor (Fig. 2b and c), demonstrating that the observed inhibition of cell growth in the CtBP1 and CtBP2 RTHS is due to NADH-dependent homodimerization of the target proteins.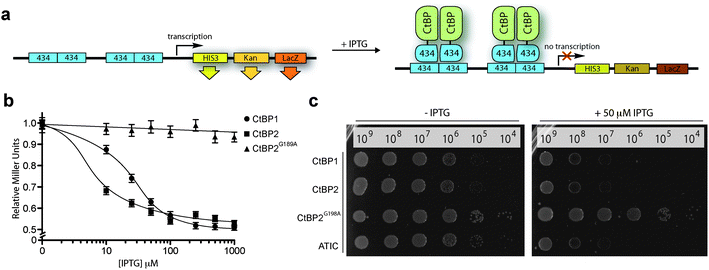 | ||
| Fig. 2 CtBP reverse two-hybrid system. (a) CtBP expression as fusions with the 434 bacteriophage DNA binding protein is induced by IPTG. The CtBP-434 fusion proteins associate to form a functional repressor that prevents expression of the reporter genes HIS3 and KanR, inhibiting growth on selective media. The third reporter gene, LacZ is used to quantify the protein–protein interaction by o-nitrophenyl-β-D-galactoside (ONPG) assays. (b) ONPG assay of the CtBP1, CtBP2 and CtBP2G189A RTHS. (c) Drop-spotting serial dilutions (2.5 μL of ∼10n cells per mL) of the CtBP1, CtBP2, CtBP2G189A, and ATIC (positive control)41 RTHS onto selective media plates with and without IPTG. Data shows formation of a functional repressor in all cases except the dimerization-incompetent CtBP2G189A RTHS. | ||
Three cyclic peptides libraries synthesized in vivo using split intein circular ligation of peptides and proteins (SICLOPPS)38,39 were separately screened for CtBP1 inhibitors using the CtBP1 RTHS: a 1.6 × 10⁵ member SGW+4 (SGWXXXX, X = any amino acid) cyclic heptamer library; a 3.2 × 10⁶ member SGW+5 (SGWXXXXX) cyclic octamer library; and a 6.4 × 10⁷ member SGW+6 (SGWXXXXXX) cyclic nonamer library. The libraries contained an invariable motif of serine (required nucleophile for intein processing), glycine (prevents racemization during chemical synthesis) and tryptophan (functions as a chromophore for HPLC purification). Transformation of the CtBP1 RTHS with SICLOPPS plasmids results in the expression of split-inteins (under control of an arabinose promoter) that process to give the corresponding cyclic peptides. Only plasmids encoding cyclic peptides able to disrupt the homodimerization of CtBP1 enable survival of the host strain on selective media. 104 surviving colonies were picked from selection plates, the SICLOPPS plasmids were isolated from these colonies and transformed back into the CtBP1 RTHS for rescreening; 44 of these plasmids caused the expected phenotypes in the CtBP1 RTHS. Non-specific inhibitors that functioned by targeting components of the RTHS other than the CtBP dimer were identified and excluded using an otherwise identical RTHS monitoring the homodimerization of ATIC (aminoimidazole carboxamide ribonucleotide transformylase/inosine monophosphate cyclohydrolase, a homodimeric enzyme that catalyzes the last two steps of the de novo purine biosynthesis pathway),41 yielding 23 cyclic peptide CtBP1 inhibitors. We probed the isolated CtBP1 inhibitors for the ability to also disrupt CtBP2 homodimerization using the CtBP2 RTHS. 19 of these peptides disrupted both CtBP1 and CtBP2 homodimerization; the SICLOPPS plasmids encoding the three most potent compounds (ranked by drop spotting) were sequenced to reveal their identity (Table 1). Arabinose-promoted production of the most potent cyclic peptide, cyclo-SGWTVVRMY (Fig. 3a), enabled cell survival on minimal media in the CtBP1 or CtBP2 RTHS (Fig. 3b).
| Rank | Name | Target | Peptide sequence |
|---|---|---|---|
| 1 | CP61 | CtBP1/CtBP2 | SGW TVVRMY |
| 2 | CP68 | CtBP1/CtBP2 | SGW PLSTWY |
| 3 | CP65 | CtBP1/CtBP2 | SGW RLIRLY |
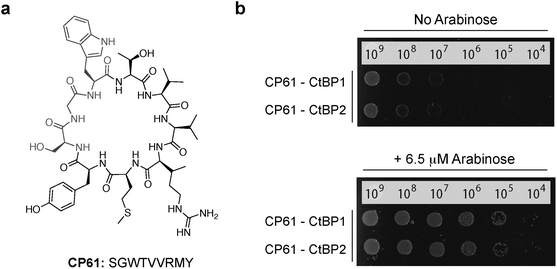 | ||
| Fig. 3 Cyclic peptide CtBP dimerization inhibitors. (a) Structure of CP61. (b) Drop spotting of the CtBP1 or CtBP2 RTHS containing the plasmid encoding CP61 onto selective media with 50 μM IPTG, with and without arabinose (induces expression of SICLOPPS). Restoration of growth with arabinose suggests that CP61 disrupts dimerization of CtBPs. | ||
All three CtBP1/CtBP2 inhibitors were identified from the SGW+6 library, with two (CP61 and CP65) containing a seemingly related pentapeptide region of two aliphatic amino acids (V/L then V/I), followed by an RXY motif, suggesting the same structural feature being targeted by both inhibitors. The most potent inhibitor, CP61 (Fig. 3), was synthesized by solid-phase peptide synthesis and carried forward for validation in vitro.
CP61 inhibits the dimerization of CtBPs in vitro
The ability of CP61 to disrupt the homodimerization of both CtBPs was probed in a series of in vitro experiments using recombinant proteins. We initially used a GST pull down assay to demonstrate that the NADH-dependent association between GST–CtBP1 and His–CtBP1 is disrupted by CP61 (Fig. 4a). To quantify the potency of CP61 an ELISA (enzyme-linked immunosorbent assay) was developed for the NADH-dependent homodimerization of CtBP2. This assays showed that CP61 inhibits the homodimerization of CtBP2 with an IC50 of 19 ± 4 μM (Fig. 4b). This value is comparable to that of previously reported cyclic peptide inhibitors of other protein–protein interactions identified with SICLOPPS.40,41,43 We next used size exclusion chromatography to directly probe the effect of CP61 on the CtBP dimer to monomer equilibrium. In the absence of NADH, a peak corresponding to monomeric CtBP1 was observed that upon the addition of NADH, shifted to a peak corresponding to dimeric CtBP1 in a dose-dependent manner (Fig. 4c). Addition of CP61 to a solution of dimeric CtBP1 (CtBP1 incubated with 10 μM NADH) caused a dose-dependent shift back to the monomeric species (Fig. 4d), further demonstrating disruption of CtBP1 dimerization by CP61.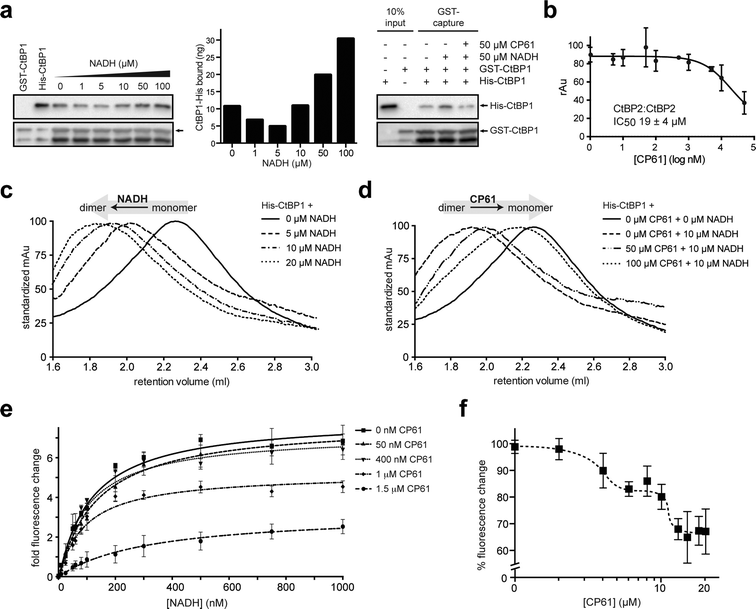 | ||
| Fig. 4 Analysis of the inhibition of CtBP dimerization by CP61 in vitro. (a) Left hand panel shows GST–CtBP1 capturing increasing amounts of His–CtBP1 with increasing concentrations of NADH, as quantified in the middle panel. Right hand panel shows GST–CtBP1 capturing His–CtBP1 in the absence or presence of NADH and CP61, showing disruption of CtBP1 dimerization by CP61. (b) GST–CtBP2 and His–CtBP2 were incubated with CP61 prior to the addition of NADH and quantification of CtBP2 dimer formation by ELISA. Data points are mean ± SD of two independent experiments, each with triplicated wells. (c) Size exclusion chromatography of His–CtBP1 shows transition of monomer to dimer upon addition of increasing concentrations of NADH. (d) Size exclusion chromatography of His–CtBP1 with 10 μM NADH shows dose-dependent disruption of dimer formation by CP61. (e) A FRET-based CtBP1/NADH-binding assay shows a dose dependent reduction in FRET signal (at 425 nm) with increasing CP61, suggesting allosteric inhibition by CP61. Data fitted by nonlinear regression. (f) NADH–CtBP1 interaction by FRET shows the effect of increasing CP61 concentration with NADH fixed at 1 μM. X-axis is plotted on a log scale to demonstrate saturation of binding at higher CP61 concentrations. | ||
We next sought to probe the mechanism of action of CP61 using a previously reported assay that quantifies the binding of NADH to CtBP1, by monitoring the Förster Resonance Energy Transfer (FRET) between a tryptophan in the CtBP NADH binding pocket and NADH (tryptophan excited at 285 nm, NADH emission monitored at 425 nm).17 The observed NADH-dependent increase in the FRET signal was reduced upon addition of CP61, in a dose-dependent manner, demonstrating that CP61 inhibits the CtBP1–NADH interaction. Furthermore, as the maximum FRET signal at saturating NADH concentrations was reduced in a CP61-dependent manner (Fig. 4e), an allosteric mechanism for inhibition of NADH-binding by CP61 may be inferred; CP61 does not bind to the NADH-binding pocket on CtBP1, but indirectly inhibits FRET by disrupting the protein–protein interaction.
The mode of action and binding affinity of CP61 for CtBP1 were further probed by monitoring the loss of FRET caused by titrating increasing concentrations of CP61 into a mixture of dimeric CtBP1 (with NADH fixed at 1 μM). This resulted in a biphasic binding curve, indicating that CP61 binds dimeric CtBP1 with an affinity of 3 μM and 11 μM (Fig. 4f). The differential binding affinity observed suggests that CP61 binds to two forms of CtBP1 molecules; this may be interpreted as indicating differential access of CP61 to its binding sites dependent upon the oligomeric state of the CtBP protein (monomer vs. dimer) and/or its prior binding to NADH (which changes the conformation of CtBPs).
The NADH-binding domain of CtBPs resembles a Rossmann fold that is characteristic of a large number of NADH-dependent dehydrogenases.44 Given that the FRET experiments demonstrated CP61 is able to disrupt NADH-binding to this domain, we considered it important to establish whether CP61 demonstrates selectivity for CtBPs compared to other proteins that contain an NAD+/NADH dependent dehydrogenase domain. Such dehydrogenases may be the most likely source of any potential off-target effects of CP61 in cancer cells. CP61 (at concentrations of up to 100 μM) had no effect on the activity of lactate dehydrogenase (Fig. S2†), demonstrating that its ability to disrupt NADH-Rossmann fold binding is selective for the CtBP dehydrogenase domain.
CP61 disrupts CtBP dimerization in cells
The effect of CP61 on intracellular CtBP dimerization was examined using an assay based on the ability of CtBP heterodimers to direct the subcellular localization of CtBP1.45 CtBP2 has a nuclear localization sequence and is therefore primarily localized in the nucleus when overexpressed in COS-7 cells (Fig. 5a). In contrast, CtBP1 lacks this sequence and has a predominantly cytoplasmic distribution in this assay (Fig. 5b). Co-expression of the two CtBPs results in accumulation of CtBP1 to the nucleus (Fig. 5c) in a dimerization-dependent manner;45 disruption of this protein–protein interaction by CP61 would be expected to reduce the nuclear accumulation of CtBP1. To aid internalization of CP61 into cells, the cell-penetrating sequence of the HIV TAT internalization domain (GRKKRRQRRRPPQ) was attached to CP61 via a disulfide bond, formed by modifying the preset region of the cyclic peptide from SGW to CGW and by adding a cysteine to the N-terminus of TAT. In control cells treated with 100 μM TAT, CFP–CtBP1 showed the expected co-localization with YFP-CtBP2 in the nucleus (Fig. 5d and f), with 13.5% demonstrating quantifiable cytoplasmic CFP–CtBP1 (Fig. 5h). There was a marked reduction in the nuclear co-localization of CtBPs in cells treated with 100 μM CP61–TAT (Fig. 5e and g); whilst YFP–CtBP2 remained almost exclusively nuclear, CFP–CtBP1 was clearly detectable in the cytoplasmic compartment of 71.1% of cells analyzed (Fig. 5h). Importantly, CP61–TAT does not affect the cellular quantity of CtBP1 or CtBP2 (Fig. S1†); this data demonstrates that CP61–TAT disrupts CtBP dimerization in cells.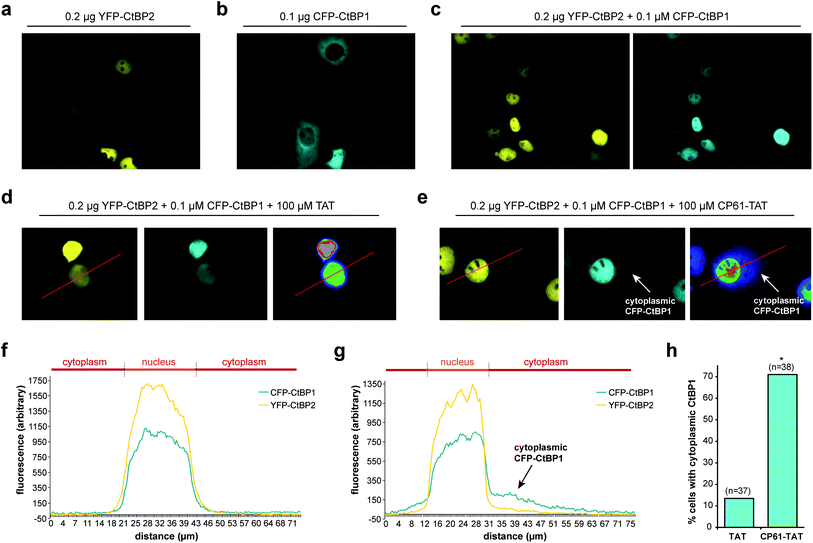 | ||
| Fig. 5 CP61 disrupts CtBP dimerization in cells. (a) Subcellular localization of YFP–CtBP2 in COS-7 transfected with a plasmid encoding YFP–CtBP2. (b) Subcellular localization of CFP–CtBP1 in COS-7 transfected with a plasmid encoding CFP–CtBP1. (c) Subcellular localization of YFP–CtBP2 and CFP–CtBP1 in COS-7 cells transfected with plasmids encoding both proteins. (d and e) Cells transfected as in (c) were pre-treated with 100 μM TAT (d) or 100 μM CP61–TAT (e) to assess the effect of the peptides on inhibiting the CFP–CtBP2-dependent relocalisation of YFP–CtBP1 out of the cytoplasm and into nucleus. Right hand images shows rainbow lookup table applied to CFP image (middle panel) to demonstrate fluorescence intensity. (f and g) Line analysis (along red line) of the YFP and rainbow lookup images in (d) and (e) respectively. Overlapping peaks demonstrate co-localization in the nucleus. Arrows in (e) and (g) show cytoplasmic CFP–CtBP1 due to CP61–TAT-induced loss of its co-localization with YFP–CtBP2 in the nucleus. (h) Results of line analysis of cells treated with 100 μM TAT or 100 μM CP61–TAT, scored for presence of cytoplasmic CFP–CtBP1. Number of cells analyzed in brackets. * = statistical difference from TAT-treated cells (P = 0.0011 Fishers exact contingency table). | ||
CtBP dimerization maintains mitotic fidelity in MCF-7 breast cancer cells
Having demonstrated that CP61 disrupts CtBP dimers in vitro and in cells, we sought to use our inhibitor as a chemical tool to decipher the role of NADH-dependent CtBP dimerization in the maintenance of mitotic fidelity in rapidly dividing breast cancer cells. The accumulation of micronuclei was initially used to measure the effect of CP61–TAT on the mitotic fidelity of MCF-7 cells. As illustrated in (Fig. 6a) micronuclei and evidence of gross mitotic abnormalities were detectable in cells exposed to 50 μM CP61–TAT. A dose–response assay was therefore performed, comparing CP61–TAT to TAT alone (Fig. 6b). Approximately 7% of MCF-7 cells treated with up to 100 μM of TAT contained micronuclei (Fig. 6b). The addition of 10 μM, 50 μM or 100 μM of CP61–TAT resulted in a dose dependent increase in the percentage of cells that contained micronuclei (9.4%, 15.1%, and 17.3% respectively) (Fig. 6b). The effects of CP61–TAT at both 50 μM and 100 μM were significant (P < 0.01) compared to TAT alone, and are comparable to levels previously reported for cells treated with CtBP siRNA (Fig. 1a and ref. 32).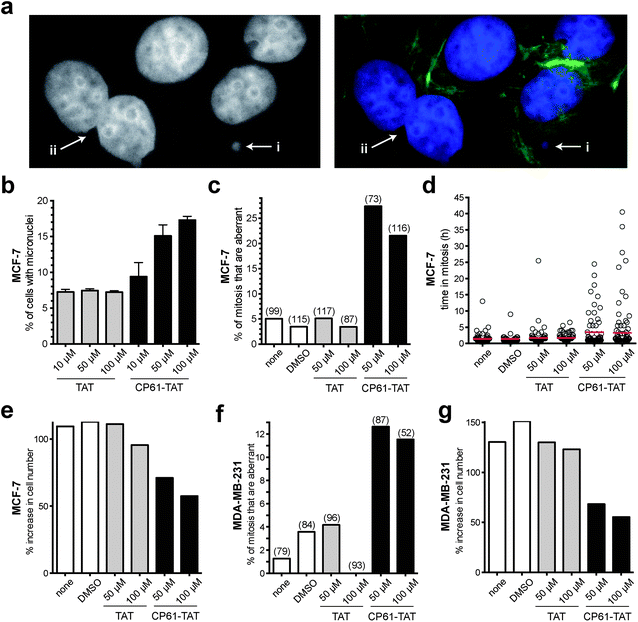 | ||
| Fig. 6 Effect of cell CP61–TAT on mitotic fidelity in breast cancer model cells. (a) Representative images of CP61–TAT-treated MCF-7 cells showing (i) micronuclei and (ii) binucleate cells. Cells in left-hand panel are stained with DAPI (nuclei); cells in right-hand panel are stained with DAPI (nuclei, blue) and FITC (actin fibers, green). (b) MCF-7 cells were incubated with the indicated peptide and fixed for micronuclei analysis after 48 h. >400 cells were scored for each data-point; see Fig. S3† for representative images of cells scored in this assay. (c) MCF-7 cells were treated as indicated and imaged by time-lapse video microscopy for 65 h. The first mitosis of each cell was scored for morphological features of abnormality. Bars indicate the mean values. Number of mitoses scored is shown in parenthesis. The peptides did not substantially reduce the proportion of cells that undergo mitosis (Fig. S4a†). Representative time-lapse sequences are shown in ESI videos 1 and 2.† (d) The length of time in mitosis was scored for cells in (c), red bars show mean time in mitosis. (e) The effect of CP61–TAT compared to TAT alone on the increase in total MCF-7 cell number during the first 48 hours of analysis. (f) MDA-MB-231 cells were treated as indicated and imaged by time-lapse video microscopy for 65 h. The first mitosis of each cell was scored for morphological features of abnormality. The peptides did not substantially reduce the proportion of cells that undergo mitosis (Fig. S4b†). The data is presented as in (c). (g) The effect of CP61–TAT compared to TAT alone on the increase in total MDA-MB-231 cell number during the first 48 hours of analysis. | ||
We next used time-lapse video-microscopy to study the effects of CP61–TAT on the fidelity of MCF-7 mitosis in real-time. Aberrant mitosis phenotypes (including being rounded for extended period of time and/or failed cytokinesis or death) were scored from video images taken over a 65 hour period following treatment with CP61–TAT. The extended activation of the spindle assembly checkpoint in response to aberrant mitosis was also quantified by determining the length of time each individual cell takes to traverse through mitosis. Cells treated with 50 μM CP61–TAT showed a significant increase in the percentage of cells in which mitosis was aberrant from 3.5% (in control treated cells) to 27.5% (P = 0.0002) (Fig. 6c and ESI videos 1 and 2†). The mean time in mitosis of CP61–TAT-treated cells also increased from 1.2 h to 3.5 h (Fig. 6d). These effects correlated with a ∼2-fold reduction of proliferation in MCF-7 cells treated with CP61–TAT (Fig. 6e). In cells treated with 50 μM TAT there was a 111% increase in cell numbers in 48 hours, whereas only a 71% increase was observed in cells treated with 50 μM CP61–TAT. In these experiments the numbers of cells undergoing mitosis was not substantially affected by CP61–TAT (Fig. S4†), indicating that the above observations are not due to non-selective toxicity of CP61–TAT. To demonstrate the cell-line independence of these observations, the above time-lapse microscopy experiments were repeated in the oestrogen receptor negative, and highly metastatic MDA-MB-231 cell line, with comparable results (Fig. 6f and g).
To establish that the above effects of CP61 were independent of potential influence from delivery by TAT, CP61 (untagged) was microinjected into synchronized MCF-7 cells in early S phase, and the fidelity of the subsequent mitosis was determined by time-lapse video-microscopy analysis as before. Compared to control-injected cells, CP61 caused a significant (P < 0.001) increase in the percentage of mitoses that were aberrant from 1.6% to 46.1% (Fig. 7a–c, and ESI videos 3–5†). CP61 also increased the mean length of time each cell spent in mitosis from 1.4 h in control-injected cells to 3 h (Fig. 7a, b and d), consistent with that observed for CP61–TAT.
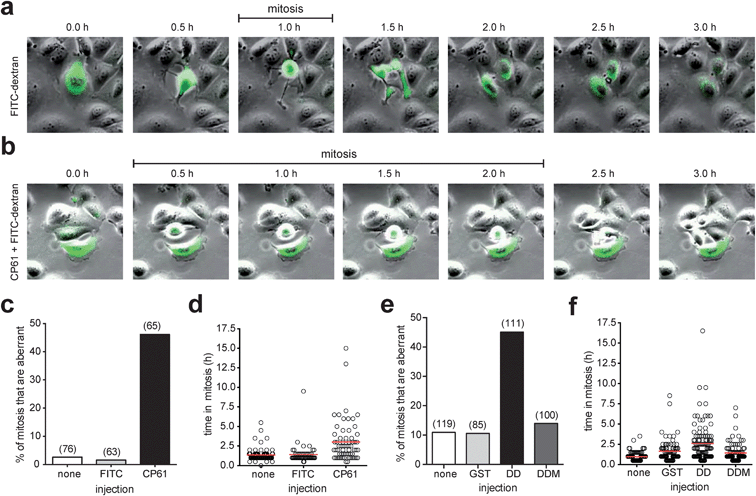 | ||
| Fig. 7 Effect of microinjected CtBP dimerization inhibitors on mitotic fidelity of cell cycle synchronized MCF-7 cells, quantified using time-lapse video microscopy. (a) Montages showing examples of mitoses in MCF-7 cells injected with FITC-dextran (green). (b) Montage of mitosis in MCF-7 cells injected with CP61 + FITC-dextran (green); the cell in the center of the image is undergoing an extended mitosis, as evident from the prolonged period of rounding (0.5 h to 2.0 h frames) compared to control treated cells (panel (a), 1.0 h frame only). Also see ESI videos 3–5.† (c) The percentage of cells in which the first mitosis was phenotypically abnormal was scored for MCF-7 cells injected with FITC-dextran (FITC), CP61 + FITC-dextran (CP61) or non-injected cells (none). Numbers in brackets indicate number of mitoses assessed. (d) Each mitotic cell assessed in (c) was scored for the length of time in mitosis. Red line shows average time in mitosis. (e) The percentage of cells in which the first mitosis was phenotypically abnormal was scored for MCF-7 cells injected with GST–CtBPDD (DD) or the dimerization incompetent GST–CtBPDD(R147L,R169L) analogue (DDM) proteins into MCF-7 cells. Numbers in brackets indicate number of cells assessed. (f) Each mitotic cell in (e) was scored for the length of time in mitosis. Red bars show mean time in mitosis. The above CtBP dimerization inhibitors did not substantially reduce the proportion of cells that undergo mitosis (Fig. S5†). | ||
To confirm that the observed loss of mitotic fidelity is caused by the disruption of CtBPs by CP61, we employed an alternative approach to study the disruption of functional CtBP dimers in cells. We have previously used dominant negative fragments of CtBP2 to assess the protein interactions involved in the CtBP-dependent regulation of mitotic fidelity.33 Here, we used a construct encoding the central dimerization domain (110–359) of CtBP2 (GST–CtBPDD) that is designed to bind endogenous CtBP monomers, and thus prevent the formation of functional CtBP dimers. A plasmid encoding a dimerization-incompetent (R147L, R169L)46 variant of this (GST–CtBPDDM) was used as a control. An aberrant mitosis phenotype was observed in 45% of cells injected with GST–CtBPDD, whereas ≤14% of cell injected with GST alone, or CtBPDDM showed this phenotype (Fig. 7e). GST–CtBPDD also increased the time in mitosis, in line with that observed in CP61-treated cells, whereas the dimerization-incompetent mutant had no effect (Fig. 7f).
CP61 does not affect mitotic fidelity of less glycolytic MDA-MB-453 breast cancer cells
As we demonstrated in Fig. 1a using manipulation of the culture medium of HeLa cells, dependency on CtBPs for the execution of accurate mitosis is a feature of cells with high glycolytic flux, whereas in cells with low glycolytic flux mitotic fidelity is insensitive to CtBP loss. As this not only demonstrates a hitherto unrecognised link between glycolysis and the molecular control of mitosis, but also has important implications as to the ultimate use of CtBP dimerisation inhibitors for the therapy of highly glycolytic tumours, we sought to determine whether the effects of CP61–TAT on mitosis are similarly dependent on glycolysis. In order to use an alternative model system to HeLa cells cultured in fructose, we compared breast cancer cell lines with well characterised differences in their rates of glycolysis.47 In analogous experiments to those in Fig. 7, the effect of CP61 on the mitotic fidelity of the highly glycolytic MCF-7 cell line, was compared with its effect on MDA-MB-453, which demonstrate constitutively low rates of glycolysis, even when cultured in high glucose, and instead rely heavily on glutamine oxidation.47 Cells were assessed by microinjection and time-lapse video-microscopy. In MCF-7, compared to control-injected cells, CP61 again caused a significant (P < 0.0001) increase in the percentage of mitoses that were aberrant from 10.2% to 50.8% (Fig. 8a). The mean length of time each cell spent in mitosis also increased from 1.9 h in control-injected cells to 4 h after CP61 injection (Fig. 8b), consistent with earlier observations (Fig. 7c and d). In contrast, when injected into MDA-MB-453 cells CP61 did not significantly affect the percentage of mitoses that were aberrant (P > 0.05) compared to control-injected cells (Fig. 8a). CP61 also did not affect the length of time MDA-MB-453 cells spent in mitosis (Fig. 8b). These findings support our hypothesis that the disruption of CtBP dimerization by CP61 will only affect mitotic fidelity in highly glycolytic cells. Additionally, this data provides further evidence that the cellular effects of CP61 are due to its on-target effects on CtBPs, as the deleterious effects of both CtBP knockdown and CP61 on mitotic fidelity are both selectively associated with a high rate of glycolytic flux.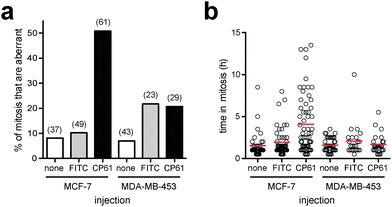 | ||
| Fig. 8 Comparing the effect of CP61 on the mitotic fidelity of MCF-7 and MDA-MB-453 cells. (a) The percentage of cells in which the first mitosis was phenotypically abnormal was scored for MCF-7 and MDA-MB-453 cells injected with FITC-dextran (FITC), CP61 + FITC-dextran (CP61) or non-injected cells (none). Numbers in brackets indicate number of mitoses assessed. (b) Each mitotic cell assessed in (a) was scored for the length of time in mitosis. Red bars show mean time in mitosis. | ||
Colony forming potential of breast cancer-derived cells is suppressed by CP61
Results from our time-lapse experiments (Fig. 6e and g) demonstrated the ability of CP61–TAT to suppress the proliferation of cancer cell lines in short term assays. To determine whether this represented a transient arrest, from which the cells could later recover, or a long-term loss of proliferative potential through the induction of cell death or senescence, colony forming assays were performed. MCF-7 cells were treated with 50 μM CP61–TAT for 48 hours, plated, and incubated for 10 days to assess their colony forming potential. Compared to cells treated with either carrier alone or 50 μM TAT, exposure to 50 μM CP61–TAT for 48 h resulted in a significant (P < 0.05) ∼3-fold reduction in the number of colonies formed (Fig. 9), demonstrating the anti-proliferative potential of CP61.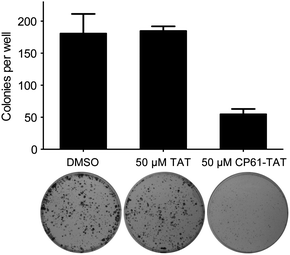 | ||
| Fig. 9 Inhibition of CtBP dimerisation inhibits clonogenic survival of MCF-7 cancer cells. Cells were treated for 48 h with 50 μM CP61–TAT, 50 μM TAT or DMSO carrier control, and re-plated for 10 day colony forming assays. Bars show mean ± SEM for triplicate wells from a representative of three independent experiments. | ||
Together, our findings demonstrate that the dimeric form of CtBPs is required for maintenance of normal mitotic fidelity in rapidly dividing breast cancer cells, suggesting that cellular glycolytic state is linked to mitotic cell cycle checkpoint control through the regulation and detection of extra-mitochondrial free NADH concentrations by CtBPs. Loss of this important regulatory function of CtBPs results in the long term loss of proliferative potential in glycolytic cancer cells.
Discussion
The challenge of identifying protein–protein interaction inhibitors is significant, with peptides and macromolecules increasingly being viewed as the optimal scaffolds for this purpose.4 We employed a genetically encoded high-throughput screening platform to identify CP61, a cyclic peptide that binds CtBP1 with 3 μM affinity and disrupts CtBP heterodimerization and homodimerization with 19 μM IC50in vitro, and inhibits the cellular function of CtBPs at 50 μM in cells. That the top 3 most potent inhibitors identified were from the nonapeptide library warrants further discussion. Our previous experience with cyclic peptide protein–protein interaction inhibitors suggests that a dipeptide or tripeptide motif is critical for inhibition, with the rest of the cyclic peptide acting as a backbone that presents the active motif to its target.48 As the active motif of CP61 would also have been present in the random regions of the octapeptide and heptapeptide libraries, one may either conclude that the whole of CP61 is required for its activity, or ring size and the subsequent conformation of the active motif plays a significant role in the activity of cyclic peptide inhibitors. If correct, the latter suggests that various sizes of macrocycles should be included in libraries screened against protein–protein interactions. We are currently conducting alanine scanning on CP61 to identify its active motif.CP61 is one of a handful of compounds that regulates cellular function by inhibiting the protein–protein interaction of a transcription factor,2–4 and was used as a chemical tool to demonstrate that CtBP dimerization links cellular metabolism with mitotic regulation. Classic mediators of cell cycle progression such as APC/C and MYC, control the rate of glycolysis through the regulation of transcriptional networks and protein degradation pathways.11,49 High rates of glycolysis are therefore matched to S phase of the cell cycle, when demand for macromolecule synthesis is at its greatest;49 thus the NAD+/NADH ratio is demonstrably reduced in S phase cells.50 Given that glycolysis is an important requirement for cell replication, and the well characterized role of cell cycle checkpoints in restricting cell cycle progression in response to a wide range of adverse signals (including metabolic stress), it can be speculated that cells possess a mechanism that links a deficiency in glycolysis in S phase to the activation of subsequent cell cycle checkpoints. Loss of CtBPs results in activation of the spindle assemble checkpoint, though this activation is ultimately futile and mitosis occurs with improper DNA segregation.32,33 Combining this information (from previous reports) with the data from this study, one can conclude that CtBPs act in interphase to sense levels of glycolytic flux and license key aspects of the subsequent mitosis. In other words, normal DNA segregation is regulated by a sensor of metabolic stress in the prior phases of the cell cycle. Whilst the precise mechanism for this link between CtBPs and mitotic fidelity remains to be fully explored, this is an important new insight into the links between metabolism and cell cycle control, and expands upon current precedents linking normal energy and redox balance with the fidelity of mitotic progression.9,11–15
In addition to providing insight into fundamental processes of cell cycle control, CP61 further demonstrates the potential of CtBPs as targets for the development of anti-cancer therapeutics that target the epigenetic changes associated with cancer.31,36
Methods
Construction of CtBP RTHS and SICLOPPS screening
All CtBP RTHS were constructed as previously described for the ATIC RTHS.41 SICLOPPS libraries were constructed as described in39 and screened as detailed in supplementary methods. The activity of the SICLOPPS plasmids encoding the CtBP1/2 dimerisation inhibitors were ranked by drop spotting, and the identity of the variable insert regions (encoding the cyclic peptide) was revealed by DNA sequencing.Peptide synthesis
Linear peptides were synthesized using a Liberty One peptides synthesizer (CEM Corp.) and were cyclized, TAT-tagged, and characterized as detailed in supplementary methods.Proteins production
Plasmids for the expression of N-terminally GST-tagged CtBP1 and CtBP2 have been described previously.22 PET28a-based vectors were generated for the expression of CtBP1 and CtBP2 with an N-terminal 6XHis-tag. CtBPs were expressed in E. coli and purified using glutathione and nickel affinity chromatography respectively. Whilst bound to the affinity matrix, CtBPs were incubated for 30 min with 0.25 mM sodium pyruvate, to promote the oxidation of bound NADH.17Size exclusion chromatography
Size exclusion chromatography was conducted using a Superdex 200 5/150 GL (GE Healthcare) pre-equilibrated with PBS. His–CtBP1 (36 μL of a 1.3 mg mL−1 solution in PBS) was incubated with CP61 for 5 minutes prior to the addition of NADH and loading onto the column.GST pull down assays and ELISA
GST pull down assays were conducted in 75 μL of pull-down buffer (50 mM Tris–HCl pH 7.2, 150 mM NaCl, 5 mM EDTA pH 8.0, 1% IGEPAL CA-630, 10% glycerol, 5 mM DTT, protease inhibitor mix) with 10 mg mL−1 bacterial cell lysate for blocking non-specific interactions. For ELISA, GST, GST–CtBP1 or GST–CtBP2 was bound to glutathione-coated 96 well plates (Thermo Scientific) (100 ng per well in 100 μL TBS-T [50 mM Tris–HCl, 150 mM NaCl, 0.05% Tween-20, pH 7.4]) for 1 h. After blocking with 3% bovine serum albumin (BSA) (in 200 μL TBS), His–CtBP1 or His–CtBP2 (600 ng per 1% BSA per 100 μL TBS) and cyclic peptide were added and incubated for 30 min prior to addition of NADH (to 0.5 mM) and incubated for 1 h. Detection was with mouse anti-His Ab (Sigma) followed by sheep anti-mouse-HRP (Sigma) (both in 1% BSA/TBS-T) and SuperSignal chemiluminescent substrate (Thermo Scientific), using a Varioskan Flash reader (Thermo Scientific).FRET assays
FRET assays were conducted in Greiner black 96-well half-area plates, and were measured at room temperature using a Tecan Infinite M200 Pro micro-plate reader (excitation wavelength 285 nm, emission wavelength 425 nm). Assays were conducted with 300 nM His–CtBP1 in a total volume of 50 μL. Gain setting and z-position for the instrument were 178 and 18![[thin space (1/6-em)]](https://www.rsc.org/images/entities/char_2009.gif) 278 μm for assay in Fig. 4e, and 149 and 17
278 μm for assay in Fig. 4e, and 149 and 17![[thin space (1/6-em)]](https://www.rsc.org/images/entities/char_2009.gif) 963 μm for the CP61 binding assays (Fig. 4f).
963 μm for the CP61 binding assays (Fig. 4f).
CtBP cellular compartmentalization assay
Expression vectors for CFP–CtBP1 and YFP–CtBP2 were constructed (based on pSCFP3A and pSYFP2 plasmids respectively), and transfected into COS-7 cells. Expression and co-localization of fluorescent proteins was determined using an Olympus IX81 microscope with xcellence pro software. Statistical comparisons were performed using Fisher's exact analysis of contingency tables (GraphPad Prism).Aberrant mitosis assays
siRNA transfection, micronuclei counting, time lapse video microscopy and microinjections were performed as previously described,32,33 except that times lapse images were captured every 30 min. Data from micronuclei assays is presented as mean ± SEM from triplicate wells from a representative of at least two independent experiments, statistical analysis was by ANOVA one way parametric test and Tukey's post hoc test. For microinjection, cells were synchronized in medium containing 0.1% fetal calf serum for 48 h, prior to release by increasing the serum concentration to 10%. Cells were microinjected 20 h post release with FITC-dextran (70 kDa, 1 μg μL−1) plus cyclic peptide or GST–CtBP fusion protein in PBS. Peptides were injected at 50 μM; GST, GST–CtBPDD and GST–CtBPDDM proteins at 1 μg μL−1 in PBS. Cell penetrating peptides were added to the medium of asynchronous cell cultures. All cell-based experiments were repeated at least twice; data from a representative experiment being shown. Statistical comparisons of cell count data were performed using Fisher's exact analysis of contingency tables (GraphPad Prism).Colony forming assays
Cells were plated at 2500 cells per well in 96 wells plates and incubated with 50 μM TAT, CP61–TAT, or DMSO alone for 48 h prior to re-plating of 10% of the cells into a well of a 6 well plate. 10 days later cells were fixed, stained with Giemsa (Sigma Aldrich), and colonies counted. Data is presented as mean ± SEM from triplicate wells from a representative of three independent experiments, statistical analysis was by two tailed, paired Students t-test.Acknowledgements
The authors are grateful to Matthew Darley for generating plasmid reagents, and the Southampton Faculty of Medicine Bioimaging Unit for assistance with live cell imaging. We thank Dr Bruno Linclau and Dr Josephine Corsi for helpful discussions. This work was funded by Cancer Research UK (Career Establishment Award A10263 to A.T.), Breast Cancer Campaign (Project Grant 2010NovPR12 to J.P.B.), Biotechnology and Biological Sciences Research Council (studentship for S.K.N. to A.T.), and the University of Southampton Life Science Interface Forum.References
- J. E. Darnell, Jr, Nat. Rev. Cancer, 2002, 2, 740 CrossRef.
- R. E. Moellering, M. Cornejo, T. N. Davis, C. Del Bianco, J. C. Aster, S. C. Blacklow, A. L. Kung, D. G. Gilliland, G. L. Verdine and J. E. Bradner, Nature, 2009, 462, 182 CrossRef CAS.
- T. Berg, Curr. Opin. Chem. Biol., 2008, 12, 464 CrossRef CAS.
- A. Mullard, Nat. Rev. Drug Discovery, 2012, 11, 173 CrossRef CAS.
- J. A. Wells and C. L. McClendon, Nature, 2007, 450, 1001 CrossRef CAS.
- D. Hanahan and R. A. Weinberg, Cell, 2011, 144, 646 CrossRef CAS.
- S. J. Yeung, J. Pan and M. H. Lee, Cell. Mol. Life Sci., 2008, 65, 3981 CrossRef CAS.
- M. G. Vander Heiden, L. C. Cantley and C. B. Thompson, Science, 2009, 324, 1029 CrossRef CAS.
- M. R. Buchakjian and S. Kornbluth, Nat. Rev. Mol. Cell Biol., 2010, 11, 715 CrossRef CAS.
- A. G. Ladurner, Mol. Cell, 2006, 24, 1 CrossRef CAS.
- A. Almeida, J. P. Bolanos and S. Moncada, Proc. Natl. Acad. Sci. U. S. A., 2010, 107, 738 CrossRef CAS.
- H. S. Kim, A. Vassilopoulos, R. H. Wang, T. Lahusen, Z. Xiao, X. Xu, C. Li, T. D. Veenstra, B. Li, H. Yu, J. Ji, X. W. Wang, S. H. Park, Y. I. Cha, D. Gius and C. X. Deng, Cancer Cell, 2011, 20, 487 CrossRef CAS.
- D. Nakada, T. L. Saunders and S. J. Morrison, Nature, 2010, 468, 653 CrossRef CAS.
- A. Vazquez-Martin, C. Oliveras-Ferraros, E. Lopez-Bonet and J. A. Menendez, Cell Cycle, 2009, 8, 3679 CrossRef CAS.
- R. H. Wang, K. Sengupta, C. Li, H. S. Kim, L. Cao, C. Xiao, S. Kim, X. Xu, Y. Zheng, B. Chilton, R. Jia, Z. M. Zheng, E. Appella, X. W. Wang, T. Ried and C. X. Deng, Cancer Cell, 2008, 14, 312 CrossRef CAS.
- J. D. Hildebrand and P. Soriano, Mol. Cell. Biol., 2002, 22, 5296 CrossRef CAS.
- C. C. Fjeld, W. T. Birdsong and R. H. Goodman, Proc. Natl. Acad. Sci. U. S. A., 2003, 100, 9202 CrossRef CAS.
- M. Nardini, S. Spano, C. Cericola, A. Pesce, A. Massaro, E. Millo, A. Luini, D. Corda and M. Bolognesi, EMBO J., 2003, 22, 3122 CrossRef CAS.
- Y. Shi, J. Sawada, G. Sui, B. Affar el, J. R. Whetstine, F. Lan, H. Ogawa, M. P. Luke and Y. Nakatani, Nature, 2003, 422, 735 CrossRef CAS.
- G. Chinnadurai, Mol. Cell, 2002, 9, 213 CrossRef CAS.
- K. G. Quinlan, M. Nardini, A. Verger, P. Francescato, P. Yaswen, D. Corda, M. Bolognesi and M. Crossley, Mol. Cell. Biol., 2006, 26, 8159 CrossRef CAS.
- A. H. Mirnezami, S. J. Campbell, M. Darley, J. N. Primrose, P. W. Johnson and J. P. Blaydes, Curr. Biol., 2003, 13, 1234 CrossRef CAS.
- J. H. Kim, E. J. Cho, S. T. Kim and H. D. Youn, Nat. Struct. Mol. Biol., 2005, 12, 423 CAS.
- D. Corda, A. Colanzi and A. Luini, Trends Cell Biol., 2006, 16, 167 CrossRef CAS.
- C. Bhambhani, J. L. Chang, D. L. Akey and K. M. Cadigan, EMBO J., 2011, 30, 2031 CrossRef CAS.
- G. Chinnadurai, Cancer Res., 2009, 69, 731 CrossRef CAS.
- L. M. Bergman and J. P. Blaydes, Apoptosis, 2006, 11, 879 CrossRef CAS.
- A. Chiarugi, C. Dolle, R. Felici and M. Ziegler, Nat. Rev. Cancer, 2012, 12, 741 CrossRef CAS.
- J. H. Kim and H. D. Youn, Cell Death Differ., 2009, 16, 584 CrossRef CAS.
- Q. Zhang, S. Y. Wang, A. C. Nottke, J. V. Rocheleau, D. W. Piston and R. H. Goodman, Proc. Natl. Acad. Sci. U. S. A., 2006, 103, 9029 CrossRef CAS.
- L. J. Di, J. S. Byun, M. M. Wong, C. Wakano, T. Taylor, S. Bilke, S. Baek, K. Hunter, H. Yang, M. Lee, C. Zvosec, G. Khramtsova, F. Cheng, C. M. Perou, C. Ryan Miller, R. Raab, O. I. Olopade and K. Gardner, Nat. Commun., 2013, 4, 1449 CrossRef.
- L. M. Bergman, C. N. Birts, M. Darley, B. Gabrielli and J. P. Blaydes, Mol. Cell. Biol., 2009, 29, 4539 CrossRef CAS.
- C. N. Birts, L. M. Bergman and J. P. Blaydes, Oncogene, 2011, 30, 1272 CrossRef CAS.
- A. J. Holland and D. W. Cleveland, Nat. Rev. Mol. Cell Biol., 2009, 10, 478 CrossRef CAS.
- Y. Achouri, G. Noel and E. Van Schaftingen, Biochem. Biophys. Res. Commun., 2007, 352, 903 CrossRef CAS.
- M. W. Straza, S. Paliwal, R. C. Kovi, B. Rajeshkumar, P. Trenh, D. Parker, G. F. Whalen, S. Lyle, C. A. Schiffer and S. R. Grossman, Cell Cycle, 2010, 9, 3740 CrossRef CAS.
- L. Z. Zhao and G. Chinnadurai, Cell Cycle, 2010, 9, 3642 CrossRef.
- C. P. Scott, E. Abel-Santos, M. Wall, D. C. Wahnon and S. J. Benkovic, Proc. Natl. Acad. Sci. U. S. A., 1999, 96, 13638 CrossRef CAS.
- A. Tavassoli and S. J. Benkovic, Nat. Protoc., 2007, 2, 1126 CrossRef CAS.
- A. R. Horswill, S. N. Savinov and S. J. Benkovic, Proc. Natl. Acad. Sci. U. S. A., 2004, 101, 15591 CrossRef CAS.
- A. Tavassoli and S. J. Benkovic, Angew. Chem., Int. Ed., 2005, 44, 2760 CrossRef CAS.
- L. J. Reitzer, B. M. Wice and D. Kennell, J. Biol. Chem., 1979, 254, 2669 CAS.
- A. Tavassoli, Q. Lu, J. Gam, H. Pan, S. J. Benkovic and S. N. Cohen, ACS Chem. Biol., 2008, 3, 757 CrossRef CAS.
- V. Kumar, J. E. Carlson, K. A. Ohgi, T. A. Edwards, D. W. Rose, C. R. Escalante, M. G. Rosenfeld and A. K. Aggarwal, Mol. Cell, 2002, 10, 857 CrossRef CAS.
- L. M. Bergman, L. Morris, M. Darley, A. H. Mirnezami, S. C. Gunatilake and J. P. Blaydes, BMC Cell Biol., 2006, 7, 35 CrossRef.
- L. J. Zhao, M. Kuppuswamy, S. Vijayalingam and G. Chinnadurai, BMC Mol. Biol., 2009, 10, 89 CrossRef.
- S. Mazurek, A. Michel and E. Eigenbrodt, J. Biol. Chem., 1997, 272, 4941 CrossRef CAS.
- I. B. Spurr, C. N. Birts, F. Cuda, S. J. Benkovic, J. P. Blaydes and A. Tavassoli, ChemBioChem, 2012, 13, 1628 CrossRef CAS.
- S. Y. Lunt and M. G. Vander Heiden, Annu. Rev. Cell Dev. Biol., 2011, 27, 441 CrossRef CAS.
- L. Zheng, R. G. Roeder and Y. Luo, Cell, 2003, 114, 255 CrossRef CAS.
Footnotes |
| † Electronic supplementary information (ESI) available. See DOI: 10.1039/c3sc50481f |
| ‡ These authors contributed equally to this work. |
| This journal is © The Royal Society of Chemistry 2013 |
