Rapid growth of large, defect-free colloidal crystals
K. E.
Jensen
*a,
D.
Pennachio
b,
D.
Recht
b,
D. A.
Weitz
ab and
F.
Spaepen
*b
aDepartment of Physics, Harvard University, Cambridge, MA 02138, USA. E-mail: jensen@physics.harvard.edu
bSchool of Engineering and Applied Sciences, Harvard University, Cambridge, MA 02138, USA. E-mail: spaepen@seas.harvard.edu
First published on 19th October 2012
Abstract
We demonstrate controlled growth of face-centered cubic (FCC), monodisperse hard-sphere colloidal crystals by centrifugation at up to 3000g onto FCC (100) templates. Such rapid deposition rates often result in an amorphous sediment. Surprisingly, however, growth onto (100) templates results only in single crystals with few or no extended defects. By contrast, deposition onto flat, (111), or (110) templates causes rapid disordering to an amorphous sediment if the dimensionless flux (particle volume fraction × Peclet number) exceeds a critical value. This crystalline-to-amorphous crossover results from the degeneracy of possible stacking positions for these orientations. No such degeneracy exists for growth onto (100). After growth, extended defects can nucleate and grow only if the crystal exceeds a critical thickness that depends on the lattice misfit with the template spacing. The experimental observations of the density of misfit dislocations are accounted for by the Frank–van der Merwe theory, adapted for the depth-dependent variation of lattice spacing and elastic constants that results from the gravitational pressure.
1 Introduction
Colloidal particles provide convenient and useful building blocks for creating ordered structures with length scales on the order of a micrometer. Perfect crystals of colloidal particles are useful as optical-wavelength photonic materials,1 frameworks for hierarchical materials,2,3 templates for inverse-opal structures,4 and experimental models for exploring the static and dynamic properties of atomic crystals.5,6 A quick, convenient method for growing large, perfect crystals is therefore desirable. Common growth methods require very slow growth rates to avoid formation of an amorphous sediment and often produce structures with a high number of defects.7–13 Some of the difficulty can be overcome by using a template, a patterned substrate that directs the initial crystal growth. Templates can be used both in convective assembly, which has produced crystals quickly but of limited thickness,8 and in sedimentation, which can produce large crystals but only at slow growth rates to avoid defects and amorphization.12–15 A technique to grow large, defect-free colloidal single crystals quickly is essential for their further development as useful materials.Here, we demonstrate rapid growth of large, hard-sphere, face-centered cubic (FCC) colloidal single crystals by centrifugation up to 3000g onto an FCC (100) template. We never observe an amorphous sediment for this growth orientation, even at 3000g where the crystal grows at ∼10 μm s−1. By contrast, high-flux deposition onto other substrates results in a crossover to an amorphous sediment due to stacking degeneracy. On the (100) template, the single crystals can be grown defect-free; following growth, however, extended defects can develop depending on the total crystal thickness and the template lattice spacing. We show that the formation of these defects can be understood by the classical Frank–van der Merwe theory,16 adapted using the equation of state of the hard-sphere colloids to account for the pressure-induced variation of lattice spacing and elastic constants with depth. Our results provide a scalable technique for rapidly producing arbitrarily large colloidal crystals free from extended defects and suggest a mechanism for creating other colloidal structures that can be described by deterministic layering.
2 Experimental
We use 1.55 μm diameter colloidal silica particles with a polydispersity <3.5% (ref. 17) in a mixture of dimethyl sulfoxide (DMSO, 62.8% by volume), deionized water (36.0% by volume), and fluorescein–NaOH dye solution (1.2% by volume). The dye solution is 3% by weight fluorescein–NaOH in water, which enables fluorescent imaging of the sample as well as reduces the Debye screening length to less than 10 nm. The fluid phase matches the index of refraction of the particles and has a viscosity η = 1.6 mPa s. The particles interact as hard spheres. We checked for possible charge effects that could cause deviations from hard-sphere behavior by comparing crystals of the same height sedimented using our standard colloid mixture and using one with 10 mM NaCl added, and found no difference in the interparticle spacings. The raw particle stock contains a small population of ∼800 nm diameter particles, which we remove prior to preparing the index-matched colloid.Initially, the colloidal suspension has a uniform particle volume fraction, ϕ0. Over time, the particles sediment due to their difference in density with the fluid phase, Δρ = 0.94 g cm−3. In our experiments, we grow dense colloidal structures by sedimentation either under gravity or in a centrifuge and subsequently observe the resulting structure in a confocal microscope. Under gravity, the sedimentation velocity is us = 0.75 μm s−1 = 2.7 mm h−1. Under centrifugation, this velocity increases linearly with the centrifugal acceleration, since even at 3000g the Reynolds number remains low. The Peclet number, which is the ratio of the rate of sedimentation to that of diffusion, is given by Pe = Δρgs![[R with combining macron]](https://www.rsc.org/images/entities/i_char_0052_0304.gif) 4/(kBT), where gs is the acceleration during sedimentation,
4/(kBT), where gs is the acceleration during sedimentation, ![[R with combining macron]](https://www.rsc.org/images/entities/i_char_0052_0304.gif) is the mean particle radius, and kBT is the thermal energy. At gs = 1g and room temperature, Pe = 0.83, so that the rates of sedimentation and diffusion are similar. We test the effects of deposition flux on crystal formation by varying gs from 25g to 3000g for ϕ0 = 0.29% and by varying ϕ0 up to 3% for sedimentation at 1g. In all cases, sedimentation is complete prior to imaging.
is the mean particle radius, and kBT is the thermal energy. At gs = 1g and room temperature, Pe = 0.83, so that the rates of sedimentation and diffusion are similar. We test the effects of deposition flux on crystal formation by varying gs from 25g to 3000g for ϕ0 = 0.29% and by varying ϕ0 up to 3% for sedimentation at 1g. In all cases, sedimentation is complete prior to imaging.
The sample cell consists of a metal tube ∼1 cm in diameter, glued onto a 0.17 mm thick glass coverslip. To make crystal templates in the coverslips, we use photolithography to mask the desired pattern and reactive ion etch directly into the bare glass. The resulting template is an array of cylindrical holes approximately 500 nm in depth, with a diameter slightly less than that of the colloidal particles. We fabricate templates to match the three densest crystal planes of the FCC lattice:18 (111), (100), and (110), shown in Fig. 1. The (100) and (110) crystal planes have, respectively, 13% and 39% lower in-plane density than (111). For all templates the nearest neighbor distance is 1.63 μm.5 Consequently, all templates produce FCC crystals that differ only in orientation. Because for hard spheres the B and C stacking positions are energetically degenerate on the A-layer of the (111) plane, growth on such templates usually does not produce a pure FCC crystal, but rather a random hexagonal close-packed (RHCP) sequence of A, B, and C stacking positions. Each patterned template measures a few millimeters on each side, and is surrounded in the sample cell by flat, unetched glass. The entire sample cell can be spun in an Eppendorf Centrifuge 5702 RH, which produces a maximum centrifugal acceleration of gs = 3000g.
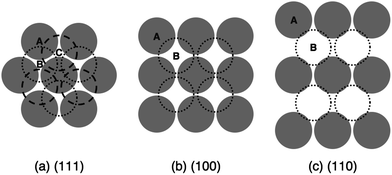 | ||
| Fig. 1 Schematic of stacking sequences for (a) (111), (b) (100), and (c) (110) planes in an FCC crystal. The circles show the particle size to scale in relation to the template lattice parameter. In the (111) orientation, the B and C stacking positions are degenerate on the A-layer. All of these templates generate FCC crystals that differ only in orientation. | ||
After deposition, all samples are imaged from below in three dimensions using a Leica SP5 point-scanning confocal microscope. Because the fluorescein–NaOH dye is in the fluid phase, the particles appear dark against a bright background. All image stacks are taken far from the edges of the template and from the sample cell walls to avoid possible boundary effects. We locate the particle centers in three dimensions using standard particle location software.19
3 Results
Using a (100) crystal template, we obtain FCC single crystals all the way to the top of the sediment for all gs and ϕ0. The crystals are grown 13–70 μm thick, limited only by the total number of particles placed in the sample cell. By increasing ϕ0 we grow taller crystals, our tallest to date being 100 μm thick, grown at 100g from ϕ0 = 0.44%. Surprisingly, we never observe an amorphous sediment above the (100) template, even at 3000g when the crystal grows at ∼10 μm s−1. A horizontal confocal image slice through the 18th layer of particles in a perfect FCC crystal grown at 3000g on a (100) template is shown in Fig. 2.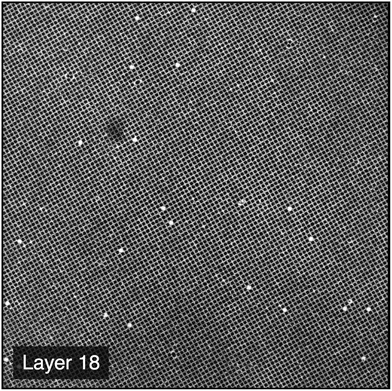 | ||
| Fig. 2 Horizontal confocal image of Layer 18 of a perfect FCC colloidal crystal grown by centrifugation onto a (100) template at 3000g with initial volume fraction ϕ0 = 0.29%. The image has lateral dimensions of 155.0 μm. | ||
Deposition onto other substrates can result in a crossover from a crystalline to amorphous sediment depending on the deposition conditions. We refer to FCC, HCP, and RHCP ordered structures equally as “crystals” to distinguish them from amorphous packings, even though RHCP is not strictly periodic due to its ABC stacking disorder. We define amorphous or disordered packings as dense, isotropic structures that lack long-range periodicity.
On a (111) template, we obtain crystals in sedimentation at 1g with ϕ0 = 0.29%, but under centrifugation conditions the same initial volume fraction produces structures that rapidly degrade into an amorphous sediment. The template constrains the first layer of particles to form a perfect crystal plane. Under centrifugation conditions, after the first layer we observe a few RHCP layers at the bottom of the sediment; then, crossover to the amorphous state begins. Patches of particles settle into a stacking position different from their surroundings and form a local stacking fault. The number of ordered layers deposited before this crossover begins varies; sometimes, significant local stacking faults occur as early as the second layer. In subsequent layers, the boundaries between these patches and the surrounding crystal become sources of disorder. Once disorder is established locally, everything above it is amorphous and the disordered region spreads laterally as the sediment accumulates. Ultimately, the amorphous sediment spreads throughout the sample.
A typical layer-by-layer sequence at the onset of crystalline-to-amorphous crossover for a sample with ϕ0 = 0.29% centrifuged at 100g onto a (111) template is shown in Fig. 3. In this example, the first 7 layers of the crystal have the RHCP stacking sequence ACACABC, and significant local faulting begins around layer 8. By layer 23 the crystal has all but disappeared.
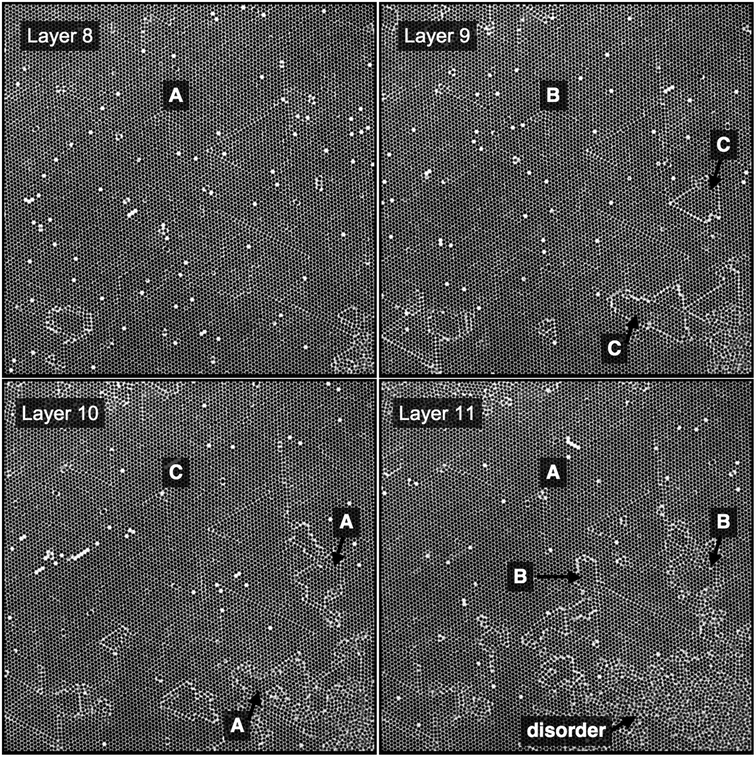 | ||
| Fig. 3 Layer-by-layer horizontal confocal image slices showing the onset of crystalline to amorphous crossover in a colloid sample centrifuged at 100g onto a (111) template from an initial volume fraction ϕ0 = 0.29%. Labels indicate the stacking positions of the particles relative to layer 1 which is templated in the A position (see Fig. 1). Each image has lateral dimensions of 155.0 μm. Consecutive layers are separated by 1.2 μm. | ||
We also tested the effect of increased initial volume fraction during sedimentation at 1g onto the (111) template. For ϕ0 = 2%, we observe a crossover to the amorphous state initiated by local stacking faults, as with the centrifuged samples. However, we also see some homogeneous nucleation of small RHCP crystallites in the bulk amorphous material. For ϕ0 ≥ 3% at 1g we observe a crossover to the amorphous state but no subsequent crystal nucleation.
Deposition onto a flat, featureless surface produces a sediment of which the first layer is polycrystalline with a predominantly (111) texture. The (111) plane is the densest packing of spheres in two dimensions and hence favored as the first layer structure, but occasional (100) domains exist as well. For ϕ0 = 0.29%, sedimentation at 1g onto a flat substrate results in a polycrystalline RHCP structure. For ϕ0 = 3% at 1g, however, the (111) texture rapidly degrades to an amorphous sediment by local stacking faults in the same way as the (111) templated crystals, with additional disorder initiated at grain boundaries. Centrifuging a colloid with ϕ0 = 0.29% onto a flat substrate results in a noticeably higher occurrence of the (100) texture in the first layer, even though the (111) texture still dominates. Although these centrifuged samples also cross over to forming an amorphous sediment, the native (100) regions are remarkably robust against disordering, and persist vertically until they are displaced by spreading adjacent disordered regions. The first and tenth particle layers of such a sample are shown in Fig. 4.
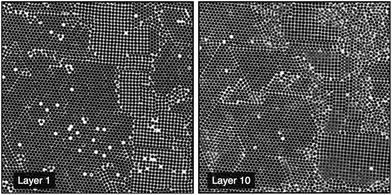 | ||
| Fig. 4 (Left), first layer of an untemplated colloidal polycrystal grown by centrifuging a colloid with ϕ0 = 0.29% onto a flat surface at 100g, showing spontaneously occurring (111) and (100) textures. (Right), the same area at layer 10, where crossover to amorphous is proceeding both from the original grain boundaries and by local stacking faults in the (111) regions. These images are not representative of the relative amounts of (111) and (100) textures in the overall sample, of which less than 10% is (100). Each image has lateral dimensions of 77.5 μm. | ||
Deposition onto (110) templates produces FCC crystals at 1g and low ϕ0. However, (110) is a significantly less dense crystal plane and never appears as a spontaneously occurring texture on a flat surface. With centrifugation or a high ϕ0 we observe degradation of order above the (110) templates by insertion of stacking fault planes along the direction where the pattern is less dense, perpendicular to the longer in-plane neighbor separation. This local disordering ultimately leads to the formation of an amorphous sediment.
In addition to the remarkable speed at which crystals can grow on a (100) template, we find that the as-formed crystal can be free of extended defects, such as dislocations or stacking faults. After some time, we observe that in certain cases extended defects nucleate at the top of the crystal and grow down into the bulk; whether or not this occurs depends, for a given template spacing, on the total height of the crystal. Eventually, the crystal reaches an equilibrium concentration of extended defects.
Although we usually remove the small population of 800 nm diameter particles that exist in the raw particle stock, we see interesting effects when these are left in. For crystals grown at 1g we observe only a small number of these particles in the interior of the crystal as substitutional impurities. Instead, most of them are excluded from the crystal as it grows, and are concentrated in the colloidal liquid fan just above the sediment. In centrifuged crystals, however, many of the small particles are trapped interstitially in the octahedral holes of the FCC crystals, while the number that occupy lattice sites remains roughly constant. This trapping process could extend the usefulness of colloidal crystals as experimental models to such phenomena as impurity trapping during rapid solidification of a melt front.20 This result also suggests that centrifugation of carefully designed colloids having a bimodal size dispersion may produce interesting new crystals.
4 Discussion
4.1 Role of critical flux and substrate pattern in determining crystal-to-amorphous crossover
We can quantitatively characterize all experiments by a dimensionless particle flux, defined as ϕ0Pe, where ϕ0 is the initial volume fraction of the particles and Pe = Δρgs![[R with combining macron]](https://www.rsc.org/images/entities/i_char_0052_0304.gif) 4/(kBT) is the Peclet number of the particles as described above.12 This quantity accounts for the effects of particle concentration, sedimentation velocity, and thermal equilibration, and enables useful comparison between experiments with different particle types and fluid phase compositions. Our experimental results for deposition onto (100), flat, (111), and (110) substrates are compared with the results of Davis et al.11 and Hoogenboom et al.12 for deposition onto flat, featureless substrates in Table 1. We summarize the resulting structures for the various deposition fluxes and substrate patterns in Fig. 5, in which solid symbols indicate a crystalline sediment and open symbols indicate an amorphous one. That Davis et al.'s amorphous result occurs at an anomalously low dimensionless flux compared with other data likely stems from the 6% polydispersity of their colloidal particles.
4/(kBT) is the Peclet number of the particles as described above.12 This quantity accounts for the effects of particle concentration, sedimentation velocity, and thermal equilibration, and enables useful comparison between experiments with different particle types and fluid phase compositions. Our experimental results for deposition onto (100), flat, (111), and (110) substrates are compared with the results of Davis et al.11 and Hoogenboom et al.12 for deposition onto flat, featureless substrates in Table 1. We summarize the resulting structures for the various deposition fluxes and substrate patterns in Fig. 5, in which solid symbols indicate a crystalline sediment and open symbols indicate an amorphous one. That Davis et al.'s amorphous result occurs at an anomalously low dimensionless flux compared with other data likely stems from the 6% polydispersity of their colloidal particles.
![[R with combining macron]](https://www.rsc.org/images/entities/i_char_0052_0304.gif) 4/(kBT) is the Peclet number of the particles. Dimensionless flux values for Hoogenboom et al.12 are computed from ϕ0 and Pe values reported in that reference; values for Davis et al.11 are calculated based on particle and fluid phase properties reported in that work
4/(kBT) is the Peclet number of the particles. Dimensionless flux values for Hoogenboom et al.12 are computed from ϕ0 and Pe values reported in that reference; values for Davis et al.11 are calculated based on particle and fluid phase properties reported in that work
| Reference | Diameter (μm) | Polydispersity (%) | ϕ 0 | g s (g) | ϕ 0Pe | Substrate | Resulting structure |
|---|---|---|---|---|---|---|---|
| This work | 1.55 | 3.5 | 0.0029 | 3000 | 7.2 | (100) | Crystalline |
| This work | 1.55 | 3.5 | 0.0029 | 3000 | 7.2 | Flat | Amorphous |
| This work | 1.55 | 3.5 | 0.0029 | 1500 | 3.6 | (100) | Crystalline |
| This work | 1.55 | 3.5 | 0.0029 | 1500 | 3.6 | (100) | Crystalline |
| This work | 1.55 | 3.5 | 0.0029 | 760 | 1.8 | (100) | Crystalline |
| This work | 1.55 | 3.5 | 0.0029 | 760 | 1.8 | Flat, (110) | Amorphous |
| This work | 1.55 | 3.5 | 0.0029 | 100 | 0.24 | (100) | Crystalline |
| This work | 1.55 | 3.5 | 0.0029 | 100 | 0.24 | (111),flat,(110) | Amorphous |
| This work | 1.55 | 3.5 | 0.0029 | 25 | 0.060 | (100) | Crystalline |
| Hoogenboom et al.12 | 1.38 | 1.5 | 0.052 | 1 | 0.028 | Flat | Amorphous |
| This work | 1.55 | 3.5 | 0.03 | 1 | 0.025 | Flat,(111) | Amorphous |
| This work | 1.55 | 3.5 | 0.02 | 1 | 0.017 | Flat,(111) | Amorphous |
| This work | 1.55 | 3.5 | 0.02 | 1 | 0.017 | (100) | Crystalline |
| Hoogenboom et al.12 | 1.38 | 1.5 | 0.026 | 1 | 0.014 | Flat | Crystalline |
| Hoogenboom et al.12 | 1.38 | 1.5 | 0.005 | 1 | 0.0025 | Flat | Crystalline |
| This work | 1.55 | 3.5 | 0.0029 | 1 | 0.0024 | All | Crystalline |
| This work | 1.55 | 3.5 | 0.0024 | 1 | 0.0020 | (110) | Crystalline |
| Davis et al.11 | 0.43 | 6 | 0.1 | 1 | 6.4 × 10⁻⁴ | Flat | Amorphous |
| Hoogenboom et al.12 | 0.998 | 3.3 | 0.004 | 1 | 5.2 × 10⁻⁴ | Flat | Crystalline |
| Davis et al.11 | 0.31 | 6 | 0.18 | 1 | 3.1 × 10⁻⁴ | Flat | Crystalline |
| This work | 1.55 | 3.5 | 3.6 × 10⁻⁴ | 1 | 3.0 × 10⁻⁴ | All | Crystalline |
| Hoogenboom et al.12 | 0.998 | 3.3 | 0.002 | 1 | 2.6 × 10⁻⁴ | Flat | Crystalline |
| Davis et al.11 | 0.34 | 6 | 0.09 | 1 | 2.3 × 10⁻⁴ | Flat | Crystalline |
| Davis et al.11 | 0.34 | 6 | 0.045 | 1 | 1.1 × 10⁻⁴ | Flat | Crystalline |
| This work | 1.55 | 3.5 | 1.2 × 10⁻⁴ | 1 | 1.0 × 10⁻⁴ | 100 | Crystalline |
| Davis et al.11 | 0.2 | 6 | 0.14 | 1 | 4.2 × 10⁻⁵ | Flat | Crystalline |
| Davis et al.11 | 0.2 | 6 | 0.13 | 1 | 3.9 × 10⁻⁵ | Flat | Crystalline |
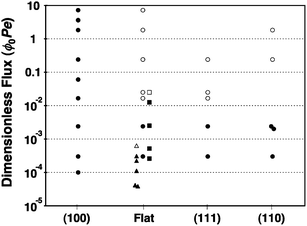 | ||
| Fig. 5 Overview of the structures obtained as a function of substrate type and dimensionless flux. Legend: (●) this work, crystalline; (○) this work, amorphous; (■) Hoogenboom et al., crystalline;12 (□) Hoogenboom et al., amorphous;12 (▲) Davis et al., crystalline;11 (Δ) Davis et al., amorphous.11 | ||
For our samples with polydispersity <3.5%, we observe a crystalline to amorphous crossover above ϕ0Pe ≈ 0.02 in all cases except for growth on the (100) template, which always produces single crystals. On flat substrates, where a (111) texture dominates, and on (111) templates, hard-sphere crystal growth suffers from a stacking degeneracy, as shown in Fig. 1. Starting from a layer in which the particles occupy A-positions, the next layer of particles has a choice of two stacking positions (B or C) that are distinct but energetically degenerate for hard spheres. As a result, local stacking faults form easily, and the edges of the faults initiate the onset of disorder. Once this disorder is established at a high dimensionless flux, a crystalline structure cannot be recovered and the amorphous region spreads upwards and outwards as deposition continues.
By contrast, the (100) template has no stacking degeneracy, and we observe no amorphous crossover for at least up to a dimensionless flux of ϕ0Pe = 7.2, roughly 500 times faster than the limiting rate on other substrates. We expect that much higher growth rates are possible. For growth in this orientation, each layer of particles precisely determines the center locations of the subsequent layer, as shown in Fig. 1. We refer to this as deterministic layering; each layer precisely fixes the next. As there is no mechanism for the onset of disorder, successive layers can nucleate randomly while the overall crystal remains perfect. Furthermore, the (100) plane is quite dense and thus resistant to insertion of interstitial particles. In principle (110) also has no stacking degeneracy, but because it is significantly less dense than (100) or (111), it does not sufficiently constrain the incoming particles in-plane. As a result, growth on a (110) template is susceptible to local disordering by insertion of additional particles and consequently to crossover to an amorphous sediment at a high dimensionless flux.
A similar orientation-dependence of defect structure and amorphous crossover at high growth rates has been observed in atomic crystals that have a low stacking fault energy, such as silicon.21 In pulsed-laser melting and regrowth experiments of substrates with different orientations, a maximum growth rate is observed above which crossover to an amorphous solid occurs. Below this critical velocity, growth in the [001] direction forms defect-free crystals, while rapid growth in the [111] direction results in significant local stacking faults, the density of which increases with growth velocity. These experiments also point to the possible use of colloidal materials as kinetic models for non-equilibrium materials.
4.2 Strain-induced defect nucleation and growth
While growth on (100) templates results in single crystals for all dimensionless fluxes, we observe that some of these crystals contain extended defects: stacking faults and dislocations (Shockley partials with ). During low-flux deposition, defects can result from impurities in the suspension during growth, but most defects nucleate after crystal growth is complete, driven by the strain that arises from a slight lattice mismatch between crystal and template. This lattice mismatch can be accommodated by the introduction of misfit dislocations at the interface. Growth at a high dimensionless flux kinetically suppresses both mechanisms. Due to the pressure head from the particles above, the lattice parameter of the unconstrained crystal and its compressibility decrease with increasing depth. Whether or not misfit dislocations nucleate depends on the misfit strain and the thickness of the crystal, which must exceed a critical value, hc = 26 μm.5,16,22
To study the defect density as a function of total crystal thickness, we prepared a series of FCC colloidal single crystals of various thicknesses by centrifugation onto (100) templates, as described above. We identify the stacking faults in reconstructed images of otherwise perfect FCC crystals by marking particles with a HCP-type local coordination.5 The edges of these stacking fault planes are the dislocations. The average linear distance between dislocation lines at the crystal–template interface, Λ, is determined from the number of HCP-coordinated particles, NSF, by computing the average distance between the {111} stacking fault planes. This is given by  , where Vc is the volume of the crystal and a is the average interparticle spacing. We show both a horizontal confocal image slice and a three-dimensional reconstruction of the stacking fault planes in a crystal grown to a super-critical (h > hc) thickness in Fig. 6.
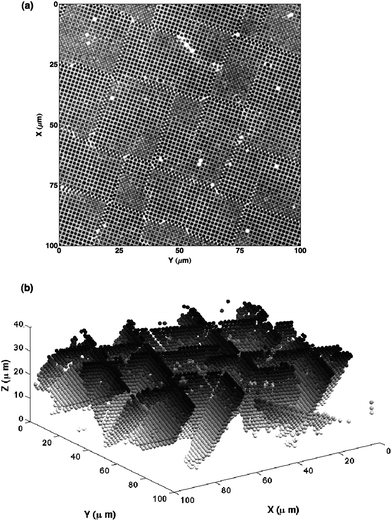 | ||
| Fig. 6 (a) Confocal image of a horizontal section through a colloidal FCC crystal grown to a total thickness of 42.9 μm on a (100) template. Because the crystal thickness exceeds the critical thickness, it acquired a significant concentration of stacking faults. (b) Three-dimensional reconstruction of stacking faults in the same crystal, with particles shaded according to their depth in the crystal. Stacking faults are identified as pairs of planes with local HCP coordination. | ||
The equation of state for hard spheres can be written as
| PV = Z(ϕ)kBT, | (1) |
 | (2) |
In this case, gs = 1g because the crystal is allowed to equilibrate outside of the centrifuge after crystal formation.
The equation of state then becomes:
 | (3) |
![[capital Omega, Greek, macron]](https://www.rsc.org/images/entities/i_char_e0c0.gif) = 1.96 μm3 is the average particle volume.23 The quantity
= 1.96 μm3 is the average particle volume.23 The quantity  μm is the gravitational length of a particle. Differentiating both sides with respect to u yields a differential equation for the volume fraction:
 | (4) |
The equation of state for hard spheres has been the subject of numerous theoretical and numerical studies.24–26 Using the form of Z(ϕ) for dense, hard-sphere crystals proposed by Hall25 and the initial condition of crystal–liquid coexistence ϕ(0) = 0.545, we numerically solve the differential equation for ϕ(u). Fig. 7 shows the calculated volume fraction and corresponding interparticle spacing a(u) as a function of depth in the crystal.27 For greater crystal depths, the system asymptotically approaches close packing (ϕCP = 0.740, aCP = 1.55 μm).
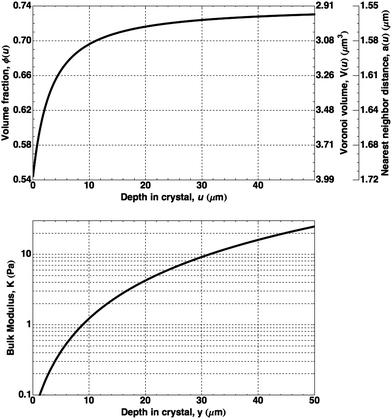 | ||
| Fig. 7 Calculated properties of an unconstrained FCC colloidal crystal as a function of depth in the crystal: (top) volume fraction, ϕ(u), and corresponding particle Voronoi volume, V(u), and interparticle spacing, a(u); (bottom) the bulk modulus, K(u). | ||
Fig. 7 also shows the depth-dependence of the bulk modulus, K:
 | (5) |
In Fig. 8 we compare the measured Voronoi volume averaged over entire crystals of various heights to the results of these calculations. Agreement is best with the data from those thick crystals (h > hc) most relaxed by the introduction of misfit dislocations as established by direct observation of the confocal images. That the data of the unrelaxed crystals lie above the curve can be attributed mostly to the expansion of the lattice by the template.
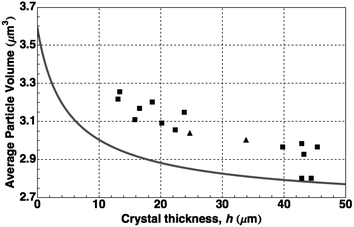 | ||
| Fig. 8 Average particle volume versus total crystal thickness. Each symbol corresponds to a crystal grown either by centrifugation (■) or by sedimentation (▲). The calculated values (solid line) are based on the hard-sphere equation of state (see text). | ||
We can use the continuum theory for misfit dislocations in epitaxial thin crystals5,16–28 to calculate the expected linear density of dislocations, Λ−1, as a function of the thickness of the colloidal crystals. The elastic strain energy resulting from the misfit, ε0, can be relieved by the insertion of dislocations (Shockley partials), resulting in a total elastic strain
 | (6) |
 .
.
The elastic energy per unit area stored in a strained film of thickness du at depth u is
| dUel = ε2elYdu, | (7) |
 | (8) |
The energy cost of having Λ−1 dislocations per unit length in the interface is given by the cylindrical integral29
 | (9) |
 is the effective dislocation core radius, rout is the outer radius of the dislocation strain field and is approximately equal to h for a dislocation at the crystal–template interface, μ = μ(u) is the depth-dependent shear modulus, and ν is Poisson's ratio. While the biaxial and shear moduli vary with depth in the crystal, we assume that Poisson's ratio remains roughly constant throughout the crystal, consistent with simulation results for hard sphere crystals.30
By approximating the colloidal crystal as an isotropic, elastic medium, the biaxial and shear moduli can be expressed in terms of the bulk modulus and Poisson's ratio:  and
and  . Minimization of the total energy, U = Uel + Ul, with respect to the defect density, Λ−1, yields an expression for the equilibrium defect density:
 | (10) |
By substituting u = h − r sin θ into the cylindrical integral, this expression can be evaluated to predict the equilibrium defect density as a function of total crystal height. For our particles, this predicts a critical thickness, corresponding to Λ−1 = 0, of hc = 26 μm, below which defect formation is suppressed. We plot our experimental measurements (points) and the calculated physical defect density (solid line) in Fig. 9, and find good agreement. The measured values of Λ−1 for crystals with supercritical thickness all lie below the calculated equilibrium values, indicating that the strain relaxation at the time of the measurements was still incomplete. Nucleation and growth of dislocations get exponentially slower as relaxation proceeds due to the decreasing driving force; the kinetics of these processes have been studied in detail in colloidal crystals by Schall et al.5 The supercritical data may be slightly high because of the presence of non-dislocation-related defects, which could not be quantitatively removed from the calculation of Λ−1. The subcritical crystals are all dislocation-free, even though they occasionally contain other types of imperfections.
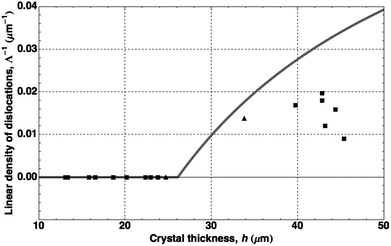 | ||
| Fig. 9 Linear density of dislocations, Λ−1, vs. total crystal thickness. Points indicate experimental data from colloidal single crystals obtained by centrifugation (■) and by low-flux sedimentation (▲). The gray line represents the values calculated from eqn (10). | ||
By decreasing the nearest neighbor distance of the template and depositing onto such templates at high dimensionless fluxes so that defect nucleation is suppressed during growth, it should be possible to form arbitrarily large crystals entirely free of extended defects. Using a template designed with a slightly smaller lattice spacing, we have already made crystals greater than 50 μm tall in which extended defects do not form.
5 Conclusion
When growing colloidal structures epitaxially onto a patterned substrate, the deposition rate (dimensionless flux), template pattern, and the relation between the template spacing and the crystal thickness determine the resulting structure. A detailed understanding of these parameters makes it possible to grow perfect crystals more rapidly than previously believed. This may also be a method for creating non-equilibrium colloidal structures in a controlled way.In this paper, we report the growth of large, defect-free, FCC colloidal single crystals by centrifugation onto (100) templates at growth rates of up to ∼10 μm s−1. This rapid crystal growth is possible because deposition onto a (100) template gives incoming particles no choice of position; the layering is completely deterministic. In principle there is no limit to the size of the (100)-oriented FCC crystals that can be grown in this manner, and much higher deposition rates may be possible. Recent numerical simulations have produced similar results.31 Our results point to a method both for rapid, reliable production of large three-dimensional colloidal crystals and also for building any other colloidal structures that can be described by deterministic layering of densely packed planes.
High-flux deposition onto a (111) template, which provides the particles with two degenerate stacking positions, or a (110) template, which lacks sufficient in-plane density to fix the incoming particle positions, rapidly leads to disordering into an amorphous sediment. We find that on flat, (111), and (110) substrates, the transition to an amorphous sediment occurs if the dimensionless flux exceeds ϕ0Pe ≈ 0.02.
We investigated the defect formation in these crystals in detail by measuring the densities of extended defects as a function of crystal thickness and could account for these results using the Frank–van der Merwe continuum theory adapted for the hard sphere equation of state.
While the focus of this paper is on crystal formation, sometimes amorphous structures are desired. Studies of the colloidal glass transition,32 structural relaxation and aging of glasses,33,34 and deformation of amorphous materials35,36 require consistent, reliable production of amorphous structures. We have designed amorphous templates that produce stable, monodisperse, hard-sphere colloidal glasses without centrifugation. By starting with ϕ0 ≥ 3% to obtain a high dimensionless flux at 1g, we have created an amorphous sediment on templates that either enforce maximum (111) B/C stacking disorder in the first layer (similar to the macroscopic experiment described in ref. 37) or that simply prevent periodicity of the first layers in any dimension.
This work was supported by the NSF through the Harvard MRSEC (Contract #DMR-0820484). D.P. participated in the NSF REU program. We thank previous REU students Emily Margolis and Anjali Bhatt for some related observations, summer high-school student Emma Thomas for the charge screening experiment, and Maria Persson Gulda for one of the (110) observations. The templates were fabricated at the Center for Nanoscale Systems (CNS) at Harvard University, a member of the National Nanotechnology Infrastructure Network (NNIN), which is supported by the NSF (Award #ECS-0335765).
Notes and references
- E. C. Nelson, N. L. Dias, K. P. Bassett, S. N. Dunham, V. Verma, M. Miyake, P. Wiltzius, J. A. Rogers, J. J. Coleman, X. Li and P. Braun, Nat. Mater., 2011, 10, 676 CrossRef CAS.
- O. D. Velev, T. A. Jede, R. F. Lobo and A. M. Lenhoff, Nature, 1997, 389, 447 CrossRef CAS.
- O. D. Velev and A. M. Lenhoff, Curr. Opin. Colloid Interface Sci., 2000, 5, 56 CrossRef CAS.
- B. Hatton, L. Mishchenko, S. Davis, K. H. Sandhage and J. Aizenberg, Proc. Natl. Acad. Sci. U. S. A., 2010, 107, 10354 CrossRef CAS.
- P. Schall, I. Cohen, D. A. Weitz and F. Spaepen, Science, 2004, 305, 1944 CrossRef CAS.
- P. Schall, I. Cohen, D. A. Weitz and F. Spaepen, Nature, 2006, 440, 319 CrossRef CAS.
- P. Jiang, J. F. Bertone, K. S. Hwang and V. L. Colvin, Chem. Mater., 1999, 11, 2132 CrossRef CAS.
- K. Lin, J. C. Crocker, V. Prasad, A. Schofield, D. A. Weitz, T. C. Lubensky and A. G. Yodh, Phys. Rev. Lett., 2000, 85, 1770 CrossRef CAS.
- J. Zhang, A. Alsayed, K. H. Lin, S. Sanyal, F. Zhang, W.-J. Pao, V. S. K. Balagurusamy, P. A. Heiney and A. G. Yodh, Appl. Phys. Lett., 2002, 81, 3176 CrossRef CAS.
- K. E. Davis and W. B. Russel, Adv. Ceram., 1987, 21, 573 Search PubMed.
- K. E. Davis, W. B. Russel and W. J. Glantschnig, Science, 1989, 245, 507 CAS.
- J. P. Hoogenboom, D. Derks, P. Vergeer and A. van Blaaderen, J. Chem. Phys., 2002, 117, 11320 CrossRef CAS.
- N. V. Dziomkina and G. J. Vancso, Soft Matter, 2005, 1, 265 RSC.
- A. van Blaaderen, R. Ruel and P. Wiltzius, Nature, 1997, 385, 321 CrossRef CAS.
- I. B. Ramsteiner, K. E. Jensen, D. A. Weitz and F. Spaepen, Phys. Rev. E: Stat., Nonlinear, Soft Matter Phys., 2009, 79, 011403 CrossRef CAS.
- F. C. Frank and J. H. van der Merwe, Proc. R. Soc. London, Ser. A, 1949, 198, 216 CrossRef CAS.
- We purchase specially-filtered Sicaster plain particles from Micromod, http://www.micromod.de.
- Hexagonal close-packed planes can occupy three distinct stacking positions, designated as A, B, and C, as shown in Fig. 1a. In face-centered cubic (FCC) crystals they occur in the sequence ABCABC and are (111) planes. In hexagonal close-packed (HCP) crystals they occur in the sequence ABABAB and are (0002) planes. Hard-sphere FCC and HCP crystals have the same density.
- Y. Gao and M. L. Kilfoil, Opt. Express, 2009, 17, 4685 CrossRef.
- M. Tabbal, T. Kim, D. N. Woolf, B. Shin and M. J. Aziz, Appl. Phys. A: Mater. Sci. Process., 2010, 98, 589 CrossRef CAS; M. J. Aziz, J. Appl. Phys., 1982, 53, 1158 CrossRef.
- A. G. Cullis, N. G. Chew and H. C. Webber, J. Cryst. Growth, 1984, 68, 624 CrossRef CAS.
- J. W. Matthews and A. E. Blakeslee, J. Cryst. Growth, 1974, 27, 118 CAS.
- According to the manufacturer, the particles have an average diameter 2
![[R with combining macron]](https://www.rsc.org/images/entities/i_char_0052_0304.gif) = 1.55 μm. The polydispersity, measured by fitting the first peak of the radial distribution function from a densely packed sample and deconvolving to obtain the particle size distribution, is (σ/
= 1.55 μm. The polydispersity, measured by fitting the first peak of the radial distribution function from a densely packed sample and deconvolving to obtain the particle size distribution, is (σ/![[R with combining macron]](https://www.rsc.org/images/entities/i_char_0052_0304.gif) ) = 0.035, which corresponds to σ = 0.054 μm. The average volume of the particles,
) = 0.035, which corresponds to σ = 0.054 μm. The average volume of the particles, ![[capital Omega, Greek, macron]](https://www.rsc.org/images/entities/i_char_e0c0.gif) is derived from the third moment of the distribution function. For a normal distribution, this gives
is derived from the third moment of the distribution function. For a normal distribution, this gives  , which
is slightly larger than
  . The larger value
 ![[capital Omega, Greek, macron]](https://www.rsc.org/images/entities/i_char_e0c0.gif) should be used in the equation of state. This effect becomes more significant as the polydispersity increases.
should be used in the equation of state. This effect becomes more significant as the polydispersity increases. - N. F. Carnahan and K. E. Starling, J. Chem. Phys., 1969, 51, 635 CrossRef CAS.
- K. R. Hall, J. Chem. Phys., 1972, 57, 2252 CrossRef CAS.
- B. J. Alder, W. G. Hoover and D. A. Young, J. Chem. Phys., 1968, 49, 3688 CrossRef CAS.
- Even with polydispersity, the relation between the average nearest neighbor distances and the volume fraction is still that of the monodisperse FCC lattice:
 .
. - J. P. Hirth and J. Lothe, Theory of Dislocations, John Wiley & Sons, New York, 1982 Search PubMed.
- An additional difference from the classical theory is the large difference in stiffness between the colloidal crystal and the glass template (1 vs. 1011 Pa), which makes the latter rigid, and hence strain-free, in the calculation. This is incorporated into the dislocation energy calculation by introducing an image dislocation of the same magnitude and strain, which doubles the strain and quadruples the strain energy density in the colloidal half-crystal with respect to a dislocation in a homogeneous colloidal crystal.
- M. V. Jarić and U. Mohanty, Phys. Rev. B: Condens. Matter Mater. Phys., 1988, 37, 4441 CrossRef.
- A. Mori, Y. Suzuki, S. Matsuo, 2012, arXiv:1201.4488v1 [cond-mat.soft].
- G. L. Hunter and E. R. Weeks, Rep. Prog. Phys., 2012, 75, 066501 CrossRef.
- E. R. Weeks, J. C. Crocker, A. C. Levitt, A. Schofield and D. A. Weitz, Science, 2000, 287, 627 CrossRef CAS.
- G. C. Cianci, R. E. Courtland and E. R. Weeks, Solid State Commun., 2006, 139, 599 CrossRef CAS.
- P. S. Schall, D. A. Weitz and F. Spaepen, Science, 2007, 318, 1985 CrossRef.
- R. Besseling, E. R. Weeks, A. B. Schofield and W. C. K. Poon, Phys. Rev. Lett., 2007, 99, 028301 CrossRef CAS.
- F. Spaepen, Acta Metall., 1975, 23, 729 CrossRef CAS; F. Spaepen and R. B. Meyer, Scr. Metall., 1976, 10, 257 CrossRef; D. R. Nelson and F. Spaepen, Solid State Phys., 1989, 42, 58 Search PubMed.
| This journal is © The Royal Society of Chemistry 2013 |
