Wetting on two parallel fibers: drop to column transitions
S.
Protiere†
a,
C.
Duprat†
b and
H. A.
Stone
b
aCNRS, UPMC Université Paris 06, UMR 7190, Institut Jean le Rond d'Alembert, F-75005, Paris, France. E-mail: protiere@ida.upmc.fr
bDepartment of Mechanical and Aerospace Engineering, Princeton University, Princeton, New Jersey 08544, USA. E-mail: hastone@princeton.edu
First published on 17th October 2012
Abstract
While the shape and stability of drops on single cylindrical fibers have received vast attention, there are few studies that consider a drop sitting between two fibers, which is a first step toward understanding the wetting of larger fibrous networks. In this paper, we investigate experimentally the behavior of a finite volume of liquid on two parallel rigid fibers. The liquid wetting the fibers can adopt two distinct equilibrium shapes: a compact approximately hemispherical drop shape or a long liquid column of constant cross-section. These two morphologies depend on the inter-fiber distance, the liquid volume, the fiber radius and the liquid–fiber contact angle. We study the transitions between a drop shape and a column by incrementally varying the inter-fiber distance and find that the transition depends on the global geometry of the system as well as on the volume of liquid. For totally wetting drops, we identify the regions where the drops or columns prevail, and find that there is a region where both morphologies are stable, and the transitions from one state to the other are hysteretic. These switches in morphologies may be used to manipulate or transport liquid at small scales.
1 Introduction
The wetting and wicking of liquids in fibrous media is important in many engineered products: e.g. liquid retention in textiles,1 clogging of coalescence filters,2 wetting of fiber arrays,3 and enhanced transpiration from surfaces. In natural systems, the interactions of fibers and liquid are ubiquitous, e.g. wetting and drying of hair, or how the well-ordered hierarchical fibrous structures (barbs and barbules) of bird feathers confer them their strong water repellency properties.4 With this motivation, fundamental studies of fiber–liquid interactions have mostly focused on single drops on single fibers. For example, many studies consider the equilibrium shapes of a drop on a fiber, in particular the existence of two states: barrel or clamshell.5–9 Furthermore, drop-on-fiber systems have been proposed as a way to displace small amounts of liquids.10,11However, fibrous media are composed of not one but many fibers often in more or less parallel array. The basic response of such ordered materials when interacting with a liquid may be captured by considering a drop on two rigid parallel fibers. In this case, provided the distance between the fibers is smaller than a critical value, a drop of wetting liquid will spontaneously wick in the inter-fiber channel.12 For example, Miller et al.13 observed that below a critical inter-fiber distance, the drop spontaneously spreads and that the spreading can be reversed by separating the fibers, and this spreading/pinning transition has been proposed to displace fluids on a small scale.14 In fact, the wicking leads to a novel equilibrium state where the liquid adopts the shape of a column of constant cross-section, as studied by Princen.15 His theory describes in detail the shape of the column and specifies its region of existence (but not stability) as a function of the distance between the fibers. The effect of the contact angle on the column shape has also been investigated.16
Thus, it is known that a finite volume on two fibers can adopt one of two stable states. In this paper, we characterize the transition between drops and columns. In particular, we identify the domains of existence of these two states and show that the transition is hysteretic. As a consequence, the two states may coexist for certain parameter values and we provide energy arguments to understand this coexistence. These changes in morphology can then be used in order to shape and manipulate liquids at a small scale.
2 Experiments
A volume of nonvolatile liquid deposited on two parallel rigid fibers can adopt two distinct equilibrium shapes of finite length: a compact hemispherical shape, that we refer to as drop (Fig. 1a–c), or a long column of liquid of constant cross-section (Fig. 1d–f). In the column shape the liquid is confined between the two fibers, while in the drop shape the liquid overspills the fibers. When the liquid is in the column state, its volume may be increased or decreased and the column will only grow or shrink in length while its cross-section remains constant. We note that an additional bridge shape, where the drop is not wrapped around the fibers, can exist for larger inter-fiber distances. This state and the associated transition was investigated numerically by Wu et al.17 In this paper, we focus on the drop and column shapes, and identify and characterize their domains of existence.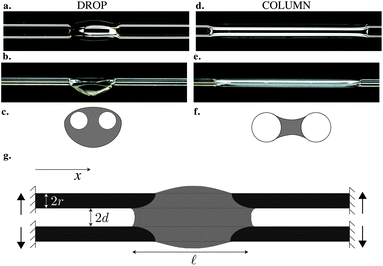 | ||
| Fig. 1 A wetting drop deposited on two parallel fibers can either adopt (a–c) a drop shape or (d–f) a column shape. Top (a and d) and side (b and e) views. (c and f) Sketch of the cross-section. (g) Sketch of the set-up. | ||
The equilibrium state depends on the fiber radius r, the inter-fiber distance 2d, the drop volume V, and the liquid/fiber contact angle θe. We limit our study to perfectly wetting drops, i.e. θe = 0, and we consider perfectly rigid fibers, i.e. there is no deformation and d is constant along the fibers. We neglect gravitational effects; the capillary length  , where γ and ρ are the surface tension and density of the liquid, is about 1.5 mm, which is larger than the typical height H of the liquid in our experiments. We believe that gravity makes modest changes to the shape of the drops but does not affect the drop-to-column transition. The final equilibrium state thus depends on the drop volume and the inter-fiber distance. As the radius r is our only other length scale, we can construct two dimensionless parameters
 ![[d with combining tilde]](https://www.rsc.org/images/entities/i_char_0064_0303.gif) = d/r and Ṽ = V/r3. For a given pair of fibers, we deposit a drop of wetting liquid of given volume and vary the distance between the fibers. Each fiber is mounted independently on a stage with a micrometer drive in order to vary the inter-fiber distance 2d in small increments of ≈5 μm (Fig. 1g). For each step in d, we reach an equilibrium state and we record the morphology of the liquid from the top and the side with cameras. The side view allows us to discriminate drops from columns by measuring the liquid profile H(x); we define a column by a constant H ≲ 2r. In addition, we measure the wetted length
= d/r and Ṽ = V/r3. For a given pair of fibers, we deposit a drop of wetting liquid of given volume and vary the distance between the fibers. Each fiber is mounted independently on a stage with a micrometer drive in order to vary the inter-fiber distance 2d in small increments of ≈5 μm (Fig. 1g). For each step in d, we reach an equilibrium state and we record the morphology of the liquid from the top and the side with cameras. The side view allows us to discriminate drops from columns by measuring the liquid profile H(x); we define a column by a constant H ≲ 2r. In addition, we measure the wetted length ![[small script l]](https://www.rsc.org/images/entities/char_e146.gif) (Fig. 1g).
(Fig. 1g).
We performed a large set of experiments for various fiber radii r, drop volumes V, and fiber and liquid properties. In particular we used both nylon and glass fibers of diameter 2r = 0.2, 0.3, 0.35 mm. We investigated the behavior of perfectly wetting liquids, silicone and mineral oils, with volumes varying between 0.5 and 8 μL. We can measure the liquid–solid contact angle from the shape of a drop on a fiber.5 The fibers are illuminated from below, and we make sure that the edges of the fibers are detected correctly by eliminating any reflection and carefully calibrating our measurements.
3 Equilibrium shapes
For a given drop volume V, a typical experiment consists of bringing the fibers together by decreasing d incrementally, until d ≈ 0, and then separating them by increasing d in a similar fashion. We observe two possible behaviors (Fig. 2). For small volumes (here V = 1 μL, i.e. Ṽ = 512), as d decreases the drop elongates smoothly into a column (Fig. 2a). As the fibers are separated, the column reverts back to a drop adopting the same intermediate shapes, i.e. the changes in shape are reversible. However, the drop position may shift due to small pinning effects. For large volumes (here V = 4 μL, i.e. Ṽ = 2048), we observe a sharp transition (see Fig. 2b): there is a critical distance ddc at which the drop suddenly spreads into a long liquid column. As d is increased, the column becomes more rounded and its length![[small script l]](https://www.rsc.org/images/entities/char_e146.gif) decreases. At another critical distance dcd, the column suddenly collapses into a drop.
decreases. At another critical distance dcd, the column suddenly collapses into a drop.
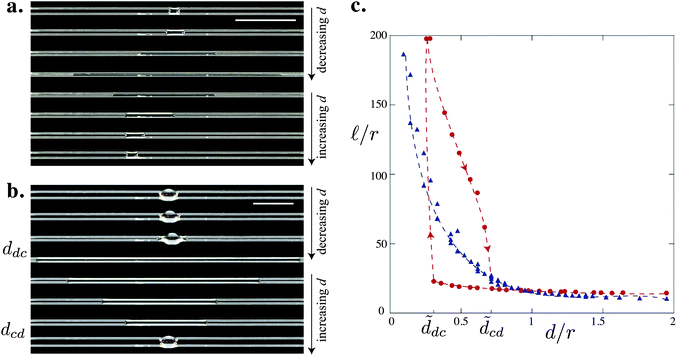 | ||
Fig. 2 Evolution of a drop on two parallel fibers as the distance between the fibers is varied for glass fibers of radius r = 0.25 mm and of volume (a) V = 1 μL and (b) V = 4 μL. Scale bars = 1 cm. (c) Evolution of the length of the drop  = = ![[small script l]](https://www.rsc.org/images/entities/char_e146.gif) /r with the inter-fiber distance /r with the inter-fiber distance ![[d with combining tilde]](https://www.rsc.org/images/entities/i_char_0064_0303.gif) = d/r for V = 1 μL (△) and V = 4 μL (○). The arrows indicate the direction of the hysteretic loop. The dashed lines are drawn to guide the eye. = d/r for V = 1 μL (△) and V = 4 μL (○). The arrows indicate the direction of the hysteretic loop. The dashed lines are drawn to guide the eye. | ||
The two behaviors are well represented by the evolution of the normalized wetted length  =
= ![[small script l]](https://www.rsc.org/images/entities/char_e146.gif) /r as a function of
/r as a function of ![[d with combining tilde]](https://www.rsc.org/images/entities/i_char_0064_0303.gif) = d/r, as seen in Fig. 2c, which clearly shows the drop-to-column reversibility for small volumes and the hysteretic behavior for larger volumes. These results indicate that, for certain values of
= d/r, as seen in Fig. 2c, which clearly shows the drop-to-column reversibility for small volumes and the hysteretic behavior for larger volumes. These results indicate that, for certain values of ![[d with combining tilde]](https://www.rsc.org/images/entities/i_char_0064_0303.gif) , both the drop and the column morphologies coexist. These experiments are highly reproducible, which indicates that the observed shapes correspond to stable states. Before the transitions, small perturbations do not affect the liquid shape. We can also note that for the same
, both the drop and the column morphologies coexist. These experiments are highly reproducible, which indicates that the observed shapes correspond to stable states. Before the transitions, small perturbations do not affect the liquid shape. We can also note that for the same ![[d with combining tilde]](https://www.rsc.org/images/entities/i_char_0064_0303.gif) , the wetted portion of the fibers is significantly higher in the column morphology than in the drop shape (up to 8 times longer).
, the wetted portion of the fibers is significantly higher in the column morphology than in the drop shape (up to 8 times longer).
We present data for various fibers and liquids and for a wide range of volumes in Fig. 3 where we plot  =
= ![[small script l]](https://www.rsc.org/images/entities/char_e146.gif) /r versus
/r versus ![[d with combining tilde]](https://www.rsc.org/images/entities/i_char_0064_0303.gif) = d/r. The scattering of the data for small
= d/r. The scattering of the data for small ![[d with combining tilde]](https://www.rsc.org/images/entities/i_char_0064_0303.gif) (
(![[d with combining tilde]](https://www.rsc.org/images/entities/i_char_0064_0303.gif) ≲ 1.4) illustrates the coexistence of both short drops and long columns, whose lengths depend on both the volume and fiber radius. We thus plot a renormalized length
≲ 1.4) illustrates the coexistence of both short drops and long columns, whose lengths depend on both the volume and fiber radius. We thus plot a renormalized length  /Ṽ (Fig. 3b) and observe that the data organize in two distinct trends: for the drop morphology all the data are scattered, but for the column morphology the data collapse onto a single curve. Since the column has a constant cross-sectional area A along its length (we neglect the shape of the meniscii at the edges),15 we have V = A
![[small script l]](https://www.rsc.org/images/entities/char_e146.gif) and the collapse of all data onto a single curve confirms that à = A/r2 = Ṽ/
and the collapse of all data onto a single curve confirms that à = A/r2 = Ṽ/ solely depends on the inter-fiber distance
 ![[d with combining tilde]](https://www.rsc.org/images/entities/i_char_0064_0303.gif) , i.e. increasing the volume increases the column length but does not change its cross-sectional shape.
, i.e. increasing the volume increases the column length but does not change its cross-sectional shape.
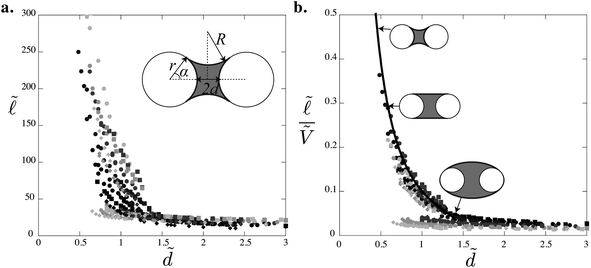 | ||
Fig. 3 (a) Evolution of the length  = = ![[small script l]](https://www.rsc.org/images/entities/char_e146.gif) /r as the distance /r as the distance ![[d with combining tilde]](https://www.rsc.org/images/entities/i_char_0064_0303.gif) = d/r is varied. The inset displays a sketch of the column cross-section, characterized by the angle α and the radius of curvature R. (b) Rescaled data: evolution of = d/r is varied. The inset displays a sketch of the column cross-section, characterized by the angle α and the radius of curvature R. (b) Rescaled data: evolution of  /Ṽ = 1/Ã with /Ṽ = 1/Ã with ![[d with combining tilde]](https://www.rsc.org/images/entities/i_char_0064_0303.gif) for glass fibers of radius 2r = 0.25 mm (○), nylon fibers of radii 2r = 0.2 mm (□) and 2r = 0.35 mm (◇) for increasing volumes Ṽ = V/r3 (373 < Ṽ < 1500 from black to light gray). The curve is the analytical prediction given by eqn (2)–(4). Sketches of the cross-sectional area at different values of for glass fibers of radius 2r = 0.25 mm (○), nylon fibers of radii 2r = 0.2 mm (□) and 2r = 0.35 mm (◇) for increasing volumes Ṽ = V/r3 (373 < Ṽ < 1500 from black to light gray). The curve is the analytical prediction given by eqn (2)–(4). Sketches of the cross-sectional area at different values of ![[d with combining tilde]](https://www.rsc.org/images/entities/i_char_0064_0303.gif) indicated by the arrows. indicated by the arrows. | ||
The shape of the column can be determined analytically by following the arguments of Princen.15 The shape of the free surface is given by its radius of curvature R and the angle α at the liquid–fiber–air interface (see inset of Fig. 3a). A force balance on a small volume dV = AdL leads to the equilibrium condition
 | (1) |
![[R with combining tilde]](https://www.rsc.org/images/entities/i_char_0052_0303.gif) = R/r through the geometric relation
= R/r through the geometric relationà = ![[R with combining tilde]](https://www.rsc.org/images/entities/i_char_0052_0303.gif) 2(4α − π − f(α))+2 2(4α − π − f(α))+2![[R with combining tilde]](https://www.rsc.org/images/entities/i_char_0052_0303.gif) sin 2α − f(α). sin 2α − f(α). | (2) |
Using (2), the condition (1) leads to an expression for the radius of curvature
 | (3) |
Finally, geometric considerations give the relation between the inter-fiber distance and the angle α
![[d with combining tilde]](https://www.rsc.org/images/entities/i_char_0064_0303.gif) = cos α(1 + = cos α(1 + ![[R with combining tilde]](https://www.rsc.org/images/entities/i_char_0052_0303.gif) ) − 1. ) − 1. | (4) |
For each value of ![[d with combining tilde]](https://www.rsc.org/images/entities/i_char_0064_0303.gif) , we thus obtain a unique cross-sectional shape of angle α, radius of curvature
, we thus obtain a unique cross-sectional shape of angle α, radius of curvature ![[R with combining tilde]](https://www.rsc.org/images/entities/i_char_0052_0303.gif) , and specific area Ã, where the column length is given by
, and specific area Ã, where the column length is given by  = Ṽ/Ã.
The theoretical shape given by eqn (2)–(4) is in good agreement with our experiments (see Fig. 3b). As ![[d with combining tilde]](https://www.rsc.org/images/entities/i_char_0064_0303.gif) increases, the angle α increases, the radius of curvature changes from positive, corresponding to the free surface curved toward the liquid phase, to negative, corresponding to the free surface curved toward the vapor phase, with a divergence at
increases, the angle α increases, the radius of curvature changes from positive, corresponding to the free surface curved toward the liquid phase, to negative, corresponding to the free surface curved toward the vapor phase, with a divergence at ![[d with combining tilde]](https://www.rsc.org/images/entities/i_char_0064_0303.gif) = π/2 − 1 where the column is flat as sketched in Fig. 3b. The column shape can only exist for values of the angle α ≤ π. This condition is met when
= π/2 − 1 where the column is flat as sketched in Fig. 3b. The column shape can only exist for values of the angle α ≤ π. This condition is met when  . For small volumes all data points for
  indeed collapse onto the theoretical curve. However, for larger volumes an increasing number of data points lie in a drop state below this curve. This coexistence of the drop and column states is the focus of the next section.
4 Morphology diagram and hysteresis
We report all of our experimental data in a morphology diagram in Fig. 4. Three well-defined regions emerge: drop, column and coexistence of both states. As suggested by Princen's theory,15 we show analytically that only drops exist above . For small volumes, Ṽ < 700, the transition between drop and column occurs at
  , i.e. there is no coexistence region. Above this volume, we find that the coexistence region widens with increasing volume, so that the liquid remains as a drop for increasingly smaller values of d.
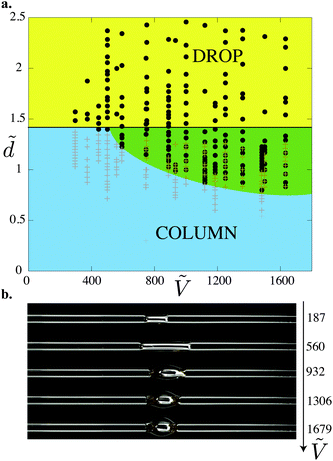 | ||
Fig. 4 (a) Morphology diagram in the parameter space (![[d with combining tilde]](https://www.rsc.org/images/entities/i_char_0064_0303.gif) ,Ṽ): drops (●, dark gray) and columns (+, light gray). The darker overlap region corresponds to the region where both drops and columns coexist. The horizontal line corresponds to ,Ṽ): drops (●, dark gray) and columns (+, light gray). The darker overlap region corresponds to the region where both drops and columns coexist. The horizontal line corresponds to  . (b) Concomitantly, the same drop to column transition exists when d is fixed and liquid is progressively added to the drop: top view of nylon fibers of radius 2r = 0.35 mm at the fixed distance . (b) Concomitantly, the same drop to column transition exists when d is fixed and liquid is progressively added to the drop: top view of nylon fibers of radius 2r = 0.35 mm at the fixed distance ![[d with combining tilde]](https://www.rsc.org/images/entities/i_char_0064_0303.gif) = 1.06. 2 μL is added between each photograph to a 1 μL drop. = 1.06. 2 μL is added between each photograph to a 1 μL drop. | ||
Another way to explore this morphology diagram is to fix the inter-fiber distance and add liquid incrementally. Fig. 4b shows such an experiment for ![[d with combining tilde]](https://www.rsc.org/images/entities/i_char_0064_0303.gif) = 1.06: we start with a small liquid column (Ṽ < 700) and add small amounts of liquid, which corresponds to moving horizontally in Fig. 4a. At a given volume, we cross the boundary and the liquid column spontaneously adopts a drop shape.
= 1.06: we start with a small liquid column (Ṽ < 700) and add small amounts of liquid, which corresponds to moving horizontally in Fig. 4a. At a given volume, we cross the boundary and the liquid column spontaneously adopts a drop shape.
To understand the boundaries of the coexistence region we need to compare the surface energies of both a column and a drop and then seek for the minimal energy to find the most stable state. The total surface energy is defined as
| E = γALV − γcosθeASL, | (5) |
 | (6) |
This expression can be calculated analytically using eqn (2) and (3).
In contrast, the drop shape is more complex and cannot be defined analytically. However, we can estimate its energy by considering a sphere, of equivalent radius (3V/4π)1/3, pierced at its center by the two fibers. In this case we find
 | (7) |
We plot Ẽcol and Ẽdrop as a function of ![[d with combining tilde]](https://www.rsc.org/images/entities/i_char_0064_0303.gif) for various dimensionless volumes in Fig. 5a and for
for various dimensionless volumes in Fig. 5a and for  , where both drops and columns can exist. Ẽdrop only weakly depends on
 ![[d with combining tilde]](https://www.rsc.org/images/entities/i_char_0064_0303.gif) , while Ẽcol rapidly decreases and changes sign when the column inverts its curvature (at
, while Ẽcol rapidly decreases and changes sign when the column inverts its curvature (at ![[d with combining tilde]](https://www.rsc.org/images/entities/i_char_0064_0303.gif) = π/2 − 1 ≈ 0.57). For small volumes Ẽdrop is always larger than Ẽcol, indicating that the column is always the most stable state and the transitions should occur at
= π/2 − 1 ≈ 0.57). For small volumes Ẽdrop is always larger than Ẽcol, indicating that the column is always the most stable state and the transitions should occur at  . When the volume is increased, Ẽcol can be larger than Ẽdrop for certain values of
 ![[d with combining tilde]](https://www.rsc.org/images/entities/i_char_0064_0303.gif) .
.
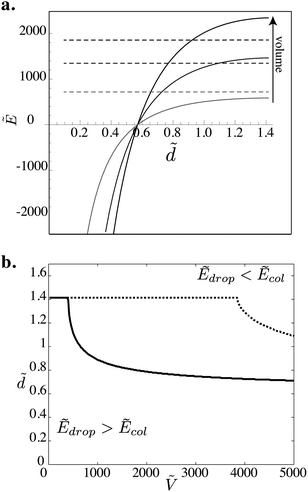 | ||
Fig. 5 (a) Evolution of the surface energy Ẽ = E/γr2 as a function of ![[d with combining tilde]](https://www.rsc.org/images/entities/i_char_0064_0303.gif) for columns (solid lines) and drops (dashed lines) for Ṽ = 8000, 5000 and 2000. Ẽcol changes sign at for columns (solid lines) and drops (dashed lines) for Ṽ = 8000, 5000 and 2000. Ẽcol changes sign at ![[d with combining tilde]](https://www.rsc.org/images/entities/i_char_0064_0303.gif) = π/2 − 1 ≃ 0.57 where the curvature of the free surface is inverted. (b) Morphology diagram in the parameter space ( = π/2 − 1 ≃ 0.57 where the curvature of the free surface is inverted. (b) Morphology diagram in the parameter space (![[d with combining tilde]](https://www.rsc.org/images/entities/i_char_0064_0303.gif) ,Ṽ) obtained numerically by modeling the drop as a sphere (dotted line) and as a half of a sphere (solid line). The curves represents the boundary at which Ẽdrop = Ẽcol. ,Ṽ) obtained numerically by modeling the drop as a sphere (dotted line) and as a half of a sphere (solid line). The curves represents the boundary at which Ẽdrop = Ẽcol. | ||
For each volume we find the value of ![[d with combining tilde]](https://www.rsc.org/images/entities/i_char_0064_0303.gif) at which Ẽdrop = Ẽcol and plot the curve in Fig. 5b. This diagram highlights two regions that have the same qualitative features seen in our experiments. Above the curve, Ẽdrop < Ẽcol, which indicates that the drop is the most stable state. We observe the same features observed in the experimental morphology diagram (Fig. 4). There is a minimum volume below which the drop-to-column transition occurs at
at which Ẽdrop = Ẽcol and plot the curve in Fig. 5b. This diagram highlights two regions that have the same qualitative features seen in our experiments. Above the curve, Ẽdrop < Ẽcol, which indicates that the drop is the most stable state. We observe the same features observed in the experimental morphology diagram (Fig. 4). There is a minimum volume below which the drop-to-column transition occurs at  . Above this volume, the region of stability of a drop increases with increasing volume. However, since the experimental drop shape is not a sphere, we expect the analytical values for the boundary predicted by our analytical model to not match the experimental data. A better quantitative agreement can be obtained by considering a portion of a sphere to approximate the actual drop morphology (see Fig. 1b).
The experiments show that there are two distinct values of d at which a transition occurs. As d is decreased, we measure the value at which we observe the last drop and the first column; we take ddc, the drop-to-column transition, as the average between these two values. Similarly, as d is increased, we measure dcd for the column-to-drop transition. We measure these critical distances ddc and dcd for different volumes and fiber radii (see Fig. 6). The data for various fibers and liquids collapse on the same two curves. Below Ṽ ≈ 700, we see that  corresponds to the smooth transition reported previously. For Ṽ > 700,
 ![[d with combining tilde]](https://www.rsc.org/images/entities/i_char_0064_0303.gif) cd is independent of the volume and remains slightly below
cd is independent of the volume and remains slightly below  .
. ![[d with combining tilde]](https://www.rsc.org/images/entities/i_char_0064_0303.gif) dc decreases with increasing volume. Thus the interval between
dc decreases with increasing volume. Thus the interval between ![[d with combining tilde]](https://www.rsc.org/images/entities/i_char_0064_0303.gif) dc and
dc and ![[d with combining tilde]](https://www.rsc.org/images/entities/i_char_0064_0303.gif) cd also increases, i.e. the hysteretic loop widens.
cd also increases, i.e. the hysteretic loop widens.
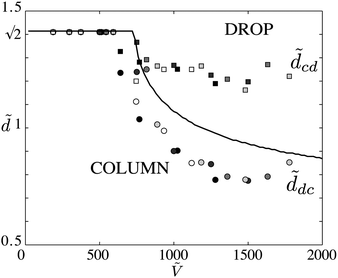 | ||
Fig. 6 (a) Critical distance ![[d with combining tilde]](https://www.rsc.org/images/entities/i_char_0064_0303.gif) dc at which the drop-to-column transition (circles) is observed when d is decreased and dc at which the drop-to-column transition (circles) is observed when d is decreased and ![[d with combining tilde]](https://www.rsc.org/images/entities/i_char_0064_0303.gif) cd (squares) the column-to-drop transition when d is increased as a function of Ṽ = V/r3, for glass fibers 2r = 0.2 mm (black) and nylon fibers 2r = 0.2, 0.245, 0.3, 0.35 mm (gray). The hysteresis becomes larger as the drop volume is increased. Line: absolute stability criterion eqn (6) and (7). cd (squares) the column-to-drop transition when d is increased as a function of Ṽ = V/r3, for glass fibers 2r = 0.2 mm (black) and nylon fibers 2r = 0.2, 0.245, 0.3, 0.35 mm (gray). The hysteresis becomes larger as the drop volume is increased. Line: absolute stability criterion eqn (6) and (7). | ||
We plot the numerical model for a value close to a half-sphere (0.6Ẽdrop) and observe that the minimum volume is Ṽ = 720, which is close to the value found experimentally, and the predicted boundary is close to the drop-to-column transition curve ![[d with combining tilde]](https://www.rsc.org/images/entities/i_char_0064_0303.gif) dc. Above this boundary, a finite volume of liquid deposited at fixed d > ddc takes a drop shape, indicating that it is indeed the most stable state. However, starting as a column, as we increase d, the liquid remains as a column until d = dcd, where perturbations force the transition to a drop. The column shape is therefore metastable close to the transition. We note that the difference between Ẽdrop and Ẽcol remains small in the neighborhood of the transition. Even though our simple model does not capture this hysteretic behavior, we do not believe that pinning of the contact line or elastic effects play a role since dcd is constant for many different fiber–liquid systems. The observed coexistence of both drops and columns is a consequence of this hysteretic behavior.
dc. Above this boundary, a finite volume of liquid deposited at fixed d > ddc takes a drop shape, indicating that it is indeed the most stable state. However, starting as a column, as we increase d, the liquid remains as a column until d = dcd, where perturbations force the transition to a drop. The column shape is therefore metastable close to the transition. We note that the difference between Ẽdrop and Ẽcol remains small in the neighborhood of the transition. Even though our simple model does not capture this hysteretic behavior, we do not believe that pinning of the contact line or elastic effects play a role since dcd is constant for many different fiber–liquid systems. The observed coexistence of both drops and columns is a consequence of this hysteretic behavior.
5 Conclusions
We have shown that the morphological transition of a liquid placed between two fibers depends on both the global geometry of the system and the volume of liquid. This transition becomes more hysteretic as the liquid volume is increased. For the column shape, there is an exact analytical solution15 that we validate with our experiments.Other systems with liquid morphological changes have been studied. For example, Gau et al.18 formed liquid channels on hydrophilic stripes and, depending on contact angle, observed the transition from uniform channels to channels with bulges. Also, Seemann et al.19 considered the different morphologies taken by a finite amount of liquid on a groove, which depended on the contact angle and the groove geometry. The liquid can adopt different shapes as the contact angle decreases: a drop-like morphology, where the drop is not confined to the groove, or an extended filament of homogeneous cross-section confined to the groove. One can switch from one morphology to the other by changing the contact angle, e.g. with electrowetting,20 or by mechanically changing the groove geometry, e.g. using a deformable material.21 Our results suggest that a system of parallel fibers can be used to reshape and displace liquid at a small scale, e.g. by mechanically changing the distance between the fibers or by triggering changes in volume (condensation/evaporation). For example, one could attach the fibers on a soft material, which can be stretched to tune the inter-fiber distances, and so simply control the wetted portion of the substrate or the area of the liquid–air interface.
Acknowledgements
We thank Unilever Research and the National Science Foundation (CBET-1132835) for support of this research and we thank P. Warren for helpful conversations. S. P. acknowledges financial support from the Paris Emergence research program.References
- A. Patnaik, R. S. Rengasamy, V. K. Kothari and A. Ghosh, Text. Prog., 2010, 38, 1–105 Search PubMed.
- P. Contal, J. Simao, D. Thomas, T. Frising and S. Callã, J. Aerosol Sci., 2004, 35, 263–278 Search PubMed.
- C. Duprat, S. Protière, A. Y. Beebe and H. A. Stone, Nature, 2012, 482, 510–513 CrossRef CAS.
- A. M. Rijke and W. A. Jesser, Wilson Journal of Ornithology, 2010, 122, 563–568 Search PubMed.
- B. Carroll, J. Colloid Interface Sci., 1976, 57, 488–495 CrossRef CAS.
- B. Carroll, Langmuir, 1986, 2, 248–250 CrossRef CAS.
- G. McHale, M. I. Newton and B. J. Carroll, Oil Gas Sci. Technol., 2001, 56, 47–54 CrossRef.
- H. B. Eral, J. de Ruiter, R. de Ruiter, J. M. Oh, C. Semprebon, M. Brinkmann and F. Mugele, Soft Matter, 2011, 7, 5138 RSC.
- T.-H. Chou, S.-J. Hong, Y.-E. Liang, H.-K. Tsao and Y.-J. Sheng, Langmuir, 2011, 27, 3685–3692 Search PubMed.
- E. Lorenceau and D. Quéré, J. Fluid Mech., 2004, 510, 29–45 Search PubMed.
- T. Gilet, D. Terwagne and N. Vandewalle, Appl. Phys. Lett., 2009, 95, 014106 CrossRef.
- F. W. Minor, A. M. Schwartz, E. A. Wulkow and L. C. Buckles, Text. Res. J., 1959, 29, 940–949 Search PubMed.
- B. Miller, A. B. Coe and P. N. Ramachandran, Text. Res. J., 1967, 37, 919–924 Search PubMed.
- K. Keis, K. G. Kornev, Y. K. Kamath and A. V. Neimark, Nanoengineered Nanofibrous Materials, Kluwer Academic Publishers, Dordrecht, NATO Science edn, 2004, pp. 173–180 Search PubMed.
- H. Princen, J. Colloid Interface Sci., 1970, 34, 171–184 Search PubMed.
- D. Lukas, J. Chaloupek, E. Kostakova, N. Pan and I. Martinkova, Phys. A, 2006, 371, 226–248 Search PubMed.
- X.-F. Wu, A. Bedarkar and K. A. Vaynberg, J. Colloid Interface Sci., 2010, 341, 326–332 Search PubMed.
- H. Gau, S. Herminghaus, P. Lenz and R. Lipowsky, Science, 1999, 283, 46–49 CrossRef CAS.
- R. Seemann, M. Brinkmann, E. J. Kramer, F. F. Lange and R. Lipowsky, Proc. Natl. Acad. Sci. U. S. A., 2005, 102, 1848–1852 CrossRef CAS.
- K. Khare, S. Herminghaus, J.-C. Baret, B. M. Law, M. Brinkmann and R. Seemann, Langmuir, 2007, 23, 12997–13006 CrossRef CAS.
- T. Ohzono and H. Monobe, Langmuir, 2010, 26, 6127–6132 CrossRef CAS.
Footnote |
| † These authors contributed equally to this work. |
| This journal is © The Royal Society of Chemistry 2013 |
