One-step preparation of nitrogen-doped graphene quantum dots from oxidized debris of graphene oxide†
Chaofan
Hu
a,
Yingliang
Liu
*b,
Yunhua
Yang
a,
Jianghu
Cui
a,
Zirong
Huang
a,
Yaling
Wang
a,
Lufeng
Yang
a,
Haibo
Wang
a,
Yong
Xiao
b and
Jianhua
Rong
*c
aDepartment of Chemistry, Jinan University, Guangzhou 510632, China
bCollege of Science, South China Agricultural University, Guangzhou 510642, China. E-mail: tliuyl@163.com; Fax: + 86 20 85221813; Tel: + 86 20 85280323
cDepartment of Material Science and Engineering, Jinan University, Guangzhou 510632, P.R. China. E-mail: trong@jnu.edu.cn; Tel: + 86 20 85222860
First published on 31st October 2012
Abstract
Highly blue-luminescent nitrogen-doped graphene quantum dots (N-GQDs) are obtained by hydrothermal treatment of graphene oxide in the presence of ammonia. The yield of N-GQDs is about 8.7% in weight. A high quantum yield of maximum 24.6% at an excitation wavelength of 340 nm is achieved. They are applied for bioimaging of HeLa cells, and showed bright luminescence and excellent biocompatibility.
Semiconductor quantum dots have been used in biomedical research for imaging, diagnostics and sensing purposes. However, concerns over the cytotoxicity of their heavy metal constituents and conflicting results from in vitro and animal toxicity studies have limited their transition towards clinical applications.1 Graphene quantum dots (GQDs) are emerging as promising optical materials for biological applications, owing to their unique properties, such as excellent biocompatibility in physiological conditions, resistance to photo-bleaching and ease of bioconjugation. The primary approaches for synthesizing GQDs can be generally classified into two main groups: bottom-up and top-down methods,2 wherein the former is limited by severe synthetic conditions and time-consuming processes. Top-down approaches refer to the cutting of graphene sheets into GQDs; the method consists of chemical ablation,3–5 electrochemical oxidation,6,7 and oxygen plasma treatment,8 where GQDs are formed from larger graphene sheets. However, this approach may be limited by low quantum yields and product yield, and the use of an organic solvent and strong acid/alkali/oxidant. Thus, the facile aqueous synthetic route to produce high-quality GQDs in large scale is still imminently needed.
Rourke's group has demonstrated the existence of small, highly oxidized debris (OD) on the surface of graphene oxide (GO), which is strong adhered to the surface of GO and can be easily removed from the GO sheets under alkaline conditions.9 Lu and He recently reported the extraction of OD with small size and a typical height of 0.5–1 nm can also be achieved solely in the presence of ammonia.10 The discovery of OD paves a new way to revisit the structure and properties of GO. The highly oxidized level and the small size and height of OD are similar to that of GQDs. However, the structure and the photoluminescence properties of OD have not been well studied so far. Little work has been done on the optical properties of OD, which are directly associated with quantum confinement and edge effects. The distinct difference between OD and GQDs is the crystallinity; the former is considered as amorphous while the latter has been demonstrated to be highly crystalline. Therefore, take advantage of its high product yields (about 30% in weight)9 and ease of extraction, OD will be an excellent candidate for preparation of GQDs in small scale, if the amorphous to crystalline transformation can be realized by a synthetic route.
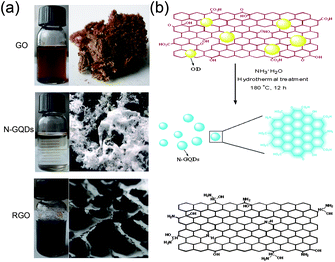
Due to their extraordinary physical and chemical properties, nitrogen (N)-doped carbon materials have been extensively applied in various fields, such as electrochemical biosensing,11 electrocatalysis,12 supercapacitors,13 and hydrogen storage.14 In our previous work, highly amino-functionalized fluorescent carbon nanoparticles were fabricated by hydrothermal carbonization of chitosan at a mild temperature.15 Herein, a facile one step route to extract blue luminescent N-doped GQDs (N-GQDs) from GO is demonstrated by a hydrothermal process, solely in the presence of ammonia. As shown in Fig. 1a, after being separated from the black aggregates (chemically reduced GO, RGO), the slightly yellow supernatant was freeze-dried to give a slightly yellow powder (N-GQDs). The synthetic procedure for extraction of OD and preparation of N-GQDs by a facile one step hydrothermal treatment of GO is illustrated in Fig. 1b; for more details see the experimental section in the ESI.† Our method presents a relatively simple and low cost approach to produce N-GQDs. A characteristic feature of this method is that neither a strong acid solvent nor a surface passivation reagent is needed. The synthetic process occurs in aqueous solution and has the advantage of being very cheap. The yield of the N-GQDs is about 8.7% in weight, which is higher than the previously reported GQDs derived from GO.3,16
 | ||
| Fig. 1 (a) Typical pictures of water dispersions and solid samples of GO, N-GQDs and RGO. (b) Schematic illustration for the preparation of N-GQDs by hydrothermal treatment of GO in the presence of ammonia. | ||
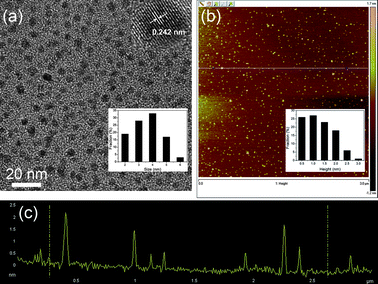
Fig. 2a shows a transmission electron microscope (TEM) image of the N-GQDs, exhibiting a relatively narrow size distribution between 2 and 6 nm with an average diameter of 3.5 nm. The high resolution TEM (HRTEM) image (inset of Fig. 2a) indicates the high crystallinity of the N-GQDs, with a lattice parameter of 0.242 nm, (1120) lattice fringes of graphene,17 revealing the transformation of amorphous OD to highly crystalline N-GQDs after hydrothermal treatment in the presence of ammonia. It has been reported that graphene with zigzag edges offers extraordinary electronic or magnetic properties.18,19 The photoluminescence (PL) mechanism of GQDs is attributed to the synergic effects of both zigzag sites and surface defects.20 Fig. S2† shows HRTEM images and the corresponding fast Fourier transform (FFT) pattern of the N-GQDs. The N-GQD edges seem to be predominantly parallel to the zigzag orientation. The N-GQDs emit strong luminescence, most likely because there is a high concentration of zigzag sites on the edges.3 The atomic force microscopy (AFM) image demonstrates the topographic morphology of the N-GQDs, the heights of which are mainly distributed in the range of 0.5–3 nm with an average height of 1.3 nm, suggesting that the most of the N-GQDs have 1–3 graphene layers (Fig. 2b and c).
 | ||
| Fig. 2 (a) TEM image of N-GQDs. Inset of (a): HRTEM image and size distribution of N-GQDs (inset). (b) AFM image of N-GQDs, inset image is height distribution of GQDs. (c) Height profile of N-GQDs corresponding to the AFM image. | ||
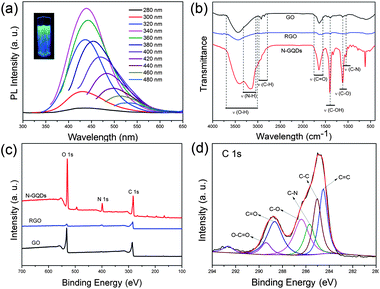
To explore the optical properties of the N-GQDs, we carried out a detailed PL study by using different excitation wavelengths. Fig. 3a shows the normal PL spectra of the N-GQDs. The emission peaks of the N-GQDs shift with varying excitation, exhibiting excitation-dependent PL behaviour. The N-GQDs emitted intense blue luminescence under irradiation by a 365 nm UV lamp (Fig. 3a, inset). The strongest emission peak is located at 436 nm when excited at 340 nm, which is consistent with previously reported N-GQDs.12 The photoluminescence excitation (PLE) spectra of the blue N-GQDs (λem = 436 nm) as well as the PL spectra are shown in Fig. S3.† The PL quantum yield (QY) of the GQDs was as high as 24.6% when excited at 340 nm (Table S1†), much higher than most of the GQDs reported so far.7,16 The N-GQDs showed excellent photostability as the fluorescence intensity did not change even after continuous excitation under a Xe lamp for 12 hours (Fig. S4†). The PL intensity of the N-GQDs increased when the pH value was switched to 13, and decreased remarkably when the pH was switched to 1, consistent with the GQDs reported by Pan et al.3 In addition, the emission peak shows a slightly blue shift with the increase in pH value, revealing it is pH-dependent, which is different with the previously reported N-free GQDs (Fig. S5†).4 Fig. S6† shows the temperature-dependent PL emission spectra of N-GQD aqueous solution recorded in the temperature range of 293 to 363 K (λex = 340 nm). The PL intensity of the N-GQDs decreases as the temperature increases, revealing the thermal fluorescence quenching properties of the N-GQDs. For the UV-visible absorption spectra, the N-GQDs show relatively weak absorption compared with GO and RGO over the entire spectral region (>220 nm) and a characteristic absorption band at 320–360 nm is observed (Fig. S7†).
 | ||
| Fig. 3 (a) PL spectra of N-GQD aqueous solution at different excitation wavelengths (280–480 nm) and photograph of the sample excited by a 365 nm UV lamp (inset). (b) FTIR spectra of the GO, RGO and N-GQDs. (c) Survey XPS spectra of GO, RGO and N-GQDs. (d) High resolution C 1s spectrum of the N-GQDs. | ||
Fig. 3b shows the Fourier transform infrared (FTIR) results of GO, RGO and N-GQDs. The FTIR spectrum of pristine GO demonstrates the presence of C–O (νC–O at 1097 cm−1), C–OH (νC–OH at 1384 cm−1), C![[double bond, length as m-dash]](https://www.rsc.org/images/entities/char_e001.gif) O in carboxylic acid and carbonyl moieties (νC
O in carboxylic acid and carbonyl moieties (νC![[double bond, length as m-dash]](https://www.rsc.org/images/entities/char_e001.gif) O at 1635 and 1726 cm−1) and the H-bonded associated OH (broad band around 3410 cm−1).21 After hydrothermal treatment in the presence of ammonia, the band at 1384, 1630 and 1726 cm−1 almost disappears while the band at 3410 cm−1 decays significantly in the FTIR spectrum of RGO, indicating the dehydration and reduction of O–H and C
O at 1635 and 1726 cm−1) and the H-bonded associated OH (broad band around 3410 cm−1).21 After hydrothermal treatment in the presence of ammonia, the band at 1384, 1630 and 1726 cm−1 almost disappears while the band at 3410 cm−1 decays significantly in the FTIR spectrum of RGO, indicating the dehydration and reduction of O–H and C![[double bond, length as m-dash]](https://www.rsc.org/images/entities/char_e001.gif) O groups. The FTIR spectrum of the N-GQDs shows stronger absorption bands of oxygen-related groups than GO, consistent with the results of OD reported by Rourke et al.9 New peaks at 1020 and 3200 cm−1 are assigned to the C–N in-plane and N–H in-plane stretching of amine groups,13 indicating the successful introduction of nitrogen in the N-GQDs. X-ray photoelectron spectroscopy (XPS) measurements were performed to determine the composition of the as-produced N-GQDs. The XPS survey spectra of the GO, RGO and N-GQDs show a predominant graphitic C 1s peak at about 284 eV and an O 1s peak at about 532 eV (Fig. 3c). The O/C atomic ratios for GO, RGO and N-GQDs are 39.22%, 12.09% and 66.23%, demonstrating that the N-GQDs have a relatively higher oxidation level than GO and RGO (Table S2†). A pronounced N 1s peak was observed for the resultant N-GQDs, whereas no N signal was detected on the GO and a weak signal on RGO (Fig. 3c). This confirmed the successful incorporation of N atoms into the N-GQDs by hydrothermal treatment of GO in the presence of ammonia. The N/C atomic ratio was calculated to be 17.88% (Table S2†), which is remarkable higher than the N-GQDs reported previously.12 The high-resolution N 1s spectrum of the N-GQDs (Fig. S8†) reveals the presence of both pyridine-like (397.8 eV) and pyrrolic (399.4 eV) N atoms.12 In addition to the C–N bond (285.2 eV), the high-resolution C 1s spectrum of the N-GQDs (Fig. 3c) further confirmed the presence of O-rich groups, such as C–O (286.5 eV), C
O groups. The FTIR spectrum of the N-GQDs shows stronger absorption bands of oxygen-related groups than GO, consistent with the results of OD reported by Rourke et al.9 New peaks at 1020 and 3200 cm−1 are assigned to the C–N in-plane and N–H in-plane stretching of amine groups,13 indicating the successful introduction of nitrogen in the N-GQDs. X-ray photoelectron spectroscopy (XPS) measurements were performed to determine the composition of the as-produced N-GQDs. The XPS survey spectra of the GO, RGO and N-GQDs show a predominant graphitic C 1s peak at about 284 eV and an O 1s peak at about 532 eV (Fig. 3c). The O/C atomic ratios for GO, RGO and N-GQDs are 39.22%, 12.09% and 66.23%, demonstrating that the N-GQDs have a relatively higher oxidation level than GO and RGO (Table S2†). A pronounced N 1s peak was observed for the resultant N-GQDs, whereas no N signal was detected on the GO and a weak signal on RGO (Fig. 3c). This confirmed the successful incorporation of N atoms into the N-GQDs by hydrothermal treatment of GO in the presence of ammonia. The N/C atomic ratio was calculated to be 17.88% (Table S2†), which is remarkable higher than the N-GQDs reported previously.12 The high-resolution N 1s spectrum of the N-GQDs (Fig. S8†) reveals the presence of both pyridine-like (397.8 eV) and pyrrolic (399.4 eV) N atoms.12 In addition to the C–N bond (285.2 eV), the high-resolution C 1s spectrum of the N-GQDs (Fig. 3c) further confirmed the presence of O-rich groups, such as C–O (286.5 eV), C![[double bond, length as m-dash]](https://www.rsc.org/images/entities/char_e001.gif) O (288.5 eV) and O–C
O (288.5 eV) and O–C![[double bond, length as m-dash]](https://www.rsc.org/images/entities/char_e001.gif) O (289.3),12 which is consistent with the corresponding FTIR spectra. Fig. S9† shows the X-ray diffraction (XRD) patterns of the GO, RGO and N-GQD dried powders. The XRD results for GO, RGO and N-GQDs exhibit a (002) signal centered at around 10.4°, 24.5° and 22.6°, corresponding to 0.852, 0.363 and 0.393 nm interlayer spacings. The N-GQDs show a broader (002) peak, which is attributed to disordered stacking of N-GQDs and the introduction of more active sites along the edges of the GQDs in the hydrothermal process.6 Raman spectrum also provided convincing evidence for the graphene structure of the N-GQDs (Fig. S10†). The peaks centered at 1321 and 1562 cm−1 are attributed to the D and G bands, which are related to the sp2-bonded C atoms and disordered C atoms at the edges of the N-GQDs, respectively. It was observed that the N-GQDs have an ID/IG ratio of 0.74, lower than that of GO (0.90) and RGO (1.06), which may result from the oxygen-rich edges of the N-GQDs. The N-GQDs exhibit a broader D and G band, suggesting that the intercalation of N atoms into the conjugated carbon backbone has led to somewhat disordered structures.12 In addition, a blue shift of the D and G band of the N-GQDs compared with GO and RGO is observed, which is consistent with the results reported previously.17
O (289.3),12 which is consistent with the corresponding FTIR spectra. Fig. S9† shows the X-ray diffraction (XRD) patterns of the GO, RGO and N-GQD dried powders. The XRD results for GO, RGO and N-GQDs exhibit a (002) signal centered at around 10.4°, 24.5° and 22.6°, corresponding to 0.852, 0.363 and 0.393 nm interlayer spacings. The N-GQDs show a broader (002) peak, which is attributed to disordered stacking of N-GQDs and the introduction of more active sites along the edges of the GQDs in the hydrothermal process.6 Raman spectrum also provided convincing evidence for the graphene structure of the N-GQDs (Fig. S10†). The peaks centered at 1321 and 1562 cm−1 are attributed to the D and G bands, which are related to the sp2-bonded C atoms and disordered C atoms at the edges of the N-GQDs, respectively. It was observed that the N-GQDs have an ID/IG ratio of 0.74, lower than that of GO (0.90) and RGO (1.06), which may result from the oxygen-rich edges of the N-GQDs. The N-GQDs exhibit a broader D and G band, suggesting that the intercalation of N atoms into the conjugated carbon backbone has led to somewhat disordered structures.12 In addition, a blue shift of the D and G band of the N-GQDs compared with GO and RGO is observed, which is consistent with the results reported previously.17
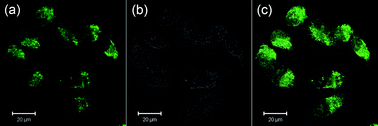
To assess the prospects of the N-GQDs as a bioimaging material, HeLa cells were used to evaluate the cytotoxicity of the N-GQDs. The MTT assays of cell viability studies suggested that the N-GQDs do not impose a considerable toxicity to HeLa cells compared to the control (Fig. S11†). The N-GQDs were introduced into the HeLa cells to show their bioimaging using confocal microscopy. As shown in Fig. 4, bright green luminescence is observed inside the cells, indicating that the N-GQDs have been internalized by the HeLa cells and are mainly localized in the cytoplasm region and could be used as efficient bioimaging probes.
 | ||
| Fig. 4 (a) Confocal fluorescence microphotograph of HeLa cells incubated with N-GQDs for 2 h (λex = 405 nm). (b) Bright-field microphotographs of cells. (c) An overlay image of (a) and (b). | ||
In conclusion, we have demonstrated that it is possible to synthesize N-GQDs from OD by hydrothermal treatment of GO at 180 °C in the presence of ammonia. No strong acid treatment or further surface modification is necessary in their preparation. The as-prepared N-GQDs are highly blue-luminescent and a maximum quantum yield of 24.6% was achieved at an excitation wavelength of 340 nm. This green, cheap and convenient process represents a potential advancement for large-scale production. Coupled with low cytotoxicity, and ease of labelling, the N-GQDs provide promising applications for biological imaging, disease diagnosis and biosensors.
Acknowledgements
This work was supported by the National Natural Science Foundation of China (Grant no.21031001, 20906037, 20604010, 51173070).References
- L. Ye, K. T. Yong, L. W. Liu, I. Roy, R. Hu, J. Zhu, H. X. Cai, W. C. Law, J. W. Liu, K. Wang, J. Liu, Y. Q. Liu, Y. Z. Hu, X. H. Zhang, M. T. Swihart and P. N. Prasad, Nat. Nanotechnol., 2012, 7, 453–458 CrossRef CAS.
- J. H. Shen, Y. H. Zhu, X. L. Yang and C. Z. Li, Chem. Commun., 2012, 48, 3686–3699 RSC.
- D. Y. Pan, J. C. Zhang, Z. Li and M. H. Wu, Adv. Mater., 2010, 22, 734–738 CrossRef CAS.
- D. Y. Pan, L. Guo, J. C. Zhang, C. Xi, Q. Xue, H. Huang, J. H. Li, Z. W. Zhang, W. J. Yu, Z. W. Chen, Z. Li and M. H. Wu, J. Mater. Chem., 2012, 22, 3314–3318 RSC.
- V. Gupta, N. Chaudhary, R. Srivastava, G. D. Sharma, R. Bhardwaj and S. Chand, J. Am. Chem. Soc., 2011, 133, 9960–9963 CrossRef CAS.
- Y. Li, Y. Hu, Y. Zhao, G. Q. Shi, L. E. Deng, Y. B. Hou and L. T. Qu, Adv. Mater., 2011, 23, 776–780 CrossRef CAS.
- M. Zhang, L. L. Bai, W. H. Shang, W. J. Xie, H. Ma, Y. Y. Fu, D. C. Fang, H. Sun, L. Z. Fan, M. Han, C. M. Liu and S. H. Yang, J. Mater. Chem., 2012, 22, 7461–7467 RSC.
- S. Neubeck, L. A. Ponomarenko, F. Freitag, A. J. M. Giesbers, U. Zeitler, S. V. Morozov, P. Blake, A. K. Geim and K. S. Novoselov, Small, 2010, 6, 1469–1473 CrossRef CAS.
- J. P. Rourke, P. A. Pandey, J. J. Moore, M. Bates, I. A. Kinloch, R. J. Young and N. R. Wilson, Angew. Chem., Int. Ed., 2011, 50, 3173–3177 CrossRef CAS.
- W. H. He and L. H. Lu, Adv. Funct. Mater., 2012, 22, 2542–2549 CrossRef CAS.
- K. J. Huang, D. J. Niu, X. Liu, Z. W. Wu, Y. Fan, Y. F. Chang and Y. Y. Wu, Electrochim. Acta, 2011, 56, 2947–2953 CrossRef CAS.
- Y. Li, Y. Zhao, H. H. Cheng, Y. Hu, G. Q. Shi, L. M. Dai and L. T. Qu, J. Am. Chem. Soc., 2012, 134, 15–18 CrossRef CAS.
- L. F. Lai, L. W. Chen, D. Zhan, L. Sun, J. P. Liu, S. H. Lim, C. K. Poh, Z. X. Shen and J. Y. Lin, Carbon, 2011, 49, 3250–3257 CrossRef CAS.
- V. B. Parambhath, R. Nagar and S. Ramaprabhu, Langmuir, 2012, 28, 7826–7833 CrossRef CAS.
- Y. H. Yang, J. H. Cui, M. T. Zheng, C. F. Hu, S. Z. Tan, Y. Xiao, Q. Yang and Y. L. Liu, Chem. Commun., 2012, 48, 380–382 RSC.
- S. J. Zhu, J. H. Zhang, C. Y. Qiao, S. J. Tang, Y. F. Li, W. J. Yuan, B. Li, L. Tian, F. Liu, R. Hu, H. N. Gao, H. T. Wei, H. Zhang, H. C. Sun and B. Yang, Chem. Commun., 2011, 47, 6858–6860 RSC.
- J. Peng, W. Gao, B. K. Gupta, Z. Liu, R. Romero-Aburto, L. H. Ge, L. Song, L. B. Alemany, X. B. Zhan, G. H. Gao, S. A. Vithayathil, B. A. Kaipparettu, A. A. Marti, T. Hayashi, J. J. Zhu and P. M. Ajayan, Nano Lett., 2012, 12, 844–849 CrossRef CAS.
- P. Potasz, A. D. Guclu, A. Wojs and P. Hawrylak, Phys. Rev. B: Condens. Matter Mater. Phys., 2012, 85, 075431 CrossRef.
- L. R. Radovic and B. Bockrath, J. Am. Chem. Soc., 2005, 127, 5917–5927 CrossRef CAS.
- S. J. Zhu, S. J. Tang, J. H. Zhang and B. Yang, Chem. Commun., 2012, 48, 4527–4539 RSC.
- Y. Si and E. T. Samulski, Nano Lett., 2008, 8, 1679–1682 CrossRef CAS.
Footnote |
| † Electronic supplementary information (ESI) available: Experimental details and supplementary data. See DOI: 10.1039/c2tb00189f |
| This journal is © The Royal Society of Chemistry 2013 |
