Hybrid mesostructured electrodes for fast-switching proton-based solid state electrochromic devices
Basila
Kattouf
,
Yair
Ein-Eli
,
Arnon
Siegmann
and
Gitti L.
Frey
*
Department of Materials Science and Engineering, Technion – Israel Institute of Technology, Haifa 32000, Israel
First published on 15th October 2012
Abstract
Tungsten oxide, the most commonly used electrochromic material, reversibly changes its color from transparent to blue under applied bias. The rate of color modulation, a parameter critical for device applications, is determined by the rate of cation injection into WO3 and its diffusion inside the solid. Here we show that fast switching could be obtained by processing mesostructured hybrid electrochromic electrodes with high organic–inorganic interfacial area and intimate contact between an organic electrolyte and WO3. The hybrid electrode is prepared by infiltrating a polymer electrolyte, Nafion, into a highly porous sol–gel processed WO3 matrix. Energy filtered-transmission electron microscopy is used to map the distribution of Nafion in the micro- and nano-sized pores. The images corroborate the formation of a continuous Nafion network through the inorganic scaffold and high WO3–Nafion interfacial area, for proton conductivity and proton transfer, respectively. The use of a polymer electrolyte, in contrast to commonly used liquid electrolytes, allows integration of the hybrid electrode into fully solid state devices. The device shows dramatically reduced response times compared to the corresponding bi-layer WO3–Nafion electrodes, associated with the mesostructured morphology of the solid hybrid electrode.
Introduction
Electrochromic (EC) devices are seminal for a variety of environment-conservation and energy-saving applications such as smart windows and sunroofs, displays and sensors.1–4 Both organic5–8 and inorganic9–15 materials have been suggested to be active components in EC devices, however, inorganics show several advantages compared to organic-based devices, mainly high thermal, mechanical and UV stability, resulting in improved device longevity. The operation of inorganic EC devices is based on the simultaneous injection of electrons and cations, such as H+, Li+ or Na+, into a host material, usually a multivalent transition metal oxide. When a suitable bias is applied, electrons are injected into the EC metal oxide material and the transition metal atoms are reduced. Simultaneously, cations intercalate into the EC material from the electrolyte to compensate the excess negative charge induced by the injected electrons. This process is generally termed coloration, because the EC film loses its transparency in the visible region as a function of charge, cation and electron insertion. The EC process is reversible and the material reverts back to transparency, bleaching, by reversing the polarity of the applied bias upon which the electrons and cations are extracted from the EC metal oxide.Among the EC metal oxides, tungsten trioxide, WO3, is of particular interest because it shows high optical contrast and stability through a large number of coloration/bleaching cycles.16–19 WO3 coatings have been mostly prepared by vacuum techniques, such as sputtering20–24 and vacuum evaporation25 allowing control of material stoichiometry.26,27 However, devices fabricated using vacuum-deposited WO3 films suffer from relatively slow EC switching response times associated with the high density of such films. The high density limits the interfacial area between the active metal oxide particles and the cation-supplying electrolyte, effectively suppressing the supply of cations to the metal oxide. Therefore, response times of EC devices comprising vacuum deposited WO3 films are on the order of a minute or even longer.28,29 The slow response time reduces the technological interest in WO3 for displays as well as other applications where fast switching is mandatory.
Increasing WO3–electrolyte interfacial area by introducing mesoporosity into a WO3 EC film is expected to enhance the coloration and bleaching kinetics of the device and, hence, the response time. In general, mesoporous WO3 films are prepared by sol–gel templating strategies,30 where a WO3-precursor species is mixed with a sacrificial organic surfactant that can later be easily removed, leaving open pores in the WO3 film. The porous WO3 films can then be soaked in a H+-based or Li+-based liquid electrolyte allowing it to penetrate into the WO3 pores to obtain a high WO3–electrolyte interfacial area for improved cation transfer. Indeed, Zink and co-workers have demonstrated improved response times in porous WO3 EC films compared to dense films prepared under similar conditions.31 The WO3 electrodes were prepared from sol–gel solutions including a commercially available surfactant, and tested in a solution-based device with sulfuric acid as the liquid electrolyte. Furthermore, Smarsly et al. have shown that highly ordered 3D mesoporosity facilitates ion intercalation into the WO3 network, leading to shorter response times of Li+ liquid electrolyte-based devices, compared to WO3 dense films.32 This 3D-mesoporosity was achieved using the evaporation-induced self-assembly method and judiciously synthesized block co-polymer surfactants. Porosity in a WO3 film could also be achieved by agglomerating nanoparticles into the film, as demonstrated by Dillon et al., where the high surface area of the nanoparticles provided high WO3 interfacial area with a proton-based liquid electrolyte, and hence improved kinetics.33
While the combination of mesoporous WO3 films with liquid electrolytes has showed enhanced switching speeds due to the high interfacial area for cation transfer, full solid-state devices fabricated from porous EC materials have yet to be demonstrated, probably due to the difficulty in introducing solid electrolytes into the nanometer-sized pores of WO3. Furthermore, the rate of cation motion in the solid electrolyte could also limit the performance of the EC device. Hence, in a fully solid state device the rate-determining processes are: (i) cation motion in the electrolyte and in the EC material, and (ii) cation transfer across the WO3–solid-electrolyte interface. Herein, we describe the design, processing and integration of a hybrid mesostructured EC electrode in an all-solid-state device. The electrode reported here is composed of WO3 as the EC material, and the well-known proton conductor polymer, Nafion, as the electrolyte, combined in a mesostructured morphology that allows a high interfacial area between the WO3 and Nafion. This mesostructured electrode was then incorporated into a proton based EC device and switching response times were measured and compared to a reference system with a bi-layer device architecture of dense WO3 and Nafion.
Experimental
Materials
The WO3 precursor, WCl6, was purchased from Sigma-Aldrich, stored under nitrogen environment and used as received. The commercially available tri-block copolymer Pluronic P123 HO(CH2CH2O)20(CH2CH(CH3)O)70(CH2CH2O)20H (Mw = 5750 g mol−1) surfactant was purchased from BASF and used as received. Concentrated (20 wt%) and diluted (5 wt%) Nafion solutions in alcoholic solvents were purchased from Ion Power Inc. and Sigma-Aldrich, respectively. Absolute ethanol was used as a solvent for WCl6 and P123 components.Substrates used for the working electrode film were conductive, transparent ITO coated glass slides, 12.5 × 25 mm (15–25 Ohm sheet resistance, Sigma-Aldrich). The counter electrode was a Pt foil, 12 × 20 × 0.5 mm. The reference electrode was a saturated calomel electrode (SCE). The electrolyte used for the electrochemical experiments was an aqueous sulfuric acid (H2SO4) solution (0.01 M, pH = 2).
Synthesis, film preparation and device fabrication
Amorphous and transparent WO3 porous and dense films were prepared via the sol–gel method and dip-coating technique. The coating solution was composed of 0.98 g WCl6 dissolved in 11 ml of absolute ethanol during vigorous stirring, leading to an exothermic alcoholysis reaction. For the porous film, 0.25 g of the tri-block copolymer Pluronic P123 was also dissolved in the precursor solution. After several minutes, the solutions became blue as small fractions of W+6 were reduced to W+5.34 After vigorous stirring for 2 hours, a blue clear solution was obtained. Films were deposited by dip-coating on ITO-coated glass or silicon substrates (cleaned in acetone, methanol and iso-propanol prior to dip-coating) at room temperature, relative humidity of ∼50%, and a withdraw speed of 10 mm s−1. The as-deposited films were left in air for one hour to allow solvent evaporation, and then moved to a furnace for calcination under ambient conditions at 300 °C for 2 hours, at a heating rate of 0.5 °C min−1. Calcination results in removal of the P123 copolymer leaving porous WO3 films. Calcined films, dense and porous, were uniform, transparent and in the thickness range of 300–400 nm.To infiltrate Nafion into the porous WO3 film, the film was dip-coated in a dilute alcoholic solution (5%) of Nafion in ambient conditions at a withdraw speed of 2 mm s−1, and left to dry overnight in air. As a proton reservoir for the EC device, a thick Nafion layer, ∼5 μm, was casted on top of the electrode from a viscous, concentrated solution (20%) of Nafion via dip-coating at a withdraw speed of 1 mm s−1, and the electrodes were then left in air overnight for drying. Prior to integration into the solid device the EC electrodes, dense WO3 and Nafion-infiltrated WO3, were subjected to a proton-charging process, i.e. one coloration wave in an acidic solution. Charging was performed in a sulfuric acid solution (pH = 2) in a standard three-electrode electrochemical cell. During charging, which occurred by applying a constant potential of −0.6 V vs. SCE for 10 minutes, protons from the acidic electrolyte solution were intercalated into the WO3 matrix effectively reducing some W+6 cations to W+5 accompanied by a noticeable blue coloration. After 10 minutes of charging, the EC electrodes were dried from liquid residues, and finally all-solid-state devices were fabricated by assembling another glass/ITO slide on the thick Nafion layers using two drops of the concentrated Nafion solution (20%) as glue.
Characterization
Electrochemical measurements were conducted using a potentiostat 273A (EG & G Princeton Applied Research), with a computer program PowerCV version 2.12.1 (Princeton Applied Research). Measurements were conducted in a custom-made electrochemical cell, which allows in situ optical characterization during applying potential in a liquid electrolyte environment in a standard three-electrode mode. In cyclic voltammetry (CV) mode, the potential between the working and reference electrodes was varied linearly between two given potential limits, at a linear rate while recording the current. The open circuit potential (OCP) of the three-electrode cell was ∼0.3–0.4 V vs. standard calomel reference electrode (SCE). The potential was swept linearly at a scan rate of 50 mV s−1 from OCP to −0.6 V, up to 1.1 V, and finally back to OCP.The switching response times of the EC electrode were measured by applying potentiostatic steps of 30 seconds each, i.e., holding the potential at a specific value for a time period of 30 seconds. For the liquid electrolyte systems, a potential of −0.6 V vs. SCE was applied for coloration and 1.1 V vs. SCE was applied for bleaching. For the solid electrolyte systems, bias of −2.5 V and +1 V were applied for coloration and bleaching, respectively. Both applied biases (cathodic and anodic) are considered as relatively high since the aim in these set of studies was to achieve an excessive degree of coloration and bleaching and to obtain the optical modulation, thus overcoming mass transport and cell internal resistance concerns.
SEM images of the sol–gel prepared WO3 films were acquired using a Zeiss Ultra Plus Gemini field emission gun with an acceleration voltage of 1 kV.
High resolution transmission electron microscopy (HRTEM) measurements and energy-filtered TEM (EFTEM) measurements were performed using a FEI Titan 80–300 keV S/TEM operating at 200 kV with filters set to fluorine K-edge (685 eV). Samples for EFTEM examination were thinned using a Focused Ion Beam (FIB) integrated in the Strata 400 STEM DualBeam system of a Field-Emission Scanning Electron Microscope (FE-SEM).
Optical transmission at a constant wavelength (632.8 nm) for the sol–gel prepared WO3 films/devices was conducted, in situ during applying bias, using a PerkinElmer Lambda 950 UV/VIS Spectrophotometer.
Results and discussions
WO3 EC electrodes were prepared using the sol–gel method and the dip-coating technique. During dip-coating, the solvent evaporates and induces the condensation of the hydrolyzed precursor, W(OH)6, into a solid WO3 film. The interaction of the ethylene oxide segments of P123 with the forming metal oxide framework suppresses the macro-phase separation of large organic domains from the inorganic film35 resulting in an inorganic film encapsulating organic polymer chains and domains. Thermal surfactant removal yields X-ray amorphous, highly porous WO3 films with a broad pore-size distribution ranging from 20 to 500 nm and continuity of the pores through the film down to the substrate, as shown in the plain view and cross-section scanning electron microscopy (SEM) images in Fig. 1a and b, respectively. The porous nature of the obtained film is in striking contrast with the dense morphology of WO3 films prepared under the exact same conditions, but with no surfactant in the coating solution, as shown in Fig. 1c. The highly dense films show no mesoporosity features, as confirmed in the cross-section image in Fig. 1d, but some micron-sized shrinkage cracks are formed during film formation and the thermal treatment.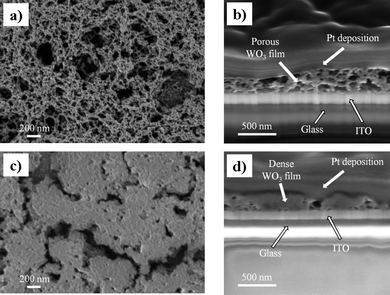 | ||
| Fig. 1 (a) A plain view SEM image of an as-prepared mesoporous WO3 film. The bright contrast represents the WO3 network while the dark contrast is the pores formed after surfactant removal. (b) A cross-section SEM image of the film shown in (a) showing the mesoporous morphology of the WO3 film with continuous porosity through the film toward the bottom ITO substrate. (c) A plain view SEM image of the as-prepared dense WO3 film showing no porosity features but some micron-sized shrinkage cracks. (d) A cross-section SEM image of the dense film in (c), showing a dense morphology with limited or no local porosity. | ||
To study the electrochromic performance of the porous and dense WO3 films, cyclic voltammetry (CV) measurements were conducted in sulfuric acid solutions. Fig. 2a and b present 150 consecutive cycles of the porous and dense WO3 films in H2SO4, respectively. The figures show an increase in the voltammogram area with the cycle number for both the porous and dense WO3 films, indicating that this increase is not associated with the film morphology. The increase in the voltammogram area represents an increase in charge capacity and is associated with a possible hydration process occurring in situ during the electrochemical cycling. As previously reported, when continuously cycling the electrode in acidic aqueous electrolytes, water hydronium ions intercalate into WO3 and form water spacious planes, which provide facile cation diffusion pathways into and out of the matrix.36 These pathways endow the material with increased charge-exchange quantities, i.e. charge capacity, as demonstrated by an increase in the voltammogram area.
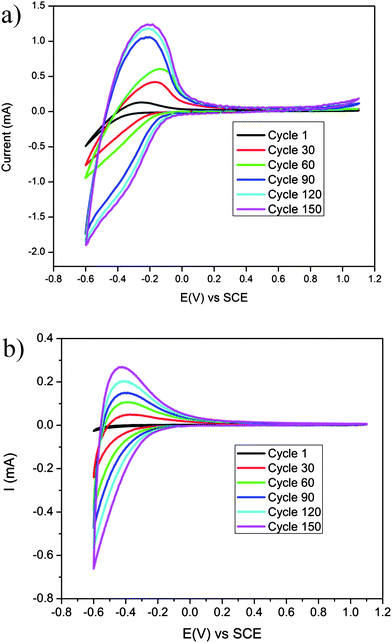 | ||
| Fig. 2 150 continuous CV cycles in a sulfuric acid solution (0.01 M) at a scan rate of 50 mV s−1 of (a) porous WO3 film and (b) dense WO3 film. | ||
Another indication of increasing WO3 hydration via electrochemical cycling in aqueous electrolytes is obtained by potentiostatic-mode measurements. In this method context, a cycle is defined as a single coloration step followed by a single bleaching step. Fig. 3a and b show the current response as a function of time at constant potential, during coloration steps for porous and dense WO3 films, respectively. The cathodic coloration current increases with the step number for both porous and dense WO3 films, confirming that the film conditioning process occurs upon cycling. The improved kinetics is well associated with the cycle-enhanced diffusion rate of protons in WO3 films due to the gradual hydration of WO3, as previously described.
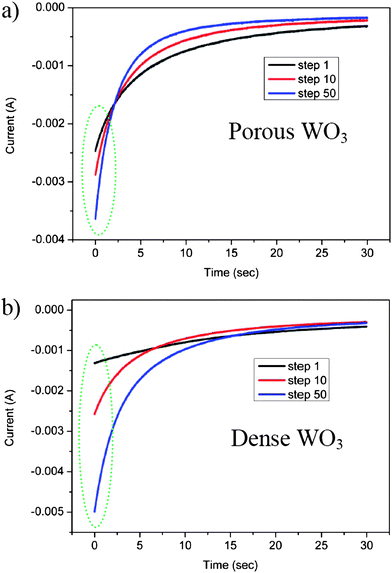 | ||
| Fig. 3 Potentiostatic cathodic waves at −0.6 V vs. SCE in a sulfuric acid electrolyte of (a) porous WO3 film and (b) dense WO3 film. | ||
Another characteristic that can be extracted from Fig. 3 is the initial current value which is found to depend on the morphology of the WO3 film. While the initial current response obtained from polarizing the porous WO3 film in the first cathodic wave is ∼2.5 mA (Fig. 3a), the initial current recorded by polarizing the counterpart dense WO3 film is ∼1.5 mA (Fig. 3b). This difference is associated with the high WO3–electrolyte interfacial area in the porous film, compared to that in the dense film. The significantly higher surface area of the porous film essentially exposes more intercalation sites, which support an increased rate of proton transfer across the interface in the first coloration step (black lines in Fig. 3a and b). Interestingly, in both samples the rate of current-decay in the potentiostatic-mode increases with the number of coloration steps, as evident from the cross-over of the three lines in each figure. Namely, after 50 potentiostatic-mode steps (blue lines in both figures) the current decays faster than that after 10 steps (red lines in both figures), which decays faster than that obtained after 1 step (black lines in both figures). This difference in the current decay rate serves as another indication of the in situ conditioning of the electrodes during electrochemical cycling (as previously described). Improved proton diffusion coefficients, obtained upon consecutive cycles, enhance proton intercalation kinetics, thus allowing shorter time for reaction completion represented by faster current decay. Notably, the significant current decay rates observed for the porous sample (Fig. 3a) compared to those of the dense sample (Fig. 3b) further confirm the superiority of the porous morphology in electrochromic conditioning.
The improved charge transfer across the interfaces in the porous film is also translated to improved color switching of the EC electrode. In situ transmission spectra at a constant wavelength (632.8 nm) during 50 cycles of coloration and bleaching for porous and dense WO3 films are presented in Fig. 4a and b, respectively. Fig. 4a shows that the ΔT% (the difference between bleaching and coloration states) rapidly increases with EC cycling reaching the maximum modulation value within about 10 cycles. In contrast, the EC performance of the dense system, Fig. 4b, shows a moderate increase of ΔT% through the 50 cycles. These results are again correlated with the film morphologies. Namely, high film porosity exposes many accessible intercalation pathways and hence intercalation sites could be reached within a few cycles. In contrast, the slow and progressive increase of ΔT% along the 50 cycles of the dense WO3 film is a result of a stalled charge insertion into the film limited by the low interfacial area. This indicates that the high interfacial area in the porous film has two important contributions to the EC performance: (i) fast hydration during the first cycles which conditions the EC material by providing water spacious planes for facile cation diffusion pathways; and (ii) exposure of many accessible cation intercalation pathways and sites.
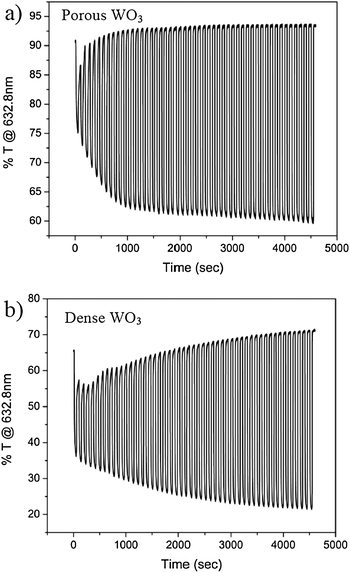 | ||
| Fig. 4 In situ transmission at 632.8 nm of (a) a porous WO3 film and (b) a dense WO3 film, during 50 cycles of coloration and bleaching in H2SO4. | ||
Coloration and bleaching switching response times in a liquid acidic electrolyte, defined as the time required for a 90% optical modulation, were measured and recorded for five samples of each type of film to insure reproducibility. The films were cycled through 50 cathodic and anodic waves, as shown in Fig. 3 and 4, and the extracted switching response times are presented in Table 1. While switching time for coloring porous WO3 films is about 5 s on average, the switching time for dense WO3 films is about 8 s. The reduced switching time, i.e. improved kinetics, for the porous WO3 film is associated with the high WO3–electrolyte interfacial area obtained by the porous morphology compared to the dense morphology. The nanometer sized pores in the porous WO3 film are accessible for the liquid electrolyte, which results in an increase of intercalation sites for protons when compared to the dense morphology, and hence the improved kinetics is obtained.
| Coloration time (s) | Bleaching time (s) | |
|---|---|---|
| Porous WO3 film | 4.93 ± 0.95 | 0.62 ± 0.17 |
| Dense WO3 film | 7.95 ± 0.77 | 1.28 ± 0.12 |
The high WO3–electrolyte interfacial area in the porous WO3 film is also responsible for the improved kinetics of the bleaching process, as shown in Table 1, however, the effect of the morphology is more dramatic in the coloration process. A comparison between the coloration process and bleaching process shows that in both types of electrode films the bleaching process is much faster than the coloration process. This noticeable rate difference has been previously assigned to the different mechanisms that govern the coloration and bleaching processes: while the coloration rate is controlled by the exchange current density at the WO3–electrolyte interface, the bleaching rate is ruled mainly by space charge-limited H+ ion diffusion inside the WO3.37 In other words, the coloration process is more sensitive to the WO3–electrolyte interface, while the bleaching process is determined mainly in the WO3 bulk. Accordingly, the effect of film morphology is more dominant in the coloration process and less affective in the bleaching process.
Utilizing the high WO3–electrolyte interfacial area for fast switching of fully solid state EC devices requires the fabrication of EC electrodes with high WO3–solid-electrolyte interface. This was done by infiltrating Nafion, a commercially available and well-known proton conducting polymer, into the porous WO3 film. Infiltration of Nafion was achieved by dip-coating the film in a diluted solution of a commercially available alcoholic Nafion solution. Solvent evaporation should result in sedimentation of the Nafion polymer in the WO3 pores and on the film surface. To unambiguously corroborate Nafion infiltration into the mesoporous WO3 film, we have sectioned the samples into thin (∼50 nm) lamella using a focused ion beam (FIB) and imaged the cross-section with high resolution transmission electron microscopy (HRTEM). Elementally distinct signals measured to sub-eV-resolution in electron energy loss spectroscopy (EELS) are spatially resolved by energy-filtered TEM (EF-TEM), allowing a distribution map of elements within the material to be established. Fluorine atoms, for example, have a strong EELS signature centered at 685 eV corresponding to the K-edge, and hence can be used to map the distribution of the fluorine-bearing Nafion in the mesostructured WO3 films. Furthermore, the combination of HRTEM and EFTEM measurements in a single location enables the determination of fluorine distribution across the cross-sectioned film. Fig. 5a shows the scanning-TEM (STEM) image of the cross-sectioned mesostructured film on a silicon substrate. In STEM mode the WO3 film and the silicon substrate appear in bright contrast, while the Nafion polymer and voids are in dark contrast. The EFTEM image of the same area (Fig. 5b), shows intensity contrast between bright regions (red colored) containing fluorine and dark regions that do not contain fluorine. Because Nafion is the only fluorine-bearing component in the system, the spatial distribution of fluorine across the film reflects the location of Nafion in the film. The fluorine distribution relative to the WO3 distribution is analyzed by overlaying Fig. 5a and b, as presented in Fig. 5c. This analysis clearly indicates that fluorine, and hence the Nafion polymer, infiltrates into the pores of the oxide film. Importantly, the images show Nafion distribution in pores near the silicon substrate indicating the formation of proton-conductor continuous networks through the entire mesostructured WO3 film. The images also clearly show that while small pores are filled with Nafion; in the bigger pores the Nafion is located mainly adjacent to the pore walls, probably as a result of sedimentation during solvent evaporation.
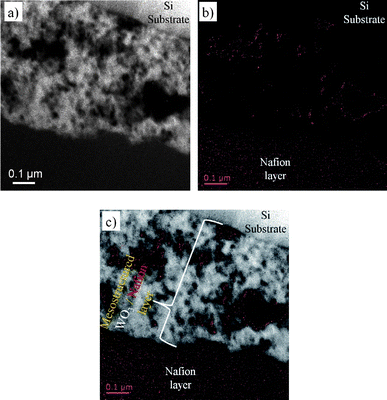 | ||
| Fig. 5 (a) HR-STEM image of a FIB-prepared cross-section of the porous WO3 film after Nafion infiltration. WO3 and the Si substrate are in bright contrast, while the Nafion polymer and pores are in dark contrast. (b) A corresponding EFTEM image of the same sample region shown in (a) using the fluorine K-edge (685 eV); red markers indicate the locations of fluorine-rich regions, and hence Nafion, in the material. For clarity, an overlay of (a) and (b) is presented in (c), where fluorine-rich regions appear red and WO3 regions appear white. | ||
Towards characterization of the Nafion-infiltrated EC electrode in fully solid-state device geometry, its EC performance was first measured in a liquid cell. Potentiostatic wave measurements were conducted in a H2SO4 solution, similar to those performed for the porous WO3 film (with no Nafion). For comparison, a dense film of WO3 was also dip-coated in the Nafion solution resulting in a dense WO3–Nafion bi-layer. The in situ transmission as a function of time during the potentiostatic waves, and the extracted response times are presented in Fig. 6 and Table 2, respectively. The performance of the hybrid electrode (Nafion-infiltrated porous WO3 film) in H2SO4 is very similar to that of the porous WO3 films in the same solution (Fig. 4). In parallel, the dense WO3–Nafion bilayer performs similar to the dense WO3 film measured in solution. Accordingly, we conclude that the mesostructured morphology of the hybrid electrode maintains the improved kinetics endowed by the high interfacial area. Importantly, the incorporation of Nafion did not extend the response time value (Table 1 and Table 2) suggesting that the Nafion-incorporated porous WO3 electrode can be integrated into a fast switching solid state device.
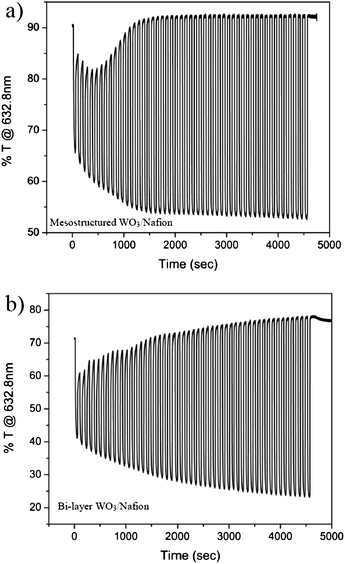 | ||
| Fig. 6 In situ transmission at 632.8 nm of (a) mesostructured WO3–Nafion film and (b) bi-layer WO3–Nafion film, during 50 cycles of coloration and bleaching in H2SO4. | ||
| Coloration time (s) | Bleaching time (s) | |
|---|---|---|
| Mesostructured WO3–Nafion film | 4.71 ± 0.75 | 0.52 ± 0.19 |
| Bi-layer WO3–Nafion film | 8.38 ± 0.93 | 1.1 ± 0.20 |
Indeed, the high WO3–Nafion interfacial area and intimate interactions, and the continuous Nafion pathways through the film allowed successful integration of the new electrode in all solid-state, fast-switching EC devices. The solid-state device was completed by depositing a thick viscous Nafion layer on top of the hybrid electrode to serve as a proton reservoir, followed by a top glass/ITO slide. To increase the availability of protons in the solid system, the EC electrodes were charged with protons through one coloration wave in acidic solution prior to integration into the solid device (see Experimental section). For comparison, the solid-state bi-layer EC device was also proton-charged in an acidic solution prior to device integration. The architectures of the EC devices comprising the hybrid mesostructured electrode and the dense WO3 electrode are schematically shown in Fig. 7a and b, respectively.
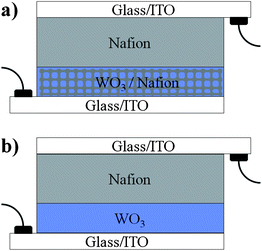 | ||
| Fig. 7 Schematic architecture presentations of the EC devices prepared and characterized in this study: (a) an EC layer composed of a mesostructured hybrid WO3–Nafion film prepared by infiltrating Nafion into a porous WO3 is covered with a thick Nafion layer and sandwiched between two glass/ITO slides; (b) a dense EC WO3 film is covered with a thick Nafion layer in a bi-layer configuration, and sandwiched between two glass/ITO slides. In both devices the thick Nafion layer acts as proton reservoir, proton conductor, and separator. | ||
The EC performance, i.e. the response time, was measured at a constant wavelength (632.8 nm) and constant bias for each state, as described in the Experimental section. The ITO substrate is stable under such bias conditions guaranteeing that the measured changes in transmission are associated with the WO3 material only. Photographs of a typical hybrid mesostructured WO3–Nafion EC device at the bleached state (orange frame) and colored state (blue frame) are shown in the inset of Fig. 8a. Visibly, the bleached state is colorless and transparent, while the colored state maintains transparency, but with a noticeable blue hue. Fig. 8a also shows the transmission as a function of time during a coloration process of an EC device comprising the hybrid mesostructured electrode (red line); and that of an EC device comprising the dense WO3–Nafion bi-layer electrode (black line). Importantly, the initial pre-coloration transmission values measured in Fig. 8a for both devices are fully regained after bleaching (Fig. 8b), demonstrating the complete reversibility of the EC process in both devices. Fig. 8a also clearly shows that although the net reduction in transmission is similar for both devices, ∼35%, the time required to reach 90% of the modulation (indicated by dashed lines in the figure) is much shorter for the solid hybrid mesostructured electrode, 5.9 s, compared to that of the solid dense bi-layer electrode, 9.8 s Table 3 summarizes the response times in coloration of mesostructured and bi-layer devices, respectively.
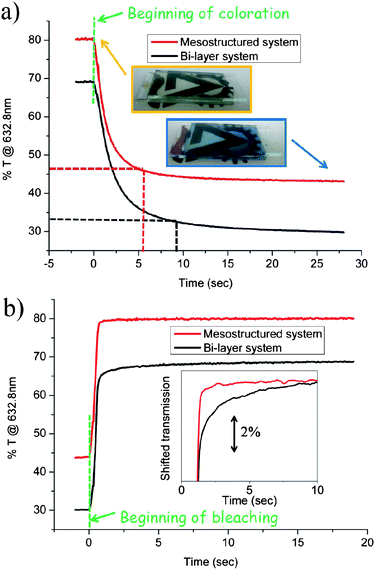 | ||
| Fig. 8 Response times of an EC device comprising the mesostructured hybrid Nafion–infiltrated WO3 electrode (red lines), and EC device comprising a dense WO3–Nafion bilayer (black line). (a) Transmittance at 632.8 nm as a function of time during coloration under cathodic bias; inset: photographs of the EC device comprising the mesostructured hybrid Nafion-infiltrated WO3 electrode presented in Fig. 7a, at the bleached state (anodic bias, orange frame) and the colored state (cathodic bias, blue frame). (b) Transmittance at 632.8 nm as a function of time during bleaching under anodic bias. Inset: the same lines shown in (b) but shifted closer along the y-axis so that the difference in the bleaching-rate of the two electrodes is clearer. | ||
| Coloration time (s) | |
|---|---|
| Mesostructured WO3–Nafion device | 5.9 ± 0.4 |
| Bi-layer WO3–Nafion device | 9.8 ± 0.5 |
A noticeable decrease in the response time of the hybrid mesostructured electrode compared to that of the dense electrode is also observed for the bleaching process. The transmission as a function of time during the bleaching process of the EC device comprising the hybrid mesostructured electrode (red line), and that of the EC device comprising the dense WO3–Nafion bi-layer electrode (black line) are shown in Fig. 8b. For clarity, the inset of Fig. 8b shows the same lines shown in Fig. 8b, however the black line showing the EC performance of the dense bi-layer was shifted along the y-axis towards the red line showing EC performance of the hybrid mesostructure. The inset shows that the bleaching process of the mesostructured hybrid electrode follows a step-like behavior (red line) with an almost instantaneous optical modulation, reflecting a rapid response time of 1.6 seconds. In contrast, the bleaching response of the dense bi-layer device follows a logarithmic-like function (black line) with a slower response time of ∼2 s. As discussed above, the difference in coloration and bleaching response times is related to the different process mechanisms. While the coloration process is sensitive to the WO3–electrolyte interface, the bleaching process is determined mainly in the WO3 bulk. Therefore, the dramatic enhancement of the coloration-rate, by ∼40%, but moderate enhancement in the bleaching-rate, 20%, corroborates that the main advantage of the hybrid mesostructured electrode for fast switching solid EC devices is in the high interfacial area and contact which allow fast proton transfer across the hybrid organic–inorganic interface.
Conclusions
In summary, we have demonstrated the design, synthesis and integration of a hybrid mesostructured electrode for fast-switching all-solid-state EC devices. Initially, porous and dense WO3 films were prepared by sol–gel strategies. These films were characterized in a three-electrode mode configuration in H2SO4 solution. Two main conclusions were obtained from this system: (i) conditioning the electrode could be accelerated by increasing the WO3–electrolyte interfacial area; and (ii) EC switching time is determined by the morphology of the film, i.e., the WO3–electrolyte interfacial area. As an intermediate stage toward fully solid state devices, Nafion was infiltrated into the porous WO3 matrix and characterized in a H2SO4 solution. Nafion location and distribution in the WO3 pores was characterized using cross-section HRTEM and EFTEM imaging corroborating Nafion penetration into the WO3 pores through the entire film thickness. Nafion-infiltrated WO3 films have shown response times in H2SO4 solutions similar to those measured for pristine WO3 films in similar solutions. Accordingly, we conclude that kinetics of the EC process is still limited by the WO3–Nafion interfacial area available for proton transfer.For integration into fully solid state devices, the porous WO3 films were infiltrated with Nafion and topped with a thick Nafion layer acting as a proton reservoir for the device. The high WO3–Nafion interfacial area and improved contact in the mesostructured hybrid electrode facilitates proton intercalation and de-intercalation. Because cation transfer is generally the rate determining step in EC devices, the mesostructured hybrid electrode exhibited a dramatic reduction of the EC response times compared to solid-state EC devices comprising commonly processed dense WO3 electrodes. Indeed, switching times for the solid state systems were only a bit higher than those in the liquid-electrolyte system. The reduction in response time, compared with values previously reported for similar solid state devices, is associated with facilitated proton transfer across the non-homogenous interface allowing improved kinetics in the judiciously designed mesostructured hybrid electrode reported here.
Acknowledgements
The work was supported by the Israel Ministry of Defense, and partially supported by the Grand Technion Energy Program (GTEP), the Helmsley Charity Fund, and the Technion Russell Berry Nanotechnology Institute (RBNI). BK wishes to thank the Israel Ministry of Science for a Doctoral Fellowship.References
- C. M. Lampert, Sol. Energy Mater. Sol. Cells, 2003, 76, 489–499 CrossRef CAS.
- C. M. Lampert, Glass Sci. Technol., 2002, 75, 244–252 CAS.
- M. Green and K. Pita, Sol. Energy Mater. Sol. Cells, 1996, 43, 393–411 CrossRef CAS.
- S. H. Lee, H. M. Cheong, P. Liu, D. Smith, C. E. Tracy, A. Mascanrenhas, J. R. Pitts and S. K. Deb, J. Appl. Phys., 2000, 88, 3076–3078 CrossRef CAS.
- M. Mastragostino, C. Arbizzani, P. Ferloni and A. Marinangeli, Solid State Ionics, 1992, 53–56, 471–478 CrossRef CAS.
- C. Arbizzani, M. Grazia Cerroni and M. Mastragostino, Sol. Energy Mater. Sol. Cells, 1999, 56, 205–211 CrossRef CAS.
- W. Lu, A. G. Fadeev, B. H. Qi, E. Smela, B. R. Mattes, J. Ding, G. M. Spinks, J. Mazurkiewicz, D. Z. Zhou, G. G. Wallace, D. R. MacFarlane, S. A. Forsyth and M. Forsyth, Science, 2002, 297, 983–987 CrossRef CAS.
- A. A. Argun, A. Cirpan and J. R. Reynolds, Adv. Mater., 2003, 15, 1338 CrossRef CAS.
- S. K. Deb, Philos. Mag., 1973, 27, 801–822 CrossRef CAS.
- C. G. Granqvist, Handbook of Inorganic Electrochromic Materials, Elsevier, New York, 1995 Search PubMed.
- C. Bechinger, S. Ferrer, A. Zaban, J. Sprague and B. A. Gregg, Nature, 1996, 383, 608–610 CrossRef CAS.
- S. H. Lee, H. M. Cheong, J. G. Zhang, A. Mascarenhas, D. K. Benson and S. K. Deb, Appl. Phys. Lett., 1999, 74, 242–244 CrossRef CAS.
- M. Gratzel, Nature, 2001, 409, 575–576 CrossRef CAS.
- M. Wagemaker, A. P. M. Kentgens and F. M. Mulder, Nature, 2002, 418, 397–399 CrossRef CAS.
- D. T. Gillaspie, R. C. Tenent and A. C. Dillon, J. Mater. Chem., 2010, 20, 9585–9592 RSC.
- G. C. Granqvist, Sol. Energy Mater. Sol. Cells, 2000, 60, 201–262 CrossRef.
- S. Badilescu and P. V. Ashrit, Solid State Ionics, 2003, 158, 187–197 CrossRef CAS.
- A. Lusis, J. Kleperis and E. Pentjuss, J. Solid State Electrochem., 2003, 7, 106–112 CAS.
- E. Ozkan Zayim, P. Liu, S.-H. Lee, C. E. Tracy, J. A. Turner, J. R. Pitts and S. K. Deb, Solid State Ionics, 2003, 165, 65–72 CrossRef CAS.
- T. Maruyama and T. Kanagawa, J. Electrochem. Soc., 1994, 141, 2435–2438 CrossRef CAS.
- M. Regragui, M. Addou, A. Outzourhit, J. C. Bernéde, E. El Idrissi, E. Benseddik and A. Kachouane, Thin Solid Films, 2000, 358, 40–45 CrossRef CAS.
- L. Meda, R. C. Breitkopf, T. E. Haas and R. U. Kirss, Thin Solid Films, 2002, 402, 126–130 CrossRef CAS.
- A. Rougier, K. Sauvet and L. Sauques, Ionics, 2008, 14, 99–105 CrossRef CAS.
- K. Sauvet, A. Rougier and L. Sauques, Sol. Energy Mater. Sol. Cells, 2008, 92, 209–215 CrossRef CAS.
- O. Bohnke, M. Rezrazi, B. Vuillemin, C. Bohnke, P. A. Gillet and C. Rousselot, Sol. Energy Mater. Sol. Cells, 1992, 25, 361–374 CrossRef CAS.
- L. Berggren and G. A. Niklasson, Solid State Ionics, 2003, 165, 51–58 CrossRef CAS.
- L. Berggren and G. A. Niklasson, Sol. Energy Mater. Sol. Cells, 2005, 85, 573–586 CrossRef CAS.
- E. Masetti, M. L. Grilli, G. Dautzenberg, G. Macrelli and M. Adamik, Sol. Energy Mater. Sol. Cells, 1999, 56, 259–269 CrossRef CAS.
- Y.-S. Lin, Y.-L. Chiang and J.-Y. Lai, Solid State Ionics, 2009, 180, 99–105 CrossRef CAS.
- M. Deepa, M. Kar, D. P. Singh, A. K. Srivastava and S. Ahmad, Sol. Energy Mater. Sol. Cells, 2008, 92, 170–178 CrossRef CAS.
- W. Cheng, E. Baudrin, B. Dunn and J. I. Zink, J. Mater. Chem., 2001, 11, 92–97 RSC.
- T. Brezesinski, D. Fattakhova-Rohlfing, S. Sallard, M. Antonietti and B. M. Smarsly, Small, 2006, 2, 1203–1211 CrossRef CAS.
- S. H. Lee, R. Deshpande, P. A. Parilla, K. M. Jones, B. To, A. H. Mahan and A. C. Dillon, Adv. Mater., 2006, 18, 763 CrossRef CAS.
- O. J. Klejnot, Inorg. Chem., 1965, 4, 1668 CrossRef CAS.
- S. Neyshtadt, J. P. Jahnke, R. J. Messinger, A. Rawal, T. S. Peretz, D. Huppert, B. F. Chmelka and G. L. Frey, J. Am. Chem. Soc., 2011, 133, 10119–10133 CrossRef CAS.
- B. Kattouf, G. L. Frey, A. Siegmann and Y. Ein-Eli, Chem. Commun., 2009, 7396–7398 RSC.
- B. W. Faughnan, R. S. Crandall and P. M. Heyman, RCA Rev., 1975, 36, 177–197 CAS.
| This journal is © The Royal Society of Chemistry 2013 |
