A fluorescent probe for water content in ethanol based on a complex of ruthenium(II)
Pin-Zhu
Qin
*a,
Cheng-Hui
Han
a and
Da-Wei
Huang
b
aDepartment of City Science, Jiangsu Open University/Jiangsu City Vocational College, Nanjing 210019, China. E-mail: qinpz@jstvu.edu.cn; Fax: +86 025 8649 6516; Tel: +86 025 8649 6518
bCollege of Environmental Science and Engineering, Hunan University, Changsha 410082, China
First published on 17th October 2013
Abstract
A new fluorescent dye, a complex of ruthenium(II), Ru(NH2-phen)3Cl2, using 5-amino-1,10-phenanthrolin (NH2-phen) as a ligand reagent was synthesized by simple steps and its application for water content determination in ethanol was described. The fluorescence intensity of the probe decreased obviously with increasing water content in ethanol when it was excited at 322 nm. The probe showed a linear response toward water content in the concentration range ca. 0.50–7.00%. Additionally, the prepared sensing system was insensitive to oxygen and ionic strength and presented satisfactory sensitivity. The detection limit could be as low as 0.035%.
Introduction
Due to lack of energy resource, the exploitation and utilization of renewable energy have been implemented as strategic measures all around the world.1,2 Ethanol is considered to be the most powerful alternative fuel for traditional fuels such as petroleum and coal.3–5 The use of ethanol has increased worldwide, because it is biodegradable and less harmful to the environment than its petrochemical alternatives. Ethanol is also one of the most popular organic solvents in industries including pharmaceuticals, chemicals, cleaning and so on.6–8 Among them, the water content in ethanol is one of the important indices of product quality, so the monitoring of water content in ethanol is very significant.The traditional method to quantitatively measure water content is by Karl Fisher titration. Although this approach has several useful characteristics, some disadvantages such as a requirement for skills of the analyst and specialized equipment, reagents that are harmful to the human body, and interference from other co-existing species limit its wide application.9 Meanwhile, many detection systems based on a variation of conductivity,10 photothermal signalling,11 gas chromatography,12etc. for water content in ethanol have been developed.
With the appearance of optical technology, there is a growing interest in the investigation of optical water sensing systems. They can offer many advantages in that they are immune to electromagnetic interference, easy to fabricate, and of satisfactory sensitivity. Many sensing systems for the quantification of humidity and water content have been developed, including those based on absorption, reflection, refractive index, phosphorescence, and fluorescence.13–17
Among the various optical systems for water content sensing, fluorescence-based probes have drawn considerable attraction due to high sensitivity and ease of operation. Many fluorescent dyes are known to change their fluorescence lifetime18,19 and intensity with varying water content in ethanol. However, taking into consideration the complexity and high cost associated with lifetime instruments, most of the fluorescence water sensing systems described so far are based on the measurement of fluorescence intensity of a suitable indicator. Based on this, fluorescent dyes such as umbelliferone,20 rhodamine 6G,21 naphthalimide,22 and 10-allyl-acridine orange,23etc. have been developed for water determination. Some properties of the previously developed optical water sensing systems and the proposed method are shown and compared in Table 1.
| Mechanism | Detection range (v/v%) | Linear concentration (v/v%) | Limit of detection (v/v%) | Ref. |
|---|---|---|---|---|
| Near infrared | 0–100 (relative humidity) | 28.0–36.0 | Not given | 13 |
| Phosphorescence | 1.9–100 (relative humidity) | 40.0–50.0 | 0.11 | 16 |
| Fluorescence lifetime | 0–20 (acetone) | Not given | 0.02 (ethyl acetate) | 18 |
| Fluorescence lifetime | Below 4 | Not given | 0.06 (DMSO), 0.07 (ethanol), 0.006 (acetonitrile) | 19 |
| Fluorescence intensity | 0–70 (dioxane) | 0.00–4.40 | 0.008 (dioxane), 0.006 (acetonitrile), 0.015 (ethanol) | 23 |
| Fluorescence intensity | 0–100 (ethanol) | 0.50–7.0 | 0.035 (ethanol) | This work |
As demonstrated in the previous literature, ruthenium complexes are excellent candidates for preparing fluorescence sensing systems. They are a category of important fluorescent reagents with high quantum yield, nontoxicity, and stability which have been used extensively as biologically fluorescent probes,24 on/off fluorescent chemosensors for organotin halides,25 for intracellular oxygen sensing,26 recognition of double-strand DNA,27 and so on. The design of novel fluorescence probes for water continues to be of interest.
Using 5-amino-1,10-phenanthrolin (NH2-phen) as the ligand reagent, a new fluorescence dye, Ru(NH2-phen)3Cl2 was synthesized. The fluorescence intensity of Ru(NH2-phen)3Cl2 changed drastically in different solvents. It was highly sensitive to the water content in ethanol. The design and synthesis of this probe was much easier than those previously described. The successful fabrication of the proposed sensing system is a useful example of the use of ruthenium complexes for water probe application.
Experimental
Apparatus
All fluorescence measurements collected through a 1 cm quartz cell were carried out on a Perkin-Elmer LS-55 spectrofluorimeter with both excitation and emission slits set at 8 nm and controlled by a personal computer data processing unit. The light source used was a pulsed Xe lamp. Solution pH was measured by use of a pHS-3B pH meter (Shanghai Precision & Scientific Instrument Co. Ltd., Shanghai, China), which was calibrated with standard buffers. All measurements were performed at room temperature (25 °C) and atmospheric pressure.Materials and reagents
Ruthenium trichloride (RuCl3·nH2O) was purchased from Sinopharm Chemical Reagent Co., Ltd (Shanghai, China). 5-Amino-1,10-phenanthroline (5-NH2-phen) as the ligand was synthesized by the authors as described in our previous study.28 All organic solvents were of analytical-reagent grade and received or dried to eliminate any water residue before the experiment. Ethanol was pre-dried over Ca for two days, and distilled prior to use; acetonitrile was refluxed over P2O5 and distilled prior to use. Unless otherwise stated, all other reagents were of analytical-reagent grade and used without purification or treatment. Doubly distilled water was used throughout.Synthesis of Ru(NH2-phen)3Cl2
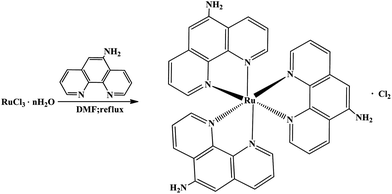
Ru(NH2-phen)3Cl2 was easily synthesized through the reaction of RuCl3·nH2O with NH2-phen by a modified version of the method reported by Braddock etc.,29 and is shown schematically in Fig. 1. A mixture of RuCl3·nH2O and NH2-phen with a molar ratio of 1![[thin space (1/6-em)]](https://www.rsc.org/images/entities/char_2009.gif) :
:![[thin space (1/6-em)]](https://www.rsc.org/images/entities/char_2009.gif) 4 was refluxed for five hours in 50 ml of N,N-dimethylformamide (DMF). Then, the DMF solution was slowly distilled off until the solution volume was about 10 ml. The DMF solution was added dropwise to a saturated solution of tetra-n-butylammonium chloride in reagent grade acetone (about 0.1 g ml−1), then a purple precipitation was obtained. The crude product was washed with acetone, recrystallized from water and dried. Anal. calcd for RuC36H27N9Cl2: C 57.07, H 3.59, N 16.64, Cl 9.36. Found: C 57.32, H 3.62, N 16.63, Cl 9.24%.
4 was refluxed for five hours in 50 ml of N,N-dimethylformamide (DMF). Then, the DMF solution was slowly distilled off until the solution volume was about 10 ml. The DMF solution was added dropwise to a saturated solution of tetra-n-butylammonium chloride in reagent grade acetone (about 0.1 g ml−1), then a purple precipitation was obtained. The crude product was washed with acetone, recrystallized from water and dried. Anal. calcd for RuC36H27N9Cl2: C 57.07, H 3.59, N 16.64, Cl 9.36. Found: C 57.32, H 3.62, N 16.63, Cl 9.24%.
Solutions preparation
A stock solution of fluorescent probe Ru(NH2-phen)3Cl2 (1.0 × 10⁻⁴ mol l−1) in ethanol was prepared. Solutions with different water content in ethanol were freshly prepared prior to the measurement. Briefly, a certain bulk of double-distilled water was added to a 25 ml volumetric flask by micro or macro transfer pipettes first, and then diluted with dried ethanol to volume.The working solutions were prepared in the following order: 1 ml Ru(NH2-phen)3Cl2 stock solution was added into each 10 ml colorimetric tube, dried, and the solutions with different water content or other work solutions were added into the colorimetric tube up to the mark, respectively. Britton–Robinson (B–R) buffer solutions in the range of pH 2.0 to 11.5 were prepared by mixing appropriate amounts of phosphoric, acetic and boric acids of the same concentration (0.04 mol l−1) and adjusted to desired pH with 0.20 mol l−1 sodium hydroxide. Outside this range, the pH was adjusted by the addition of HCl or NaOH solution.
Results and discussion
Spectral characteristics in different solvents and response mechanism
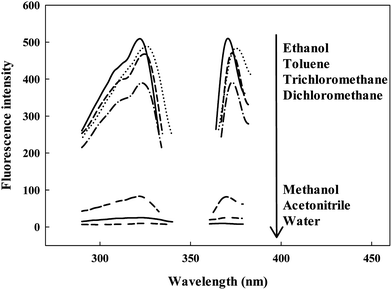
Fluorescence spectra of the probe with various solvents were recorded in Fig. 2 and Table 1 when the probe was excited at about 322 nm. By observing Fig. 2, one can easily notice that the solvent exerted an evident influence on both the fluorescence intensities (from 510 in chloroform to 9.7 in water) and emission spectral maxima positions (from 375 nm in toluene to 368 nm in water). As is widely recommended, the luminescence of ruthenium ion is attributable to the contribution of the intramolecular energy transfer from the ligand. The solvent molecule perhaps has an effect on this energy transfer, which leads to the decrease in the fluorescence intensity. This is in agreement with the previous studies that the solvent plays a important role in the relaxation process.30–32In order to quantify the response of Ru(NH2-phen)3Cl2 to solvent polarity, the spectral properties of Ru(NH2-phen)3Cl2 were recorded in organic solvents of different polarity. The excitation wavelength (λex), emission wavelength (λem), Stokes shift (Δv), dielectric constant (ε), refractive index (n), orientation polarizability (Δf) and relative fluorescence intensity (Imax), which was in relation to the most intensive emission measure in ethanol (I = 1.00), were reported in Table 2.
| Solvent | λ ex (nm) | λ em (nm) | Δν (cm−1) | ε | n | Δf | I max |
|---|---|---|---|---|---|---|---|
| Ethanol | 322 | 370 | 4029 | 24.30 | 1.301 | 0.289 | 1.00 |
| Toluene | 326 | 375 | 4008 | 2.42 | 1.497 | 0.016 | 0.95 |
| Trichloromethane | 324 | 373 | 4055 | 4.80 | 1.443 | 0.149 | 0.92 |
| Dichloromethane | 323 | 373 | 4150 | 9.10 | 1.424 | 0.219 | 0.77 |
| Methanol | 322 | 369 | 3956 | 32.66 | 1.3288 | 0.309 | 0.16 |
| Acetonitrile | 322 | 371 | 4102 | 37.50 | 1.344 | 0.305 | 0.05 |
| Water | 322 | 368 | 3882 | 78.50 | 1.3330 | 0.320 | 0.02 |
Usually, general solvent effects on the fluorescence spectra can be estimated from a Lippert–Mataga equation:
 | (1) |
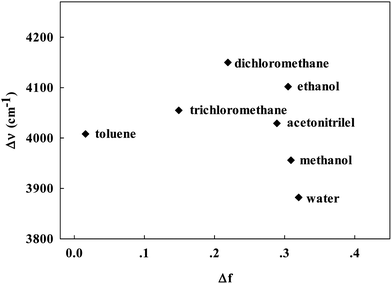
 accounts for the spectral shifts due to reorientation of the solvent molecules, which is called the orientation polarizability. As shown in Fig. 3, there was no such correlation between Stokes shift in various solvents and the orientation polarizability. This variance may be due to the effect of the formation of hydrogen bonding. Such HBD (hydrogen-bond donor) solvents can easily form hydrogen bonds, binding to the amino nitrogens of Ru(NH2-phen)3Cl2. Simultaneously, no reliable relationship was found between the parameters and fluorescence intensities.
Spectral changes induced by addition of water content in ethanol
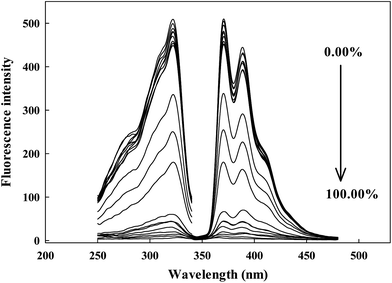
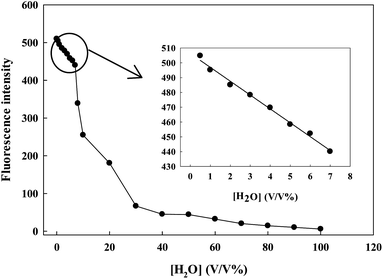
The prepared sensing system is really useful in the determination of water content in ethanol. The response curves of the probe contacted with ethanol solutions of different water content are displayed in Fig. 4. With the addition of water content from 0.00% to 100.00% (v/v), the fluorescence intensity of Ru(NH2-phen)3Cl2 decreased dramatically and the emission peak underwent a slight blue shift. Ru(NH2-phen)3Cl2 could be a very useful probe for water determination in ethanol.The effect of pH
The effect of the pH on the fluorescence intensity of the probe of Ru(NH2-phen)3Cl2 was investigated in aqueous solutions of different pHs. The fluorescent probe was affected by the hydrogen ion concentration. The fluorescence intensity greatly increased with increasing pH value from 1.00 to 6.00, and reduced slightly at pH 6.00–10.0, and reduced sharply at pH higher than 10.0.The effect of oxygen
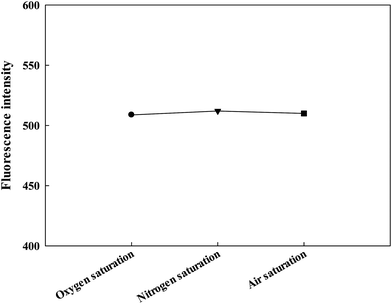
Complexes of ruthenium(II) are considered to be one of the indicators for oxygen. The stock solution of fluorescent probe Ru(NH2-phen)3Cl2 in ethanol was used to inspect the effect of oxygen. Solutions were saturated by oxygen, nitrogen and air, respectively, and the fluorescence intensity was measured. The results are shown in Fig. 5, the fluorescence intensity of the three solutions are basically the same. Therefore, the influence of oxygen can be neglected in the practical application of the proposed sensing system.The effect of ionic strength
The effect of ionic strength on the fluorescence intensity of the fluorescence dye was examined in B–R buffer solutions of pH 7.0. The buffer solutions were adjusted to ionic strength from 0.01 to 1.0 M with NaCl. The results showed that the fluorescence intensity of the probe remained almost constant.Interference of other solvents
In order to investigate the interference of other solvents, ethanol solutions with different solvents including methanol, ethyl aldehyde, and toluene in the same content of 0.20% were prepared. The fluorescence intensities were 510.03, 509.66, 510.78, and 510.07 for pure ethanol, methanol, ethyl aldehyde, and toluene in ethanol, respectively. On the basis of these observations, small amounts of impurities in ethanol would be negligible.Quantification and detection limit
Fig. 6 showed the experimental response curves of Ru(NH2-phen)3Cl2 for different contents of water. In the range between 0.50% and 7.00%, the fluorescence intensity is linearly dependent on the water content. The dependency can be described by the following equation:| I = −9.360[H2O] + 506.318 (R = 0.9924) | (2) |
The calibration equation can serve as the quantitative basis for the determination of water content in ethanol. The detection limit was 0.035%. The relative standard deviation for the water content from the calibration curve is less than 0.36% (blank) of that estimated based on the fluorescence intensity when the water content is 7.00%.
Conclusion
Ru(NH2-phen)3Cl2, a complex of ruthenium(II), has been shown as a feasible fluorophore for sensing water content in ethanol. The complex is easily synthesized and oxygen-insensitive. The proposed sensing system shows satisfactory sensitivity. Study demonstrates that the proposed sensing system is feasible to detect water content in ethanol.Acknowledgements
This work was financially supported by the Natural Science Fund for Colleges and Universities in Jiangsu Province (12KJB610001).References
- R. Baños, F. Manzano-Agugliaro, F. G. Montoya, C. Gil, A. Alcayde and J. Gómez, Renewable Sustainable Energy Rev., 2011, 15, 1753–1766 CrossRef PubMed.
- J. F. Mercure and P. Salas, Energy, 2012, 46, 322–336 CrossRef PubMed.
- A. Lavigne and S. E. Powers, Energy Policy, 2007, 35, 5918–5930 CrossRef PubMed.
- S. Prasad, A. Singh and H. C. Joshi, Resour. Conserv. Recycl., 2007, 50, 1–39 CrossRef PubMed.
- H. V. Blottnitz and M. A. Curran, J. Cleaner Prod., 2007, 15, 607–619 CrossRef PubMed.
- F. B. Xiong and D. Sisler, Opt. Commun., 2010, 283, 1326–1330 CrossRef CAS PubMed.
- K. Srirangan, L. Akawi, M. Moo-Young and C. P. Chou, Appl. Energy, 2012, 100, 172–186 CrossRef PubMed.
- C. A. Cardona and Ó. J. Sánchez, Bioresour. Technol., 2007, 98, 2415–2457 CrossRef CAS PubMed.
- W. Zhu, W. Wei, Z. Mo, L. Nie and S. Yao, Anal. Chem., 1993, 65, 2508–2571 CrossRef.
- R. A. Timm, M. P. H. Falla, M. F. G. Huila, H. E. M. Peres, F. J. Ramirez-Fernandez, K. Araki and H. E. Toma, Sens. Actuators, B, 2010, 146, 61–68 CrossRef CAS PubMed.
- C. R. Omido, S. L. Oliveira, R. S. Shiraishi, K. F. Magalhães, V. S. Ferreira, A. A. de Carvalho, C. Kitano and M. H. de Paula, Sens. Actuators, B, 2013, 178, 581–585 CrossRef CAS PubMed.
- R. Oguchi, K. Yamaguchi and T. Shibamoto, J. Chromatogr. Sci., 1988, 26, 588–590 CAS.
- A. Fong and G. M. Hieftje, Anal. Chem., 1995, 67, 1139–1146 CrossRef CAS.
- K. M. Wang, K. Seiler, J. P. Haug, B. Lehmann, S. West, K. Hartman and W. Simon, Anal. Chem., 1991, 63, 970–974 CrossRef CAS.
- D. B. Papkovsky, G. V. Ponomarev, S. F. Chernov, A. N. Ovchinnikow and I. N. Kurochkin, Sens. Actuators, B, 1994, 22, 57–61 CrossRef CAS.
- J. M. Costa-Fernández and A. Sanz-Medel, Anal. Chim. Acta, 2000, 407, 61–69 CrossRef.
- H. Franke, D. Wagner, T. Kleckers, R. Reuter, H. V. Rohitkumar and B. A. Blech, Appl. Opt., 1993, 32, 2927–2935 CrossRef CAS PubMed.
- Q. Chang, Z. Murtaza, J. R. Lakowicz and G. Rao, Anal. Chim. Acta, 1997, 350, 97–104 CrossRef CAS.
- S. J. Glenn, B. M. Cullum, R. B. Nair, D. A. Nivens, C. J. Murphy and S. M. Angel, Anal. Chim. Acta, 2001, 448, 1–8 CrossRef CAS.
- P. Midoux, F. Delmotte, J. P. Grivet and M. Monsigny, Biochem. Biophys. Res. Commun., 1983, 110, 926–933 CrossRef CAS.
- M. M. F. Choi and O. L. Tse, Anal. Chim. Acta, 1999, 378, 127–134 CrossRef CAS.
- C. G. Niu, P. Z. Qin, G. M. Zeng, X. Q. Gui and A. L. Guan, Anal. Bioanal. Chem., 2007, 387, 1067–1074 CrossRef CAS PubMed.
- X. Yang, C. G. Niu, Z. J. Shang, G. L. Shen and R. Q. Yu, Sens. Actuators, B, 2001, 75, 43–47 CrossRef CAS.
- J. del Mármol, O. Filevich and R. Etchenique, Anal. Chem., 2010, 82, 6259–6264 CrossRef PubMed.
- Y. F. Niu, F. F. Han, Q. Zhang, T. W. Xie, L. Lu, S. H. Li and H. P. Xia, Angew. Chem., Int. Ed., 2013, 52, 5599–5603 CrossRef CAS PubMed.
- J. W. Dobrucki, J. Photochem. Photobiol., B, 2001, 65, 136–144 CrossRef CAS.
- D. Zhao, W. H. Chan, Z. He and T. Qiu, Anal. Chem., 2009, 81, 3537–3543 CrossRef CAS PubMed.
- P. Z. Qin, C. G. Niu, R. Min, G. M. Zeng and X. Y. Wang, Analyst, 2010, 135, 2144–2149 RSC.
- J. N. Braddock and T. J. Meyer, J. Am. Chem. Soc., 1973, 95, 3158–3162 CrossRef CAS.
- I. Tavermelli, B. F. E. Curchod and U. Rothlisberger, Chem. Phys., 2011, 391, 101–109 CrossRef PubMed.
- G. Sathyaraj and B. U. Nair, Inorg. Chim. Acta, 2013, 402, 75–82 CrossRef CAS PubMed.
- S. Rajagopal, G. A. Gnanaraj and A. Mathew, J. Photochem. Photobiol., A, 1993, 69, 83–89 CrossRef.
| This journal is © The Royal Society of Chemistry 2014 |

