Adhesion of lactoferrin and bone morphogenetic protein-2 to a rutile surface: dependence on the surface hydrophobicity†
Tianyang
Sun
ab,
Guang
Han
b,
Matteus
Lindgren
c,
Zhijian
Shen
b and
Aatto
Laaksonen
*bd
aSoft Matter Research Center and Department of Chemistry, Zhejiang University, 310027 Hangzhou, P. R. China
bDepartment of Materials and Environmental Chemistry, Arrhenius Laboratory, Stockholm University, S-106 91 Stockholm, Sweden. E-mail: aatto@mmk.su.se
cBoliden Odda AS, NO-5750 Odda, Norway
dStellenbosch Institute of Advanced Studies (STIAS), Wallenberg Research Centre at Stellenbosch University, Marais Street, Stellenbosch 7600, South Africa
First published on 1st May 2014
Abstract
Binding of the proteins human lactoferrin (LF) and human bone morphogenetic protein-2 (BMP2) to a hydroxylated TiO2 rutile (110) surface has been modeled using molecular dynamics (MD) simulations. In order to study the effect of the hydrophobicity of the rutile surface on the protein binding process, the rutile surface was made more hydrophilic or more hydrophobic by adjusting the rutile atomic charges. The binding of LF and BMP2 to the hydrophobic rutile surface occurred through direct contact between the protein and rutile via both hydrophobic and hydrophilic amino acids. This forced the proteins to undergo structural rearrangements, observed primarily in BMP2. Binding to the hydrophilic rutile surface was largely indirect via the hydration layer of water on the surface of rutile. Both LF and BMP2 had a higher binding strength to the hydrophobic rutile surfaces than to the hydrophilic surfaces, as seen in the larger amplitude of the binding energies.
Introduction
Titanium materials are among the most commonly used biomaterials because of their good biocompatibility, machinability, corrosion resistance and Osseo integration and are used in applications such as biomedical implants and biosensors. Titanium dioxide has been widely studied and used as a coating material, able to protect the metal from further oxidation or induced apatite layer formation and to improve the capability of tissue binding with Ti and thereby better meet the clinical requirements. Direct contacts between TiO2 and proteins and cells from body fluids have an important effect on the biological response and biocompatibility for implants. Both experimental and computational studies in the past have improved the understanding of the protein adsorption mechanism.1 These have been helpful in the development of new materials for applications, such as biocompatible materials for biomedical devices inserted in living bodies, biosensors that can detect the presence of target proteins and purifiers that can absorb unwanted biological materials from a solution.Computer simulations such as molecular dynamics (MD) have been used to study the protein adsorption on various biocompatible materials. MD is a powerful technique to elucidate the mechanisms behind protein–material interaction at the atomic level giving information about specific structural dynamics. Many studies about the interaction of biomolecules and titanium dioxide have focused on a perfectly smooth titanium surface. In these studies, protein/peptide conformational changes, specific binding sites, as well as the contribution of water molecules to the binding to the interface have been investigated and compared with other surfaces such as graphite or hydroxylapatite.2–6 Previous studies established that protein–material interactions not only depend on the protein characteristics, such as size, charge, hydrophobicity, conformation, and stability, but also the surface characteristics of the materials (surface chemistry and topography), which is currently of great interest.7,8 Surface modifications by generating micro- or nano-porous structure and attaching functional groups or peptides9–12 have been used to design suitable surfaces. Thus, more work needs to be devoted to studies on how the different physicochemical nature of the surface modification affects protein adsorption. Roach et al.13 have compared protein adsorption onto model hydrophobic (CH3) and hydrophilic (OH) gold-coated surfaces using quartz crystal microbalance and grazing angle infrared spectroscopy. The binding rates, strength and protein bound conformation are influenced by different hydrophobicities. Molecular simulation studies on a hydroxylated titanium dioxide surface suggested that the hydroxylated surface has a closer and stronger interaction with protein.14 For the negatively charged rutile surface, it is indicated that the surface hydroxylation, mediated by water and cations, determined RGD peptide (Arg–Gly–Asp) adsorption where the ions in a micro-environment are also very important in protein–surface interactions.15 These investigations are useful to alter protein/cell adhesion for the design of implants and for wound care products, but much more understanding is required in order to design biomaterials to meet the needs of different applications.
In this work, we have explored the effect of surface hydrophobicity of a hydroxylated rutile (110) surface on the protein adsorption by MD simulations. Many proteins have been found to be able to interact with TiO2, which is of great importance in the biological applications of this material. Herein, human lactoferrin (LF) and human bone morphogenetic protein-2 (BMP2) were chosen to describe the adsorption characteristics. LF is an iron-binding protein with 691 residues. It shows antibacterial activity in clinical studies.16 BMP-2 is a disulfide-connected dimer in a bioactive form, including 114 residues in each monomer. It has been proven to induce differentiation and proliferation of osteoblasts, which makes it indispensable for bone formation and regeneration. BMP-2, which has received approval from the US Food and Drug Administration (FDA) and the European Medicines Agency (EMEA) for clinical use, is of great interest to researchers aiming to improve its applications by understanding the mechanism of BMP-2-surface interaction. We have compared the adsorption patterns of these two model proteins with significantly different sizes and structures on surfaces with different hydrophobicities.
Methodology
The rutile surface
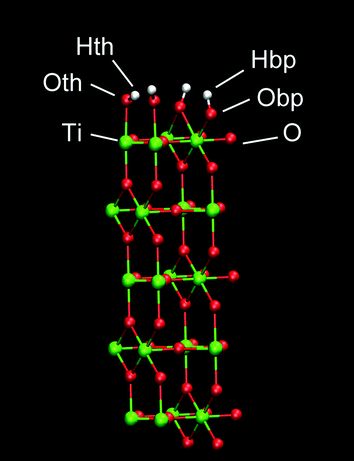
A planar surface consisting of 5 layers of (110) rutile was built. This surface originates from dissociative adsorption of water onto the rutile structure, resulting in a complete coverage of the surface with hydroxyl groups. The hydroxyl group (Oth–Hth) of a water molecule binds to a surface Ti atom and the other hydrogen in water (Hbp) binds to a bridging oxygen atom (Obp) of the rutile surface (see Fig. 1). The Bandura and Kubicki potential17 was used to describe the interactions for both molecular and dissociated water with the surfaces of TiO2. The atomic charges and force field parameters were taken from the refinement work by Predota et al.18 The neutral hydroxylated rutile (110) surface was built as described in ref. 18. This rutile surface is denoted hereafter as “original” and the atomic charges are shown in Table 1. To study how the rutile surface hydrophobicity affects the binding of protein, two modified versions of the rutile surface were generated in addition to the original surface. The charges of all atoms of rutile, including the hydroxyl groups, were homogeneously scaled by a factor of 0.5 or 1.4 in order to produce one surface that was more hydrophobic and another surface that was more hydrophilic than the original surface, respectively. The surface was charge-neutral as a whole in all simulations. We denote these thus modified rutile surfaces as “low” and “high”, respectively, where low is the most hydrophobic surface and high is the most hydrophilic surface.| Atom | Low | Original | High |
|---|---|---|---|
| Ti | 1.098 | 2.196 | 3.0744 |
| O | −0.549 | −1.098 | −1.5372 |
| Obp | −0.518 | −1.035 | −1.4495 |
| Hbp | 0.243 | 0.486 | 0.6804 |
| Oth | −0.504 | −1.008 | −1.4112 |
| Hth | 0.230 | 0.459 | 0.6431 |
Protein structures
The protein structure of lactoferrin (LF) was obtained from the Protein Data Bank (ID: 1CB6). LF is an iron transfer protein consisting of two homologous globular domains named N- and C-lobes. Each lobe contains one iron binding site and one glycosylation site that are located on the opposite ends of the protein. Apo-LF without bound ions was simulated in this work with an open N-lobe and a closed C-lobe.The initial coordinates of BMP2, taken from the Protein Data Bank (ID: 3BMP), were used to derive a homo-dimer with a covalent bond between the Cys78 residues of each monomer at http://pqs.ebi.ac.uk. However, residues 1 to 8 in the monomer are missing. They were therefore added as a linear structure to the protein whereafter that part of the protein was extensively equilibrated first in vacuum and thereafter in water. The equilibration resulted in folding of residues 1 to 8 of both monomers closer to the main part of the protein but they still lack direct contact.
Computational details
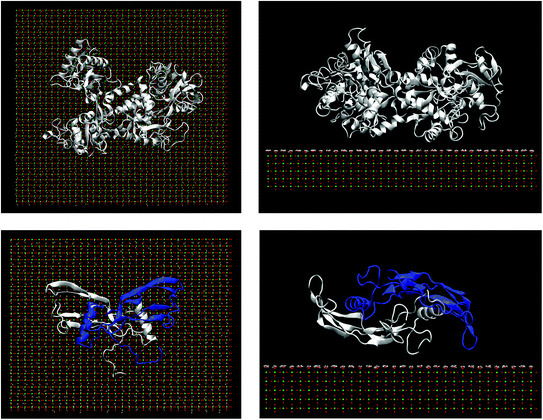
All simulations were performed with the Gromacs 4.0.5 and Amber 03 all-atom force fields supplemented by TiO2 parameters.18,19 The proteins were solvated in TIP3P water20 under periodic boundary conditions. Chloride ions were added in order to compensate for the charges of the proteins. The rutile structure was kept frozen during the simulation, except the surface hydroxyl groups so that the Ti–O–H angle and the Ti–O and O–H bond lengths were constrained to their equilibrium values while the hydroxyl groups themselves were allowed to rotate around the Ti–O bond. The rotational degrees of freedom can be seen to dramatically influence the binding modes and properties, having a better possibility of direct interactions with the protein surface.21,22 van der Waals interactions were handled by a twin-range cut-off method with the rlist and rvdw parameters set at 1.2 nm and 1.4 nm respectively. Long range electrostatic interactions were handled by particle mesh Ewald (PME) summation23 with a cut-off of 1.2 nm for the separation of the direct and reciprocal space. Proteins were first equilibrated in aqueous solution without the rutile surface for an initial solution structure. Then the equilibrated protein–water boxes were placed on top of the rutile surface to form a rectangular box of 116.94 × 106.49 × 99.000 Å3 for LF systems and 103.95 × 76.908 × 99.000 Å3 for BMP-2 systems, respectively. Thereafter, the protein–rutile systems did undergo a long equilibration. All the simulations were carried out in the NVT ensemble using the Nosé–Hoover algorithm with a time constant of 0.1 ps and a reference temperature of 310 K.The simulation systems consisted of one of the two proteins, the rutile surface, water and ions. For each combination of protein (LF, BMP2) and rutile atom charges (low, original, high) two simulations were performed: a reference simulation and a binding simulation. (Both positions are shown in Fig. S1 in ESI†) The proteins in the reference simulations were placed at a distance of 1.5 nm between the rutile surface and the most extended part of the protein surface. The start configurations of the binding simulations were created by moving the proteins closer to the rutile surface (see Fig. 2). The minimum distance between protein atoms and the rutile surface is initially set to about 0.4 nm, which is an effective range within the protein atoms, and atoms in rutile have relatively large intermolecular interactions.24–26 This is a compromise to obtain a binding state within a feasible computing time but still allows the protein to relocate on the surface and freely undergo conformational changes. Table 2 shows a summary of all the MD simulations in this work.
| Simulation name | Protein | Simulation type | Charge of the rutile atoms | Simulation length |
|---|---|---|---|---|
| LFlow ref | Lactoferrin | Reference simulation | 0.5 × Original | 18 ns |
| LFlow | Lactoferrin | Binding simulation | 0.5 × Original | 27 ns |
| LForig ref | Lactoferrin | Reference simulation | Original | 18 ns |
| LForig | Lactoferrin | Binding simulation | Original | 27 ns |
| LFhigh ref | Lactoferrin | Reference simulation | 1.4 × Original | 18 ns |
| LFhigh | Lactoferrin | Binding simulation | 1.4 × Original | 27 ns |
| BMP2low ref | BMP-2 | Reference simulation | 0.5 × Original | 40 ns |
| BMP2low | BMP-2 | Binding simulation | 0.5 × Original | 50 ns |
| BMP2orig ref | BMP-2 | Reference simulation | Original | 40 ns |
| BMP2orig | BMP-2 | Binding simulation | Original | 56 ns |
| BMP2high ref | BMP-2 | Reference simulation | 1.4 × Original | 40 ns |
| BMP2high | BMP-2 | Binding simulation | 1.4 × Original | 50 ns |
After proper equilibration of each system, the binding energies were calculated by subtracting the mean potential energy of the bound system from the mean potential energy of the reference system:
| ΔEbind = 〈Ebound〉 − 〈Ereference〉 | (1) |
The orientation of the protein with respect to the rutile surface was the same in all simulations. It was chosen visually based on the criteria that it would yield a large contact area between the protein and rutile. The sampling of the potential energy of the reference simulations was accelerated by placing positional restraints on the protein backbone atoms. The protein side chains were kept flexible in order for the protein to properly interact with water molecules. The protein movement was not restricted in any way in the binding simulations. A complete sampling of the binding of either LF or BMP2 to rutile using atomistic MD simulations is currently not feasible due to the very slow protein dynamics and the long time scale of the binding processes. Coarse-graining or other types of simplifications would be necessary to follow the binding of a big protein to a surface. In this study, our primary aim is to estimate the relative binding energies depending on the surface character of the rutile (mimicked by changing the surface atom charges), rather than the absolute binding energies. From the binding energies we calculate the effect of the charges of the rutile atoms as the difference between the binding energies for different types of rutile surfaces:
| ΔΔEbind,m–n = ΔEbind,m − ΔEbind,n | (2) |
Results
Structural characterization
Visualizations of the simulations of the bound proteins show that both proteins interact favorably with the rutile surface. The proteins did not show any tendency to depart from rutile, but rather moved even closer forming new contacts with the surface. These interactions between the proteins and the rutile appeared to be stable throughout the simulations. Based upon this observation, we could be sure that both LF and BMP2 are bound to rutile in all the binding simulations, i.e. both proteins bind to a rutile surface with low, original or high atomic charges. The variation with time of the distance between the center of mass of LF and BMP2 and the outermost atoms of the rutile surface is displayed in Fig. 3(A, B).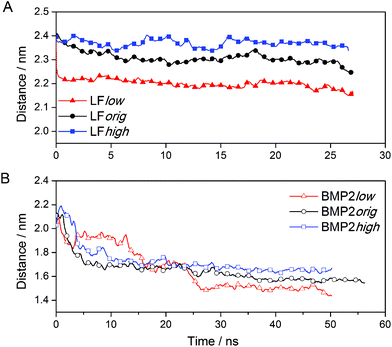 | ||
| Fig. 3 The distance between the centre of mass of protein and the rutile surface. (A) LF and (B) BMP2. | ||
Fig. 3A shows that LF stays close to the start distance in the simulation LFhigh but moves closer to rutile by ∼0.1 and ∼0.2 nm in the simulations LForig and LFlow, respectively. It seems that the type of rutile surface affects the protein–rutile distance, with the shortest distance for the most hydrophobic surface and the longest distance for the most hydrophilic surface. BMP2 moves quickly closer to rutile in all simulations (see Fig. 3B). However, the type of rutile surface seems to affect the protein–rutile distance for BMP2 as it did for LF. The distance is the longest in the simulation BMP2high and shortest in the simulation BMP2low.
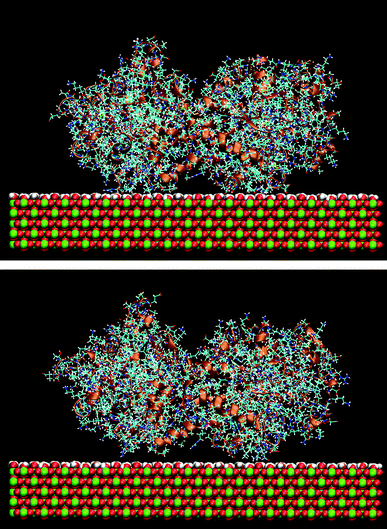
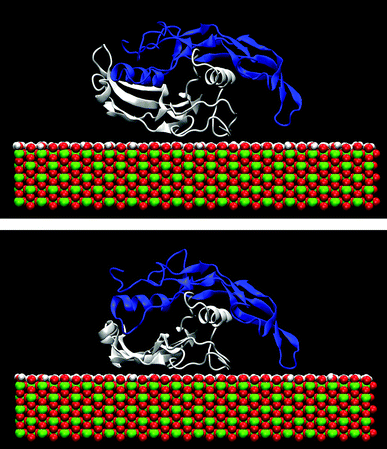
The effect of the rutile hydrophobicity on the protein–rutile distance can also be seen in the number of water and protein atoms within a thin layer of 0.4 nm from the rutile surface. Closer analysis shows that the protein atoms replace water in the layer immediately above rutile in the simulations of the hydrophobic rutile surface (see Fig. S2 in ESI†). The breakdown of the water layer is similar to what has been observed in previous studies about the water molecules in a protein–nonhydroxylated rutile interface.22 On the other hand, when the rutile atomic charges are high, water can favorably compete with LF and BMP2 for the interaction with rutile. The rutile surface is then almost completely covered with water and the major part of the protein interacts with this hydration layer instead of interacting directly with rutile. The protein–rutile distance is therefore longer, as noted from Fig. 3A and B. This effect can be seen in snapshots of the simulations, as in Fig. 4.
The contacts between the proteins and rutile surface are described by the atom number fraction of the total number of contacted atoms as shown in Fig. 5. The contacted atoms were divided into two groups: hydrophilic and hydrophobic by the residue properties they belong to. Gly, Ala, Val, Leu, Ile, Phe and Pro are defined as hydrophobic residues, while the others are hydrophilic. With the increase of rutile hydrophilicity (rutile high charge amplitudes), the percentage of contacted hydrophobic amino acids decreased. It can be seen that some of the peripheral hydrophobic amino acids interact with the hydrophobic surface rather than water, in this way lowering the free energy. However, a number of hydrophilic amino acids, mainly arginine and glutamic acid for LF and BMP2 as well as lysine for BMP2, always have direct contact with rutile even at low rutile atomic charges.
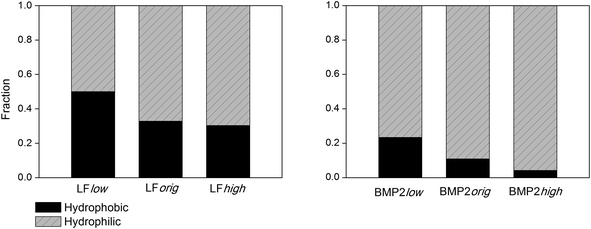 | ||
| Fig. 5 The fraction of LF (left) and BMP2 (right) atoms within 0.4 nm of rutile that can be classified as belonging to hydrophobic vs. hydrophilic amino acids. | ||
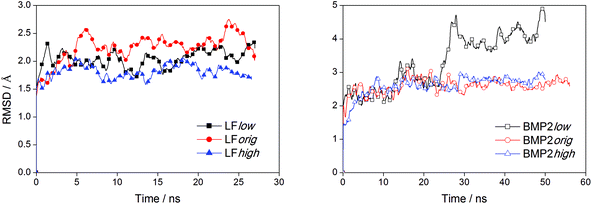
We can observe from the graphs in Fig. 3 that the distance between the center of mass of LF and rutile quickly settles to stable values while this process takes a longer time for BMP2 and does not seem to be quite finished at the end of the simulations. In the simulation BMP2low, the distance between the protein center of mass and rutile is only ∼1.4 nm after 50 ns, which corresponds to a decrease of 0.6 nm from the start distance of 2.0 nm. However, since the start distance between the protein surface and rutile was smaller than the decreasing center of mass distance, it is clear that the BMP2 have deformed, which is confirmed in backbone RMSD graphs. Fig. 6 shows that LF maintains a structure close to its start structure in all simulations, giving RMSD values of 1.5 to 2.5 Å. BMP2 has low RMSD values in the simulations BMP2orig and BMP2high but deforms to a greater extent in the simulation BMP2low, where it reaches an RMSD value close to 5 Å, see Fig. 6.
The sudden increase in the RMSD value of BMP2low after 25 ns can be traced to structural re-arrangements of residues 18 to 40 as well as 86 to 104 in the BMP2 monomer that was positioned closer to the rutile surface. Fig. 7 displays the structure of BMP2 before and after the deformation. The deformation of the protein can be clearly seen when comparing these figures with the structure of the BMP2 monomer colored white. The crystal structure of the BMP2 monomer has a slight curvature that inhibits full contact with the flat rutile surface. The deformation of the monomer resulted in a more flat protein structure and the protein–rutile contact area was thereby increased.
Due to the long time scale required to follow the complete binding process, it is not possible to say whether LF would go through a similar deformation in the simulation LFlow and whether BMP2 would lose more of its native structure in the simulation BMP2low. However, such deformations seemed to be more likely when the rutile surface was hydrophobic rather than hydrophilic based upon the greater number of protein–rutile contacts in LFlow and BMP2low.
Protein binding energies
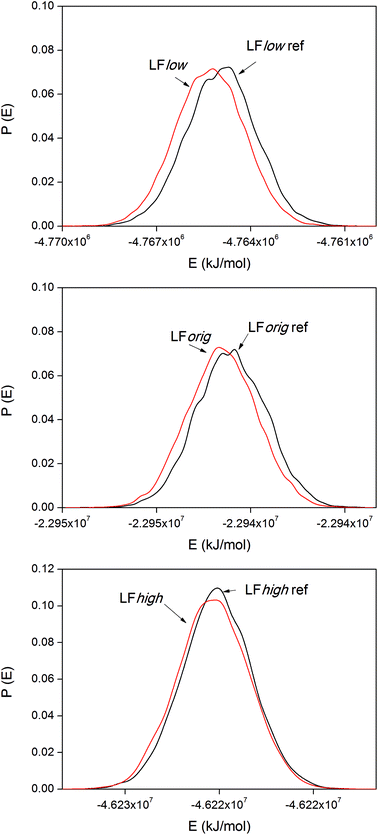
The internal energy of binding was calculated for both LF and BMP2 in combination with all three types of rutile surfaces. The potential energies were sampled every ps in all simulations. Based on visual observations of the simulations and the initial trends found in the data, the first 9 ns were taken as equilibration for both the reference simulations and the binding simulations and the data therefore represent times t > 9 ns. Distribution functions of the system potentials of the LF simulations are displayed in Fig. 8.The system potential energy is shifted towards lower values when LF binds to the rutile surface, indicating that the protein binding is energetically favored for all three types of rutile surface. The binding energies for the three LF systems are displayed in Table 3. It should be remembered that the absolute values of the binding energies are not necessarily correct due to the use of positional restraints on the proteins in the reference simulations and only corresponds to binding of one side of the protein. Still, a clear and consistent trend can be seen in all the three systems. The absolute value of the binding energy decreases with higher atomic charge amplitudes of rutile, i.e. the binding is stronger to a more hydrophobic surface. However, note that the standard deviations of the binding energies are relatively large. In the third column of Table 3, the LFlow system has been used as a reference to which the other two systems are compared. It can be seen that the binding of LF to rutile is less exothermic by 70 and 240 kJ mol−1 in LForig and LFhigh, respectively, than in the LFlow system.
| System | ΔEbind [kJ mol−1] | ΔΔEbind,m-low [kJ mol−1] |
|---|---|---|
| LFlow | −360 ± 60 | 0 |
| LForig | −290 ± 40 | +70 |
| LFhigh | −120 ± 70 | +240 |
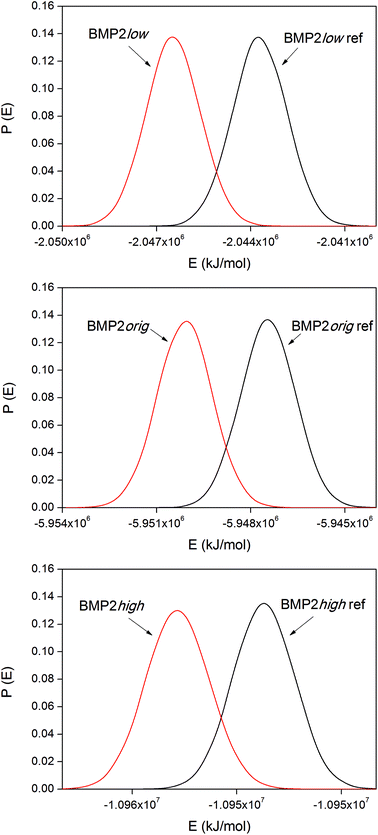
The corresponding distribution functions of the system potential energies for the BMP2 systems are displayed in Fig. 9. The smaller size of the BMP2 protein gave the possibility for longer simulations and better sampling compared to that for lactoferrin. This resulted in smoother distribution functions for BMP2 but the trend in the binding energies, as shown in Table 4, is the same as that for LF. The trend is consistent between the simulations with the low original and high rutile surfaces as BMP2. The relative binding energies, ΔΔEbind,m–n, in Tables 3 and 4 were compared among the BMP2 and LF systems. We can see that both proteins exhibit the most exothermic binding to the hydrophobic rutile surface “low”. The relative binding energies are also similar in amplitude – roughly +100–150 kJ mol−1 when changing the rutile surface from low→orig.→high.
| System | ΔEbind [kJ mol−1] | ΔΔEbind,m-low [kJ mol−1] |
|---|---|---|
| BMP2low | −2760 ± 40 | 0 |
| BMP2orig | −2650 ± 25 | +110 |
| BMP2high | −2430 ± 100 | +330 |
Discussion
Binding of human lactoferrin and human bone morphogenetic protein-2 to hydroxylated TiO2 rutile surfaces has been studied using MD simulations. The main aim was to determine whether the hydrophobicity of the rutile surface affects the protein binding process. The hydrophobicity of rutile was changed simply by down-scaling or up-scaling the charges of the rutile atoms, while making sure that the charge neutrality of the surface is kept as a whole. Both the hydrophobic and hydrophilic amino acids interact with the rutile surface. Some hydrophilic charged residues including arginine, glutamic acid and lysine were found to have strong interactions in all of the studied surfaces. It proves that strong electrostatic interactions with titanium dioxide surface are responsible for the binding, which has also been reported in the literature.14,27,28 Moreover, clear protein deformation was observed when proteins bind to the most hydrophobic surface, which is in agreement with both computational and experimental studies.3,13 BMP-2 has a higher degree of deformation and stronger binding compared with LF when it is bound to the more hydrophobic rutile surface. For BMP-2, one of its monomers underwent large structural rearrangements in order to increase its contact area with rutile, which has also been found when its monomer was bound to graphite.29 In contrast, LF shows a less deformed structure when bonded, which may be attributed to its inherent less flexibility due to its large molecular weight and more compact structure compared with the BMP-2 dimer. Protein binding to the more hydrophilic surfaces was markedly different. Water competes with the proteins for the interaction with the hydrophilic rutile surface, which results in rutile being almost completely covered with water molecules. The proteins are pushed further away from rutile and most contacts with rutile must occur indirectly via interactions with the water layer on top of the rutile surface. However, some direct contacts also occur but these are dominated by charged amino acids.The longer protein–rutile distance and the fewer contacts between the protein and the rutile surface for a hydrophilic rutile surface affected the binding energies. Binding to the hydrophobic “low” rutile surface resulted in the largest decrease in the system potential, while binding to the more hydrophilic “original” and “high” surfaces resulted in successively smaller decreases in the system's potential energy. This trend was the same between both proteins. We therefore conclude that, from a purely energetic perspective, both LF and BMP2 have stronger binding to a more hydrophobic rutile surface. However the Gibbs free energy of binding should have been calculated rather than binding energies but such an analysis was simply not possible for these large systems, containing on the order of 100![[thin space (1/6-em)]](https://www.rsc.org/images/entities/char_2009.gif) 000 atoms. Obviously it is difficult to conclude whether the entropic effect on the binding is favorable or unfavorable.30–32 The entropy gain caused by water mobility and displacement will become compensated by a considerable loss of entropy due to the reduced protein mobility when it is restricted on a two-dimensional surface.33 However, we can argue that the entropic term would in fact “favor” the protein binding to hydrophobic rutile surfaces rather than to hydrophilic involving a larger entropy gain. Both LF and BMP2 replace water molecules at the rutile surface to a much higher degree for the hydrophobic surface. These water molecules, first removed from the relatively immobile hydration layer on the rutile surface, will successively regain the mobility of bulk water and to a smaller extent even while hydrating the protein. This gives a net entropic gain to the hydrophobic surface over the hydrophilic surface. At the same time, the hydrophobic amino acids can also more freely move relative to the hydrophobic interface. This overall entropy increase for both water and protein with a simultaneous minor change in enthalpy should in turn lower the free energy. Although we cannot at the moment prove this with calculations, we hope that when the free energy calculations for protein adsorbed on metal surface becomes a reality they would prove us right.
000 atoms. Obviously it is difficult to conclude whether the entropic effect on the binding is favorable or unfavorable.30–32 The entropy gain caused by water mobility and displacement will become compensated by a considerable loss of entropy due to the reduced protein mobility when it is restricted on a two-dimensional surface.33 However, we can argue that the entropic term would in fact “favor” the protein binding to hydrophobic rutile surfaces rather than to hydrophilic involving a larger entropy gain. Both LF and BMP2 replace water molecules at the rutile surface to a much higher degree for the hydrophobic surface. These water molecules, first removed from the relatively immobile hydration layer on the rutile surface, will successively regain the mobility of bulk water and to a smaller extent even while hydrating the protein. This gives a net entropic gain to the hydrophobic surface over the hydrophilic surface. At the same time, the hydrophobic amino acids can also more freely move relative to the hydrophobic interface. This overall entropy increase for both water and protein with a simultaneous minor change in enthalpy should in turn lower the free energy. Although we cannot at the moment prove this with calculations, we hope that when the free energy calculations for protein adsorbed on metal surface becomes a reality they would prove us right.
Conclusions
Interactions of two proteins: human lactoferrin (LF), which has antibacterial activity and is a part of the immune system of our body, and human bone morphogenetic protein-2 (BMP2), which is important in the development of bones and cartilage, with a hydroxylated TiO2 rutile (110) surface have been studied using MD simulations to find out the effect of hydrophobicity of the rutile surface on the protein binding process. The hydrophobic character and the hydrophilic character, respectively, were created by adjusting the rutile atomic charges. For both the proteins the binding to the hydrophobic rutile surface was through direct contact between the protein and rutile via both hydrophobic and hydrophilic amino acids. While binding in this way both the proteins underwent structural rearrangements, observed more strongly in BMP2. In binding to the hydrophilic rutile surface there was a hydration layer of water molecules between the rutile surface and the proteins. Both LF and BMP2 exhibited a higher binding strength to the hydrophobic rutile surfaces than to the hydrophilic surfaces.Acknowledgements
This work has been supported work by the Swedish Science Council. Computations were performed using resources provided by the Swedish National Infrastructure for Computing (SNIC) at PDC, HPC2N, and NSC.References
- D. Costa, P. A. Garrain and M. Baaden, Understanding small biomolecule-biomaterial interactions: a review of fundamental theoretical and experimental approaches for biomolecule interactions with inorganic surfaces, J. Biomed. Mater. Res. A, 2013, 101A, 1210–1222 CrossRef CAS PubMed.
- A. A. Skelton, T. N. Liang and T. R. Walsh, Interplay of sequence, conformation, and binding at the peptide-titania interface as mediated by water, ACS Appl. Mater. Interfaces, 2009, 1, 1482–1491 CAS.
- T. Utesch, G. Daminelli and M. A. Mroginski, Molecular dynamics simulations of the adsorption of bone morphogenetic protein-2 on surfaces with medical relevance, Langmuir, 2011, 27, 13144–13153 CrossRef CAS PubMed.
- C. Y. Wu, M. J. Chen and C. Xing, Molecular understanding of conformational dynamics of a fibronectin module on rutile (110) surface, Langmuir, 2010, 26, 15972–15981 CrossRef CAS PubMed.
- J. C. Jose and N. Sengupta, Molecular dynamics simulation studies of the structural response of an isolated a beta(1–42) monomer localized in the vicinity of the hydrophilic tio2 surface, Eur. Biophys. J. Biophys. Lett., 2013, 42, 487–494 CrossRef CAS PubMed.
- H. P. Zhang, X. Lu, Y. Leng, F. Watari, J. Weng and B. Feng, et al., Effects of aqueous environment and surface defects on arg–gly–asp peptide adsorption on titanium oxide surfaces investigated by molecular dynamics simulation, J. Biomed. Mater. Res. A, 2011, 96A, 466–476 CrossRef CAS PubMed.
- P. Roach, D. Eglin, K. Rohde and C. C. Perry, Modern biomaterials: A review-bulk properties and implications of surface modifications, J. Mater. Sci. Mater. Med., 2007, 18, 1263–1277 CrossRef CAS PubMed.
- W. Teughels, N. Van Assche, I. Sliepen and M. Quirynen, Effect of material characteristics and/or surface topography on biofilm development, Clin. Oral Implants Res., 2006, 17(Suppl 2), 68–81 CrossRef PubMed.
- M. Dettin, A. Bagno, R. Gambaretto, G. Iucci, M. T. Conconi and N. Tuccitto, et al., Covalent surface modification of titanium oxide with different adhesive peptides: Surface characterization and osteoblast-like cell adhesion, J. Biomed. Mater. Res. A, 2009, 90, 35–45 CrossRef PubMed.
- X. Chen and S. S. Mao, Titanium dioxide nanomaterials: Synthesis, properties, modifications, and applications, Chem. Rev., 2007, 107, 2891–2959 CrossRef CAS PubMed.
- Y. Arima and H. Iwata, Effects of surface functional groups on protein adsorption and subsequent cell adhesion using self-assembled monolayers, J. Mater. Chem., 2007, 17, 4079–4087 RSC.
- D. E. MacDonald, N. Deo, B. Markovic, M. Stranick and P. Somasundaran, Adsorption and dissolution behavior of human plasma fibronectin on thermally and chemically modified titanium dioxide particles, Biomaterials, 2002, 23, 1269–1279 CrossRef CAS.
- P. Roach, D. Farrar and C. C. Perry, Interpretation of protein adsorption: surface-induced conformational changes, J. Am. Chem. Soc., 2005, 127, 8168–8173 CrossRef CAS PubMed.
- Y. Kang, X. Li, Y. Q. Tu, Q. Wang and H. Agren, On the mechanism of protein adsorption onto hydroxylated and nonhydroxylated tio2 surfaces, J. Phys. Chem. C, 2010, 114, 14496–14502 CAS.
- C. Y. Wu, M. J. Chen, A. A. Skelton, P. T. Cummings and T. Zheng, Adsorption of arginine-glycine-aspartate tripeptide onto negatively charged rutile (110) mediated by cations: the effect of surface hydroxylation, ACS Appl. Mater. Interfaces, 2013, 5, 2567–2579 CAS.
- M. Tomita, H. Wakabayashi, K. Shin, K. Yamauchi, T. Yaeshima and K. Iwatsuki, Twenty-five years of research on bovine lactoferrin applications, Biochimie, 2009, 91, 52–57 CrossRef CAS PubMed.
- A. V. Bandura and J. D. Kubicki, Derivation of force field parameters for tio2-h2o systems from a initio calculations, J. Phys. Chem. B, 2003, 107, 11072–11081 CrossRef CAS.
- M. Predota, A. V. Bandura, P. T. Cummings, J. D. Kubicki, D. J. Wesolowski and A. A. Chialvo, et al., Electric double layer at the rutile (110) surface. 1. Structure of surfaces and interfacial water from molecular dynamics by use of ab initio potentials, J. Phys. Chem. B, 2004, 108, 12049–12060 CrossRef CAS.
- B. Hess, C. Kutzner, D. van der Spoel and E. Lindahl, Gromacs 4: Algorithms for highly efficient, load-balanced, and scalable molecular simulation, J. Chem. Theory Comput., 2008, 4, 435–447 CrossRef CAS.
- W. L. Jorgensen, J. Chandrasekhar, J. D. Madura, R. W. Impey and M. L. Klein, Comparison of simple potential functions for simulating liquid water, J. Chem. Phys., 1983, 79, 926–935 CrossRef CAS PubMed.
- B. F. Qiao, M. Sega and C. Holm, Properties of water in the interfacial region of a polyelectrolyte bilayer adsorbed onto a substrate studied by computer simulations, Phys. Chem. Chem. Phys., 2012, 14, 11425–11432 RSC.
- C. Yang, C. W. Peng, D. H. Zhao, C. Y. Liao, J. Zhou and X. H. Lu, Molecular simulations of myoglobin adsorbed on rutile (110) and (001) surfaces, Fluid Phase Equilib., 2014, 362, 349–354 CrossRef CAS PubMed.
- U. Essmann, L. Perera, M. L. Berkowitz, T. Darden, H. Lee and L. G. Pedersen, A smooth particle mesh ewald method, J. Chem. Phys., 1995, 103, 8577–8593 CrossRef CAS PubMed.
- M. Panos, T. Z. Sen and M. G. Ahunbay, Molecular simulation of fibronectin adsorption onto polyurethane surfaces, Langmuir, 2012, 28, 12619–12628 CrossRef CAS PubMed.
- J. Q. Zhang, T. Y. Sun, L. J. Liang, T. Wu and Q. Wang, Drug promiscuity of p-glycoprotein and its mechanism of interaction with paclitaxel and doxorubicin, Soft Matter, 2014, 10, 438–445 RSC.
- B. F. Qiao, J. J. Cerda and C. Holm, Atomistic study of surface effects on polyelectrolyte adsorption: case study of a poly(styrenesulfonate) monolayer, Macromolecules, 2011, 44, 1707–1718 CrossRef CAS.
- S. Monti, V. Carravetta, W. H. Zhang and J. L. Yang, Effects due to interadsorbate interactions on the dipeptide/tio2 surface binding mechanism investigated by molecular dynamics simulations, J. Phys. Chem. C, 2007, 111, 7765–7771 CAS.
- Z. Xu, X. W. Liu, Y. S. Ma and H. W. Gao, Interaction of nano-tio2 with lysozyme: insights into the enzyme toxicity of nanosized particles, Environ. Sci. Pollut. Res. Int., 2010, 17, 798–806 CrossRef CAS PubMed.
- C. Mucksch and H. M. Urbassek, Adsorption of bmp-2 on a hydrophobic graphite surface: a molecular dynamics study, Chem. Phys. Lett., 2011, 510, 252–256 CrossRef PubMed.
- R. Friedman, E. Nachliel and M. Gutman, Fatty acid binding proteins: Same structure but different binding mechanisms? Molecular dynamics simulations of intestinal fatty acid binding protein, Biophys. J., 2006, 90, 1535–1545 CrossRef CAS PubMed.
- M. Mijajlovic, M. J. Penna and M. J. Biggs, Free energy of adsorption for a peptide at a liquid/solid interface via nonequilibrium molecular dynamics, Langmuir, 2013, 29, 2919–2926 CrossRef CAS PubMed.
- F. Y. Lin, W. Y. Chen and M. T. W. Hearn, Microcalorimetric studies on the interaction mechanism between proteins and hydrophobic solid surfaces in hydrophobic interaction chromatography: Effects of salts, hydrophobicity of the sorbent, and structure of the protein, Anal. Chem., 2001, 73, 3875–3883 CrossRef CAS.
- N. Ben-Tal, B. Honig, C. K. Bagdassarian and A. Ben-Shaul, Association entropy in adsorption processes, Biophys. J., 2000, 79, 1180–1187 CrossRef CAS.
Footnote |
| † Electronic supplementary information (ESI) available. See DOI: 10.1039/c4bm00021h |
| This journal is © The Royal Society of Chemistry 2014 |

