Quantitative measurements of thermodynamics and kinetics of polythiophene–DNA complex formation in DNA detection†
Weiming
Zheng‡
and
Lin
He
*
Department of Chemistry, North Carolina State University, Raleigh, NC 27695, USA. E-mail: Lin_He@ncsu.edu; Fax: +1-919-515-8920; Tel: +1-919-515-2993
First published on 14th July 2014
Abstract
Cationic polythiophene derivatives have been used as unique optical probes for various biosensing applications with great success, because their optical responses are sensitive to the conformational changes from binding to single-stranded DNA (ssDNA) to binding to double-stranded DNA (dsDNA). It has long been suggested that the binding of cationic polymers to DNA has a major impact on the thermodynamics and kinetics of DNA hybridization; yet a quantitative assessment is lacking. We report here a systematic study to quantitatively measure the thermodynamic binding constants and hybridization rates of DNA duplexes in the presence/absence of cationic polythiophene. Our results show that the dissociation constant of dsDNA in the presence of polythiophene is three orders of magnitude smaller than that in the absence of polymers. The formation of the DNA/polymer triplex is also much slower than double helical DNA formation, suggesting a rate-limiting polymer–ssDNA dissociation step prior to DNA hybridization. The hybridization rate constant is further slowed down when polymer/DNA hybridization occurs on a solid surface due to steric hindrance. Having a means to quantitatively assess the DNA hybridization efficiency in the presence of cationic polymers, we were able to improve the DNA sensing performance through a combined tuning of reaction temperature and time.
Introduction
The delocalized electronic structure of conjugated polymers offers several advantages over small dye molecules as optical probes, including effective light harvesting, superior signal amplification, and hypersensitive to minor environmental perturbation.1,2 Of various fluorescent conjugated polymers reported to date for biosensing, cationic conjugated polythiophene derivatives (PTs) are of particular interest due to their unique conformation-dependent optical signature between binding to single-stranded DNA (ssDNA) and to double-stranded DNA (dsDNA). They have hence been successfully used as coupling-free optical probes for detection of DNA hybridization with high sensitivity and selectivity.3–7Electrostatic repulsion plays an important role in DNA duplex formation. Electrostatic attraction, on the other hand, is the primary binding force between cationic polythiophene derivatives and negatively charged DNA molecules. It is reasonable to suspect, and has since been observed, that thermodynamic and kinetic behaviors of DNA duplexes would change significantly in the presence of positively charged polymers. A systematic study of thermodynamics and hybridization kinetic properties of cationic conjugated polymer–DNA complexes is therefore essential to understand and control the interaction between cationic polymers and DNA at the molecular level for effective assay optimization subsequently. Despite its importance, however, such a study is rather limited in the literature.4,8
In this report we describe quantitative measurements of thermodynamic stability of cationic polythiophene derivative–DNA complexes and hybridization kinetics of polymer–dsDNA formation. The thermodynamic properties of conjugated polymer–DNA complexes were studied by monitoring the melting parameters of the complexes in which the thermodynamic constants were directly derived. Hybridization kinetics of polymer bound-DNA was studied by in situ measuring of fluorescence intensity changes during DNA hybridization in the presence of polythiophene. Hybridization rate constants of polymer-present DNA hybridization in solution and on a solid carrier were compared side by side.
Experimental section
Materials
Cationic conjugated polythiophene derivatives, poly(1H-imidazolium, 1-methyl-3-[2-[(4-methyl-3-thienyl)oxy]ethyl]-bromide), were prepared according to the published procedure.4,5 The synthesized conjugated polymers have an average molecular weight of 6–10 kDa, which corresponds to approx. 20–30 monomer units, as previously characterized in the literature.4 Amino-functionalized silica nanoparticles (100 nm in diameter and 1.96 g mL−1 in density) were prepared using the published procedure.9 Sulfosuccinimidyl 4-[N-maleimidomethyl]cyclohexane-1-carboxylate (sulfo-SMCC) was purchased from Pierce (Rockford, IL). 2-(Cyclohexylamino)ethanesulfonic acid (CHES), trisodium phosphate, disodium hydrogen phosphate, and monosodium phosphate were purchased from Sigma-Aldrich (St. Louis, MO). All oligonucleotides were purchased from Integrated DNA Technologies (Coralville, IA). All DNA sequences used in the study were 15-mer oligonucleotides (see ESI, Table 1†). Upon receipt of thiolated DNA, the disulfide bond was cleaved with 100 mM of dithiothreitol (DTT, Sigma-Aldrich), and the reduced product was purified with a micro bio-spin 30 column from Bio-Rad (Hercules, CA).Preparation of conjugated polymer–DNA complexes
In a typical experiment, 10 μL of 100 μM capture DNA (5′-TAA CAA TAA TCC CTC, X1 or 5′-TAA CAA TAA TCC CTC A20-C3-SH, X1′) was mixed with 20 μL of conjugated polymers (∼750 μM is the concentration of repeating units, 1![[thin space (1/6-em)]](https://www.rsc.org/images/entities/char_2009.gif) :
:![[thin space (1/6-em)]](https://www.rsc.org/images/entities/char_2009.gif) 1 stoichiometric ratio to DNA X1 or X1′). This reaction ratio ensured an equivalent opposite charge in the mixture (i.e. 1
1 stoichiometric ratio to DNA X1 or X1′). This reaction ratio ensured an equivalent opposite charge in the mixture (i.e. 1![[thin space (1/6-em)]](https://www.rsc.org/images/entities/char_2009.gif) :
:![[thin space (1/6-em)]](https://www.rsc.org/images/entities/char_2009.gif) 1 positive-to-negative charge ratio in polymer–ssDNA complex formation). The total reaction volume was adjusted to 100 μL with 10 mM phosphate buffer (PB, pH 7.2) and the mixture was kept at room temperature for 30 min to form conjugated polymer–ssDNA duplexes.
1 positive-to-negative charge ratio in polymer–ssDNA complex formation). The total reaction volume was adjusted to 100 μL with 10 mM phosphate buffer (PB, pH 7.2) and the mixture was kept at room temperature for 30 min to form conjugated polymer–ssDNA duplexes.
To form conjugated polymer–dsDNA triplexes, the pre-formed polymer–ssDNA duplex solution was added to 10 μL of 100 μM target DNA (5′-GAG GGA TTA TTG TTA, Y1) and the mixture was incubated at 37 °C for 30 min to allow hybridization to occur (the resulting triplex complex has a positive-to-negative charge ratio of 1![[thin space (1/6-em)]](https://www.rsc.org/images/entities/char_2009.gif) :
:![[thin space (1/6-em)]](https://www.rsc.org/images/entities/char_2009.gif) 2 in the complex). Note that in the thermodynamic and kinetic studies, the concentration of polymer–ssDNA or polymer–dsDNA complexes refers to the theoretical concentration of complexes, which equals to that of DNA X1 or X1′, because both polythiophene and target DNA Y1 were added to the reaction mixture in stoichiometric ratios.
2 in the complex). Note that in the thermodynamic and kinetic studies, the concentration of polymer–ssDNA or polymer–dsDNA complexes refers to the theoretical concentration of complexes, which equals to that of DNA X1 or X1′, because both polythiophene and target DNA Y1 were added to the reaction mixture in stoichiometric ratios.
To form dsDNA duplexes without polymers, 10 μL of 100 μM X1 or X1′ was mixed with 10 μL of 100 μM Y1 in 80 μL PB buffer first. The mixture was then hybridized at room temperature overnight to form stable dsDNA duplexes.5,10
Attachment of conjugated polymer–ssDNA duplexes on silica nanoparticles
The polymer–ssDNA duplexes were immobilized on the silica nanoparticles using a sulfo-SMCC crosslinker to directly couple the thiol groups of capture DNA (5′-TAA CAA TAA TCC CTC A20-C3-SH, X1′) to the free amino groups on the particle surface. Specifically, 100 μL of 15 mg mL−1 amino-functionalized silica nanoparticles were washed twice with 10 mM of CHES buffer (pH 9.0) first. Sulfo-SMCC (1 mg) in 500 μL of CHES was added to the washed particles and incubated for 1 h. After centrifugation, the pelleted particles were again washed twice with CHES buffer and twice with PB buffer (10 mM). The washed particles were then resuspended in 500 μL of PB buffer. At the same time, 100 μL of 16 μM X1′ (35-mer) were pre-mixed with 75 μL of 750 μM conjugated polymers (1![[thin space (1/6-em)]](https://www.rsc.org/images/entities/char_2009.gif) :
:![[thin space (1/6-em)]](https://www.rsc.org/images/entities/char_2009.gif) 1 stoichiometric ratio) for 30 min to form the duplexes. The solution of polymer–ssDNA duplexes was then added into the particle solution and incubated overnight. After incubation, the particles were washed three times with PB buffer, and finally resuspended in 500 μL of PB buffer. UV absorbance at 260 nm of the supernatant showed little residual DNA in solution, suggesting that most polymer–ssDNA duplexes were immobilized on the particles. The concentration of immobilized polymer–ssDNA duplexes was calculated to be ∼3.2 μM. The surface density of immobilized duplexes was estimated to be ∼3 pmol cm−2 (for detailed calculation see ESI†).
1 stoichiometric ratio) for 30 min to form the duplexes. The solution of polymer–ssDNA duplexes was then added into the particle solution and incubated overnight. After incubation, the particles were washed three times with PB buffer, and finally resuspended in 500 μL of PB buffer. UV absorbance at 260 nm of the supernatant showed little residual DNA in solution, suggesting that most polymer–ssDNA duplexes were immobilized on the particles. The concentration of immobilized polymer–ssDNA duplexes was calculated to be ∼3.2 μM. The surface density of immobilized duplexes was estimated to be ∼3 pmol cm−2 (for detailed calculation see ESI†).
For hybridization on particle surfaces, 20 μL of as prepared polymer–ssDNA duplex bound silica nanoparticle solution was mixed with 10 μL of 5 μM target DNA (Y1) for 0–2 h, as specified in the text, prior to washes.
UV absorbance measurements
The melting curves of dsDNA, polymer–ssDNA duplexes, and polymer–dsDNA triplexes were recorded using a Hewlett-Packard Model 8435 spectrophotometer. A solution of the solvent without polymer or DNA was used as the blank. The melting curves were recorded at a linear heating rate of 1 °C min−1 and a measurement step of 2 °C per increment. The solution absorbance at 260 nm was used to plot the thermal melting curves. The absorbance at 500 nm was used to monitor polymer–ssDNA complex formation as well.Circular dichroic measurements
Circular dichroic (CD) spectra of dsDNA, polymers, polymer–ssDNA duplexes, and polymer–dsDNA triplexes were obtained using a Jasco J-600 spectropolarimeter (Japan Spectronic Co. Ltd). All measurements were carried out in a 10 mM PB solution at 45 °C in a cylindrical quartz cell with a path length of 1 cm. Each spectrum was scanned between 190 nm and 600 nm, and accumulated from 10 separate measurements. The bandwidth of the spectropolarimeter was set at 1.0 nm, the sensitivity at 5 mdeg, the response time at 1 s, the scanning speed at 500 nm min−1, and the step resolution at 1 nm.Fluorescence measurements
Fluorescence spectra were collected using a PerkinElmer LS 50B luminescence spectrometer. The excitation wavelength was set at 420 nm with an excitation slit width of 15 nm, and the emission at 505 nm was monitored with an emission slit width of 20 nm. The hybridization kinetic curve was recorded by monitoring the fluorescence intensities of polythiophene at 505 nm as a function of the hybridization time. When a plateau value was recorded with no further change over time, the hybridization reaction was considered to have reached the equilibrium. The kinetic analysis of conjugated polymer–DNA hybridization was carried out by determining the association rate constant, ka, from the nonlinear least squares fitting of the plots of fluorescence intensity versus time.11Results and discussion
The cationic polythiophene derivative-based label-free DNA detection relies on different conformations of conjugated polymers when they bind to ssDNA or dsDNA via electrostatic interaction. As previously reported (Scheme 1 and ESI Fig. 1†),4,5 when the cationic polymers are mixed with ssDNA, the color of the solution changes from yellow to red and the fluorescence of the polymer is strongly quenched. It is due to the formation of polymer–ssDNA duplexes primarily via electrostatic interaction where the conformation of polymers changes from random coil to a straight linear structure with most positive charges facing towards ssDNA. This conformational change allows efficient transfer of excited electrons between conjugated polymers and ssDNA, making nonradiative relaxation the more favorable pathway for energy dissipation. Neutralization of positive charges on polymers could also induce possible aggregation of polymer chains through hydrophobic interaction, which results in additional inter-chain quenching, another possible cause for the reduced fluorescence emission of polymer–ssDNA proposed in the literature. However, because of the lack of precipitation observed over an extended time period, the formation of aggregates was deemed negligible in our system4,8 and their contribution to melting curves and kinetics studies was not considered in the following discussion. When DNA of the complementary sequence is added into the polymer–ssDNA duplex solution, the color of the solution goes back to yellow and fluorescence of the polymer solution is restored, primarily because of polymer chains relaxing back to a more helical-like conformation.12 This helical conformation reduces polymer–DNA linear alignment and hence restores radiative relaxation of excited electrons. It is this readily switchable conformation of conjugated polymers between binding to ssDNA and dsDNA that makes them an ideal optical probe to study DNA binding processes.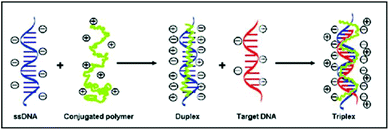 | ||
| Scheme 1 Illustration of binding of cationic polythiophene to ssDNA and subsequently complementary DNA during hybridization. | ||
Various techniques have been used to quantify polymer–DNA complexes, free polymers, and free nucleic acids in situ. Absorbance spectroscopy, for example, has been used to measure system hypochromicity. Circular dichroic spectrometry (CD), calorimetry, and nuclear magnetic resonance (NMR) are other techniques that have been successfully employed.13–17 In addition, because cationic polythiophene derivatives exhibit the unique optical emission signatures during the formation of polymer–DNA complexes, fluorescence has been a powerful technique to directly monitor the formation of polymer–DNA complexes. In this study, absorbance, fluorescence, and CD are the primary techniques used to study the thermodynamic and kinetic behaviors of polymer–DNA complexes.
It is known that some ions induce the Hofmeister effect on cationic polythiophene derivatives and cause aggregation at high concentrations.8 Selection of a phosphate-based buffer and a low operating ionic strength allowed us to introduce minimal arbitrary interference on polymer conformation changes. In addition, while high salt conditions are often used during DNA hybridization to reduce electrostatic repulsion of DNA strands, we found that DNA hybridization occurred without any problem in 10 mM PB because positively charged polythiophene in our system acts as the counter “ions” to neutralize the negative charges of ssDNA it binds to. A high salt concentration (>0.1 M) actually reduces fluorescence emission of polymer–dsDNA triplexes and adversely affects detection sensitivity of the system (data not shown). Consequently, all measurements were conducted in the same 10 mM PB buffer solution throughout our study to mitigate buffer interference and render the results more comparable across the board.
Thermodynamic stability of polymer–DNA complexes
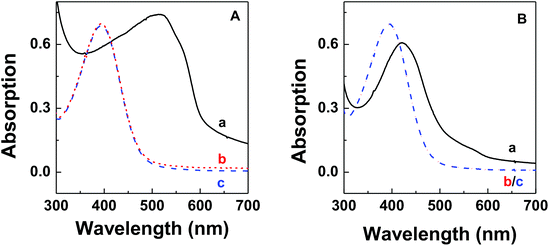
The thermodynamic stability of polymer–DNA complexes was studied by measuring their melting curves under different conditions. Using absorption spectroscopic means to monitor the melting behavior of DNA molecules has been widely used in the characterization of other polyelectrolyte–dsDNA complexes. Fig. 1 shows the representative absorption spectra of polymer–DNA complexes before and after heat-induced dissociation. The polymer absorption peaks at ∼500 nm and ∼450 nm for polymer–ssDNA (Fig. 1A) and polymer–dsDNA (Fig. 1B), respectively, were clearly blue-shifted to 397 nm upon heating. The fact that curve b (after dissociation) in both panels is in perfect overlap with curve c of free polymer in the absence of DNAs confirms the characteristic 397 nm peak of free polymers and complete dissociation of polymer–DNA complexes in both cases.Similar to conventional DNA melting studies, the thermodynamic stability of polymer–DNA complexes is defined by the melting temperature, Tm, the temperature at which a dissociation fractional value, α, equals 0.5:
 | (1) |
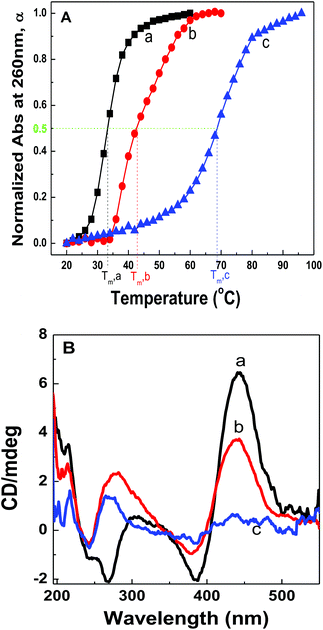
Fig. 2A shows the plots of α against solution temperatures for dsDNA duplexes, polymer–ssDNA duplexes and polymer–dsDNA triplexes in the 10 mM PB buffer. Direct comparison of the melting experiments of polymer–ssDNA duplexes and dsDNA duplexes reveals that polymer–ssDNA duplexes are, as expected, more stable, dissociating at approximately 9 °C higher than dsDNA duplexes. It is interesting to note a change of slope in the polymer–ssDNA melting curve, probably caused by the additional conformational change of PT from a more rigid, planar state to a random, coil form, which is unique to PT–ssDNA complexes. The speculation is supported by the perfect two-state sigmoidal fitting of the melting curve and above 50 °C the overlap of the melting curve of 500 nm where PT is the only absorbing species (ESI Fig. 2†). While it is clear that multiple processes may be ongoing during PT–ssDNA dissociation, it is a challenging task to isolate each conformational reorganization process because of their intertwined nature. As such, a simple sigmoid fitting of the PT–ssDNA melting curve is used to roughly estimate the overall melting temperature of PT–ssDNA complexes.
Polymer–dsDNA triplexes are found to be the most stable among the three with a Tm of approx. 70 °C. The qualitative observation that positively charged polymers stabilize DNA duplexes is supported by the literature report where polyLysine is also found to improve the stability of dsDNAs.13,14 It is interesting to note that there is only one inflection point in the melting curve of polythiophene–dsDNA triplexes, suggesting that unwrapping of polymers from dsDNA is the rate-limiting step where dehybridization of dsDNA and any additional polymer conformational rearrangement are overshadowed by the initial dissociation of PT–dsDNA.
CD spectra of polymer–dsDNA triplexes at different temperatures also support the notion for a single transition temperature during polymer–dsDNA dissociation. As shown in Fig. 2B, at 45 °C, the triplexes were stable with both CD spectra features in the 190–300 nm and 450 nm regions, corresponding to the signature α-helix of dsDNA duplexes and the loose helical structure of polythiophene wrapping around DNA duplexes. At 75 °C, however, the intensities of both features dropped simultaneously, consistent with the expected dissociation of polymers and dsDNA. Continuous heating of the solution to 90 °C resulted in disappearance of both features, indicating full dissociation of triplexes.
Advancing beyond simple qualitative characterization, the thermodynamic parameters of conjugated polymer–DNA complexes can be derived from the concentration-dependent melting study.18,19 Specifically, multiple melting curves were obtained by varying the concentrations of the complexes to be studied, i.e. dsDNA, polymer–ssDNA (rough estimation from single sigmoid fitting) or polymer–dsDNA. 1/Tm was calculated for each melting curve and the results were plotted as a function of the complex concentration. The obtained plot was then fit to the following equation:
 | (2) |
| ΔG° = ΔH° − TΔS° | (3) |
 | (4) |
Plots of 1/Tm as a function of concentration (ln(Ct)) for dsDNA duplexes, polymer–ssDNA duplexes and polymer–dsDNA triplexes are shown in Fig. 3. Based on eqn (3) and (4), the thermodynamic data for each DNA complexes were calculated and summarized in Table 1. It is clear that both the enthalpies and the entropies of the polymer bound-DNA complexes changed significantly from those of pure dsDNA complexes, a result of change in binding forces and increased system chaos upon dissociation. Direct comparison of the ΔG°298 values shows that the presence of cationic polythiophene stabilizes dsDNA by ∼4 kcal mol−1, corresponding to >2 orders of magnitude lower in the dissociation constant than that of polymer–ssDNA duplexes, and 3 orders of magnitude more stable than that of dsDNA duplexes alone. It is this difference in thermodynamic stability between polymer–ssDNA duplexes and polymer–dsDNA triplexes that allows effective reduction of non-specific binding from non-complementary annealing on the sensor surface by increasing the incubation temperature.
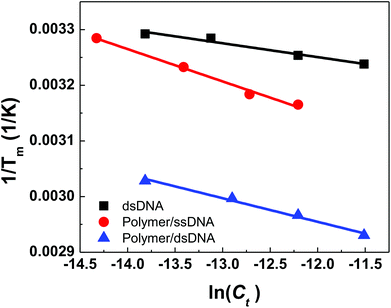 | ||
| Fig. 3 Thermodynamic analysis of concentration-dependent melting data for dsDNAs, polymer–ssDNA duplexes, and polymer–dsDNA triplexes. | ||
Hybridization kinetics of conjugated polymer-bound DNA complexes
Kinetics of conjugated polymer-bound DNA hybridization is monitored by real-time fluorescence measurements. Because the conjugated polymer–ssDNA duplexes were pre-made in the study, the hybridization reaction can be treated as a bimolecular reaction similar to that was used in the kinetic study of conventional DNA hybridization.11 The stoichiometric relationship for the conjugated polymer bound-DNA hybridization in solution is given as| Cdup. + Ct = Ctri. | (5) |
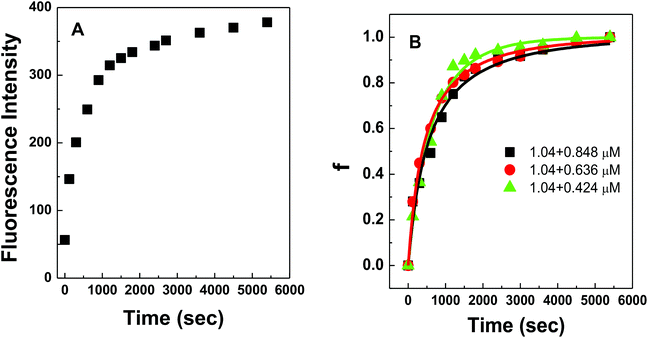
Fig. 4A shows the representative hybridization kinetic curve of conjugated polymer-bound DNA in the solution phase where fluorescence intensities of the hybridized mixture are plotted against reaction time. During the first 30 min reaction, the fluorescence intensity of the solution increased rapidly, indicating positive formation of polymer–dsDNA triplexes via hybridization. The curve slowly leveled off with little change in signal over the next 60 min until the hybridization reaction reached the equilibrium. A fractional value, f, is calculated based on the measured fluorescence intensity (I), the initial fluorescence intensity of solution at time zero (I0), and the fluorescence intensity at equilibrium (I∧) to quantify the hybridization kinetic data. Given the fact that polymer–ssDNA had little fluorescence and the fluorescence increase was linear to the concentration of hybridized triplexes in the range measured, the value of f represents the ratio of the concentration of triplexes at a given time (Ctri) to the concentration of triplexes at equilibrium (C∧tri):
 | (6) |
Therefore, the value f defines the extent of formation of polymer–dsDNA by hybridization reaction at any time. At time zero, f = 0, whereas at the equilibrium, f = 1. For hybridization in the solution phase, a bimolecular reaction mechanism to determine the association constant, ka, is the following equation where f was fit as a function of time according to the literature procedures:11
 | (7) |
Fig. 4B shows experimental results obtained for three different solution-based reaction conditions as well as the fits of these results with the bimolecular kinetic model according to eqn (7). Based on the fitting equation, an average ka value of 1.9 × 10³ M−1 s−1 was obtained for 15-mer DNA hybridization in the presence of polythiophene in 10 mM PB buffer. This value is more than 2 orders of magnitude lower than the reported hybridization constant of 6.4 × 10⁵ M−1 s−1 for a 16-mer DNA,20 suggesting that the steric hindrance induced by the presence of conjugated polythiophene around the single strand DNA is more pronounced than its charge shielding effect, resulting in an overall slower and less effective DNA hybridization when ssDNA is pre-bound with cationic conjugated polymers.
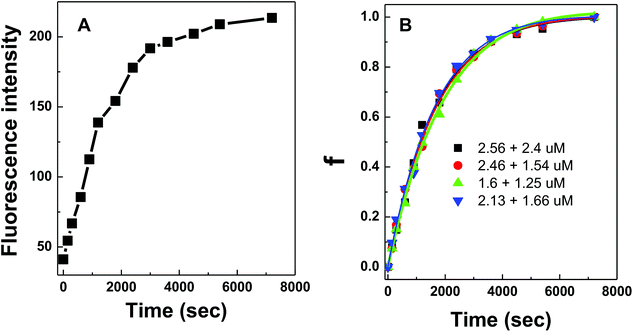
DNA hybridization was further impeded when the DNA probes were immobilized on a solid surface. Similarly, fluorescence curves were collected from the hybridization of target DNA to 100 nm silica nanoparticles coated with conjugated polymer-bound 15-mer DNA (Fig. 5A). The initial fitting of data using the same bimolecular kinetic model was unsuccessful because the presence of a solid surface introduced high steric constraints on the binding reactions by limiting (i) the suitable orientation of the binding reagent as it approaches towards the particle surface, (ii) the accessibility of the binding sites due to lateral interactions of neighboring molecules (i.e. crowding), and/or (iii) the necessary conformational change of surface bound molecules prior to binding.21,22 Due to such steric effects introduced by the particle surface, a biexponential kinetic model has been employed in the literature and is used here to describe the kinetics of solid-phase binding reactions:11
| f = 1 − a1e−b1t − (1 − a1)e−b2t | (8) |
 | (9) |
The experimental data from the conjugated polymer-bound DNA hybridization on a particle surface fit well with this biexponential model in which an initial fast reaction was followed by a secondary slow reaction (Fig. 5B). The ka0 values determined from four different particle-based reaction conditions show an averaged ka0 value of only 264 M−1 s−1. When compared to the solution-based association rate constant (1.9 × 10³ M−1 s−1), the hybridization rate of polymer bound-DNA on the particles is ∼7 folds slower. The level of decrease quantified in this case is in agreement with the reported decrease for those observed from traditional DNA hybridization on latex microparticles,11 regardless a long poly-A spacer used to extend the capture probes into the solution. Note that although the particle-based system used DNA probes with an extra 20-base spacer to extend the probes away from the surface, this extra spacer played little role in stabilizing/destabilizing the dsDNA complexes studied (ESI Fig. 3†).
For the solid phased reaction, where one binding partner is immobilized on a solid surface and the other molecule is in solution, the association rate constants are often heavily influenced by mass transport rates (or diffusion rates). To determine whether the polymer-bound DNA hybridization on the silica nanoparticles was binding limited or diffusion limited, the Damköhler number (Da) was calculated according to the following equation:23
 | (10) |
The obtained ka values allowed us to further compare the energetic barriers of polymer-bound DNA hybridization in the solution with that of hybridization in the particle phase using the Arrhenius equation:
 | (11) |
The temperature dependencies of polymer bound 15-mer DNA hybridization reaction were examined by recording the association curves at a number of different temperatures both in solution and on silica nanoparticles. Fitting of the plots of the resulting ln (ka) versus 1/T data (ESI Fig. 4†) led to the derived activation energies, Eact., of 11.31 kcal mol−1 for the solution phase and 13.14 kcal mol−1 for the particle phase, respectively (Table 2).
| T (°C) | Solution, ka (M−1 s−1) | Particle surface, ka0 (M−1 s−1) |
|---|---|---|
| 37 | 1900 | 264 |
| 45 | 2969 | 389 |
| 50 | 4158 | 531 |
| E act. (kcal mol−1) | 11.3 ± 0.9 | 13.1 ± 1.2 |
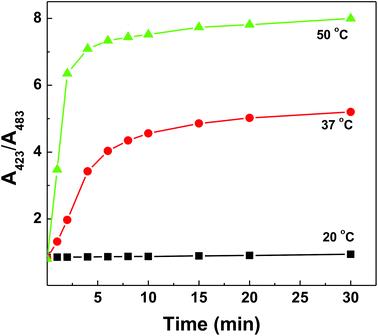
Together with an understanding that the polymer–dsDNA exhibits significantly improved thermostability but higher activation energy is needed for polymer-bound DNA hybridization to occur, we were able to improve the DNA sensing performance by simply increasing the incubation temperature (50 °C) and extending the incubation time (>30 min) for maximum hybridization efficiency (Fig. 6).
Conclusion
In this work, we have systematically investigated the thermodynamics and kinetics of formation of cationic polythiophene derivative–DNA complexes. The results show that electrostatic binding of cationic conjugated polymers significantly improves the thermodynamic stability of dsDNA duplexes, as evidenced in the measured melting curves and the calculated thermodynamic values. The polymer-bound DNA hybridization kinetics is directly monitored by the increase of fluorescence intensity of the reaction mixture as a result of formation of polymer–dsDNA triplexes. By fitting the hybridization data with a bimolecular kinetic model, an association constant (ka) value of 1.9 × 10³ M−1 s−1 for 15-mer DNA hybridization in the solution phase is obtained, much less than that of free DNA hybridization. Further reduction in binding constant is observed from the hybridization of polymer-bound DNA on the particle surface where a slower reaction and higher activation energy is measured, suggesting the dominant influence of steric hindrance on such reactions. Improved DNA detection sensitivity is achieved with increased incubation temperature and extended incubation time.Appendix
DNA sequences used in this work, calculation of the surface density of immobilized polymer–ssDNA duplexes on silica nanoparticles, UV-vis, fluorescence spectra of polymer–DNA complexes, sigmoidal fitting of PT–ssDNA dissociation, melting curves of dsDNA with/without A20 spacer, and Arrhenius plots for polymer–DNA complexes in solution and on the particle surface. This material is available free of charge on the publisher's website.Acknowledgements
We thank Dr William Darnell Graham from Biochemistry Department at NCSU for help in the use of the CD instrument. This work was partially supported by NSF (CHE-0644865 and CBET-1308949). L.H. acknowledges the IR/D support from NSF during the preparation of this manuscript.Notes and references
- S. Gunes, H. Neugebauer and N. S. Sariciftci, Chem. Rev., 2007, 107, 1324–1338 CrossRef PubMed.
- D. T. McQuade, A. E. Pullen and T. M. Swager, Chem. Rev., 2000, 100, 2537–2574 CrossRef CAS PubMed.
- P. Sista, K. Ghosh, J. S. Martinez and R. C. Rocha, J. Nanosci. Nanotechnol., 2014, 14, 250–272 CrossRef CAS PubMed.
- H. A. Ho, M. Boissinot, M. G. Bergeron, G. Corbeil, K. Dore, D. Boudreau and M. Leclerc, Angew. Chem., Int. Ed., 2002, 41, 1548–1551 CrossRef CAS.
- H. A. Ho, K. Doré, M. Boissinot, M. G. Bergeron, R. M. Tanguay, D. Boudreau and M. Leclerc, J. Am. Chem. Soc., 2005, 127, 12673–12676 CrossRef CAS PubMed.
- W. Zheng and L. He, J. Am. Chem. Soc., 2009, 131, 3432–3433 CrossRef CAS PubMed.
- X. Liu, Q. Fan and W. Huang, Biosens. Bioelectron., 2011, 26, 2154–2164 CrossRef CAS PubMed.
- M. Qiu, S. Long, B. Li, L. Yan, W. Xie, Y. Niu, X. Wang, Q. Guo and A. Xia, J. Phys. Chem. C, 2013, 117, 21870–21878 CAS.
- Z. Wu, H. Xiang, T. Kim, M.-S. Chun and K. Lee, J. Colloid Interface Sci., 2006, 304, 119–124 CrossRef CAS PubMed.
- W. Zheng, T. E. Chase and L. He, Anal. Methods, 2014, 6, 2399–2405 RSC.
- M. R. Henry, P. W. Stevens, J. Sun and D. M. Kelso, Anal. Biochem., 1999, 276, 204–214 CrossRef CAS PubMed.
- K. P. R. Nilsson and O. Inganäs, Nat. Mater., 2003, 2, 419–424 CrossRef CAS PubMed.
- S. Katayose and K. Kataoka, Bioconjugate Chem., 1997, 8, 702–707 CrossRef CAS PubMed.
- A. Maruyana, H. Watanabe, A. Ferdous, M. Katoh, T. Ishihara and T. Akaike, Bioconjugate Chem., 1998, 9, 292–299 CrossRef PubMed.
- A. Blaskó, R. O. Dempcy, E. E. Minyat and T. C. Bruice, J. Am. Chem. Soc., 1996, 118, 7892–7899 CrossRef.
- D. J. Patel, A. Pardi and K. Itakura, Science, 1982, 216, 581–590 CAS.
- K. J. Breslauer, R. Frank, H. Blocker and L. A. Marky, Proc. Natl. Acad. Sci. U. S. A., 1986, 83, 3746–3750 CrossRef CAS.
- Y. You, A. V. Tataurov and R. Owczarzy, Biopolymers., 2011, 95, 472–486 CrossRef CAS PubMed.
- L. E. Morrison and L. M. Stols, Biochemistry, 1993, 32, 3095–3104 CrossRef CAS.
- K. M. Parkhurst and L. J. Parkhurst, Biochemistry, 1995, 34, 285–292 CrossRef CAS.
- M. S. Shchepinov, S. C. Case-Green and E. M. Southern, Nucleic Acids Res., 1997, 25, 1155–1161 CrossRef CAS PubMed.
- P. R. Edwards, A. Gill, D. V. Pollar-Knight, M. Hoare, P. E. Buckle, P. A. Lowe and R. J. Leatherbarrow, Anal. Biochem., 1995, 231, 210–217 CrossRef CAS.
- M. Sternberg and H. Nygren, J. Immunol. Methods, 1988, 113, 3–15 CrossRef.
- H. Liu, L. Skibinska, J. Gapinski, A. Patkowski, E. W. Fischer and R. Pecora, J. Chem. Phys., 1998, 109, 7556–7566 CrossRef CAS PubMed.
Footnotes |
| † Electronic supplementary information (ESI) available. See DOI: 10.1039/C4BM00210E |
| ‡ Current address: Clinical Diagnostic Group, Bio-Rad Laboratories, Benicia, CA 94510. |
| This journal is © The Royal Society of Chemistry 2014 |

