Quantification of volume and size distribution of internalised calcium phosphate particles and their influence on cell fate†
Richard L.
Williams
,
Isaac
Vizcaíno-Castón
and
Liam M.
Grover
*
Biochemical Engineering, The School of Chemical Engineering, University of Birmingham, Birmingham, UK. E-mail: l.m.grover@bham.ac.uk
First published on 5th August 2014
Abstract
We report preliminary findings suggesting that the diameter of the internalised calcium phosphate particles is critical to cell fate with particles/aggregates of particles of larger than 1.5 μm not processed by lysosomes leading to cell death. This has significant implications for the design of medical materials even from those consisting of non-toxic calcium phosphate salts.
Calcium phosphates (CaPs) have been used extensively as bone replacement materials, substrates for drug release and transfection agents1–6 because of their non-cytotoxic nature and chemical similarity to the mineral component of human bone. There are numerous studies of CaPs of different morphology, size, surface area and zeta-potential and their effect on cellular uptake,7,8 transfection efficiency and cytotoxicity.8,9 However, the fate and precise location of the material once inside the cell, together with it's effect on the cell itself, is not fully understood. Motskin et al. (2009) attempted to quantify the volume of CaP within fixed human macrophages from TEM images and reported significant localisation within lysosomes from observations.8 Together with image data, they concluded that apparent cytotoxicity was dependent on the volume of the internalised material.8 It's been widely reported that the mechanism behind this apparent cytotoxicity involves the release of Ca2+ from the CaP structures dissolved within the acidic environment of the lysosomes,8,10 which in turn interferes with Ca2+ mediated signalling pathways including those involved in apoptosis.11–13 However, it's unclear whether this calcium ion release is actually dependent purely on the total volume of the internalised CaP within the cell membrane because there are no studies to date which have quantified the amount of material within lysosomes and free in the cytosol.
We previously reported a method for the surface modification of silicon-substituted hydroxyapatite (SiHA) with thiol groups, which enabled the engraftment of a fluorescein-5-maleimide probe and hence the clear visual discrimination of the material from cells14 (Fig. S1†). In this work, cellular internalisation and lysosomal processing of calcium phosphate particles by MC3T3 cells has been visualised and quantified through surface modification and fluorescent tagging along with lysosome co-labelling (ESI† section 1.1 to 1.3 for materials and methods). Computational image analysis of 3D confocal image stacks was used (section 1.4†) to estimate the size distribution (Fig. S2†) and volume (Fig. S3†) of the internalised material located both within and outside of the lysosomes. Gel electrophoresis of the labelled particles showed that the dye remained bound to the functionalised particle surface after extensive washing and that excess unbound dye had been removed (Fig. S4†), hence the detected fluorescence in the confocal images represents particle bound dye. We report observations of changes in the behaviour of MC3T3 cells indicative of the onset of cell death after exposure to labelled SiHA, which correlate with both the size distribution and volume of the material not located within the lysosomes.
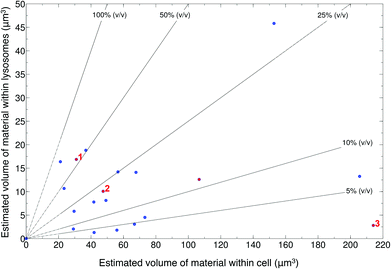
SiHA-lysosome colocalisation was represented by yellow pixels in the overlay confocal microscopy images (Fig. S5 and S6†). Analysis of the 3D confocal image stacks revealed that generally no more than approximately 20 μm3 of material was located within the lysosomes after 24 hours irrespective of the total volume of material in the cells as a whole (which ranged from 20–220 μm3). No clear relationship was found between the volume of material transferred to lysosomes and the total material internalised by the cell as a whole (Fig. 1). Three example cases of changes in cell morphology and behaviour are highlighted – (1) cells changing from elongated to a round morphology, (2) an increase in the number of lysosomes and their convergence around internalised structures and, (3) detachment of cells from the substrate. Detachment of cells from the imaging dish suggested late stages of cell death, but there was no clear link between this behaviour and the amount of material located within the lysosomes, which would potentially be a source of dissolved calcium ions. For example, the example case of cell detachment (labelled as ‘3’) in Fig. 1, was found to contain approximately 215 μm3 of material within the cell with less than 5 μm3 of this located within lysosomes. Meanwhile, cells with lysosomes containing up to 45 μm3 of material showed no change in overall morphology.
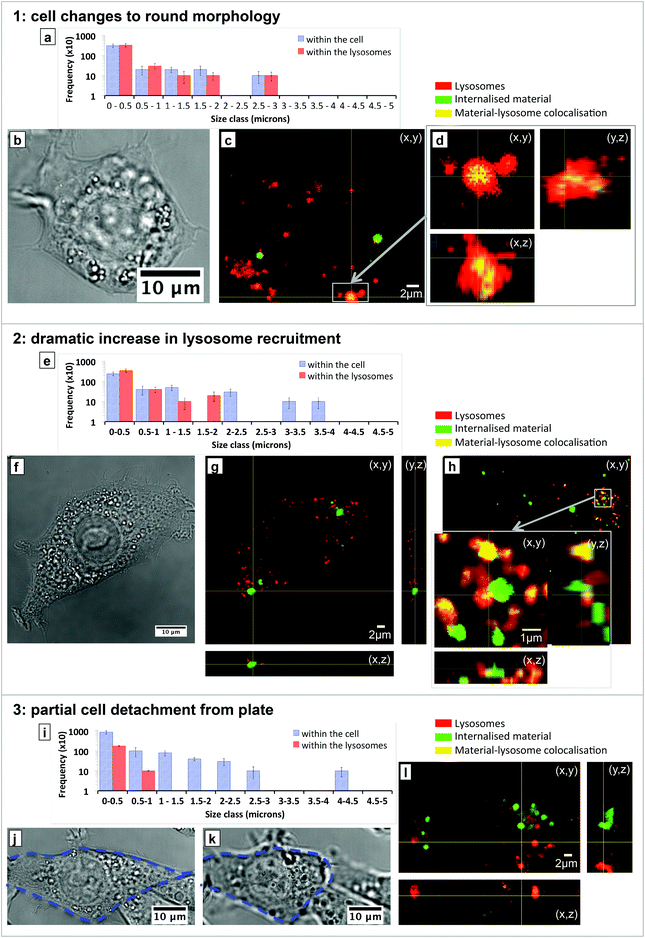
The distribution of the material within the cells exhibiting changes in morphology and function was then analysed to supplement the volume estimation data. Fig. 2 shows size histograms of material detected within (red bars) and outside (blue bars) the lysosomes together with bright field images of example cells showing changes in morphology and confocal fluorescence images of labelled SiHA and lysosomes. Structures up to 1 μm in diameter were most prevalent within the cells, but structures of up to 3–4 μm in diameter were also observed. Lysosomes were generally found to contain structures up to 2–3 μm in diameter, leaving any larger structures within the overall cell. In the case of cell morphology changing from an elongated to a round shapes (Fig. 2a–d), the majority of all of the material, consisting of structures between 0.2–3 μm in diameter, were taken up by the lysosomes. Total encapsulation of the micron scale material is clearly shown in the orthogonal views of the highlighted region of the fluorescence image where the yellow ‘colocalised pixels’ are surrounded by the red lysosome. In the second case involving dramatic increase in lysosome recruitment (Fig. 2e–h), no material with diameter above 2 μm was found within the lysosomes, resulting in approximately 90% of the material remaining within the cytoplasm. Some structures between 2–3 μm were observed to have been partially enclosed by lysosomes (as shown in the inset high magnification fluorescence image) to create a substructure approximately 1.5–2 μm in diameter, which is shown by the creation of a lone red bar within this size class in the size histogram. In this case it can be proposed that the 2–2.5 μm size class of structures would eventually become completely encapsulated over time given that structures of up to 3 μm were encapsulated in the first case (a). Nonetheless, the cells which were observed to have increased lysosomal activity contained SiHA structures up to 4 μm in size – none of which were found to colocalise with lysosomes. In the cases where partial cell detachment was observed (Fig. 2i–l), no structures larger than 1 μm were detected within the lysosomes (Fig. 2i) where little colocalisation (yellow coloured pixels) could be seen across the vast majority of the labelled material. Detachment was observed to be a dramatic and rapid process as shown by the bright field images (j and k), which were taken approximately 3 minutes apart.
In summary, we have for the first time quantified the volume and size distribution of SiHA located within lysosomes of live MC3T3 cells. Observations of changes in cell morphology and detachment from the surface, which are believed to relate to stages of cell death, 24 hours after exposure to SiHA have been reported and were shown not to depend purely on the total volume of material within the cell as shown in other studies. SiHA aggregates within the cell larger than 1.5 μm not located within lysosomes correlate with onset of cell death. We speculate that the presence of aggregates outside of the lysosome could be the result of: (i) the destabilisation of the lysosome membrane due to increased Ca2+ ion concentration from the dissolving particle material, thus releasing the undissolved fraction of the particle/aggregate and/or, (ii) destabilisation of the late endosomes containing the material before fusion with lysosomes occurs. The latter hypothesis partly stems from the fact that the structures detected outside of the lysosomes exhibited highly localised fluorescence, possibly suggesting that the labelled particles were still intact and therefore had not been subjected to the acidic environment of the lysosomes. However, analysis of the local free Ca2+ ion distribution around these regions and labelling of late endosomes may be required to fully investigate this theory. Understanding the mechanism of escape will be the focus of our future work in this area. These results may have wider implications for the understanding of how particles eroded from the surface of implants may influence biological response and highlight that biological response even to non-toxic materials may be strongly size dependent. This presents an additional important consideration for the design of new implant materials.
We would like to acknowledge the funding for this work provided by the EPSRC (grant reference: EP/F50053X/1). We would also like to acknowledge Advantage West Midlands and the Birmingham Advanced Light Microscopy centre for the provision of and access to the confocal microscope used in this work.
References
- V. Sokolova, A. Kovtun, O. Prymak, W. Meyer-Zaika, E. A. Kubareva, E. A. Romanova, T. S. Oretskaya, R. Heumann and M. Epple, J. Mater. Chem., 2006, 17, 721–727 RSC.
- C. Ribeiro, C. Barrias and M. Barbosa, Biomaterials, 2004, 25, 4363–4373 CrossRef CAS PubMed.
- S. J. Kalita, A. Bhardwaj and H. A. Bhatt, Mater. Sci. Eng., C, 2007, 27, 441–449 CrossRef CAS PubMed.
- J. Klesing, S. Chernousova and M. Epple, J. Mater. Chem., 2012, 22, 199–204 RSC.
- S. C. Lee, H. W. Choi, H. J. Lee, K. J. Kim, J. H. Chang, S. Y. Kim, J. Choi, K.-S. Oh and Y.-K. Jeong, J. Mater. Chem., 2007, 17, 174–180 RSC.
- K. Ganesan, A. Kovtun, S. Neumann, R. Heumann and M. Epple, J. Mater. Chem., 2008, 18, 3655–3661 RSC.
- L. Chen, J. M. Mccrate, J. C. Lee and H. Li, Nanotechnology, 2011, 22, 105708 CrossRef PubMed.
- M. Motskin, D. Wright, K. Muller, N. Kyle, T. Gard, A. Porter and J. Skepper, Biomaterials, 2009, 30, 3307–3317 CrossRef CAS PubMed.
- Y. Yuan, C. Liu, J. Qian, J. Wang and Y. Zhang, Biomaterials, 2010, 31, 730–740 CrossRef CAS PubMed.
- M. Motskin, K. H. Müller, C. Genoud, A. G. Monteith and J. N. Skepper, Biomaterials, 2011, 32, 9470–9482 CrossRef CAS PubMed.
- S. Orrenius, B. Zhivotovsky and P. Nicotera, Nat. Rev. Mol. Cell Biol., 2003, 4, 552–565 CrossRef CAS PubMed.
- M. P. Mattson and S. L. Chan, Nat. Cell Biol., 2003, 5, 1041–1043 CrossRef CAS PubMed.
- G. Hajnóczky, G. Csordás, S. Das, C. Garcia-Perez, M. Saotome, S. Sinha Roy and M. Yi, Cell Calcium, 2006, 40, 553–560 CrossRef PubMed.
- R. L. Williams, M. J. Hadley, P. J. Jiang, N. A. Rowson, P. M. Mendes, J. Z. Rappoport and L. M. Grover, J. Mater. Chem. B, 2013, 1, 4370–4378 RSC.
Footnote |
| † Electronic supplementary information (ESI) available: Materials and methods, 1D PAGE images demonstrating, confocal image showing colocalisation and fluorescence spectroscopy data. See DOI: 10.1039/c4bm00238e |
| This journal is © The Royal Society of Chemistry 2014 |


