Facile synthesis of nano-sized hollow single crystal zeolites under mild conditions†
Daniel
Fodor
a,
Lucie
Pacosová
a,
Frank
Krumeich
b and
Jeroen A.
van Bokhoven
*ac
aInstitute for Chemical and Bioengineering, ETH Zurich, 8093 Zurich, Switzerland. E-mail: jeroen.vanbokhoven@chem.ethz.ch; Tel: +41 44 632 55 42
bLaboratory of Inorganic Chemistry, ETH Zurich, 8093 Zurich, Switzerland
cLaboratory for Catalysis and Sustainable Chemistry, Paul Scherrer Institute, 5232 Villigen, Switzerland
First published on 7th October 2013
Abstract
We report a method to synthesize hollow ZSM-5 single crystals of a size below 100 nm that could function as nanoreactors with access through the zeolite micropores only. In the first step, ZSM-5 is synthesized with the respective crystal size. In the second, the zeolite is base leached and acid washed under mild conditions.
Materials with hollow interior, such as zeolites,1–3 silica,4,5 metals6 and metal oxides,7 find interest due to the wide possibilities of application in catalysis,1,8 medicine,5 electronics,9etc. In particular, they are promising materials in catalysis because metals or metal oxides can be encapsulated in the interior and hinder the sintering of the enclosed particles.10,11 A unique feature of hollow zeolite crystals is the accessibility of the interior via the micropores of the zeolite.
There are two common ways to synthesize hollow zeolites. The first is to use some suspension or emulsion and grow the zeolite crystals along the interface.3 Alternatively one can first synthesize the zeolite crystals and leach them with a base in the second step.1,2,8 The former method usually yields larger hollow crystals in the micrometer range with a polycrystalline shell, while the latter procedure allows synthesizing hollow zeolites on the low or sub-micrometer length scale. For encapsulation of species, the size of the ‘nano-reactor’ is ideally tuned. Hollow crystals of only a few tens of nm provide large surface areas. Here we report a method consisting of the synthesis of ZSM-5 nanocrystals in the first step and a base leaching–acid washing sequence in the second step to selectively dissolve the crystal core and the subsequently formed amorphous deposits, respectively. Two examples of hollow zeolites are shown with a size of approximately 60 nm and 100 nm.
First, nano-sized ZSM-5 crystals were synthesized with two different Si/2Al ratios according to a reported method.12 A tetrapropylammonium hydroxide (TPAOH) template and tetraethoxysilane (TEOS) were stirred at 80 °C for 24 h. Defined amounts of Al(NO3)3·9H2O and NaOH were dissolved in a fixed volume of water and added dropwise to the TEOS–TPAOH solution and stirred for several hours. The molar ratio of the resulting gel was Al2O3![[thin space (1/6-em)]](https://www.rsc.org/images/entities/char_2009.gif) :
:![[thin space (1/6-em)]](https://www.rsc.org/images/entities/char_2009.gif) xSiO2
xSiO2![[thin space (1/6-em)]](https://www.rsc.org/images/entities/char_2009.gif) :
:![[thin space (1/6-em)]](https://www.rsc.org/images/entities/char_2009.gif) 25TPAOH
25TPAOH![[thin space (1/6-em)]](https://www.rsc.org/images/entities/char_2009.gif) :
:![[thin space (1/6-em)]](https://www.rsc.org/images/entities/char_2009.gif) yNa2O
yNa2O![[thin space (1/6-em)]](https://www.rsc.org/images/entities/char_2009.gif) :
:![[thin space (1/6-em)]](https://www.rsc.org/images/entities/char_2009.gif) 830H2O (x = 60 or 100, y = 8.3 or 5, respectively). The mixture was transferred into a stainless-steel autoclave equipped with a PEEK inlet and heated at 170 °C for 24 h under static conditions. The product was separated by centrifugation, washed three times with distilled water, dried at 110 °C for 8 h and subsequently calcined at 550 °C for 10 h. The nano-sized ZSM-5 crystals with Si/2Al ratios 100 and 60 are denoted as Z100 and Z60, respectively. Both Z100 and Z60 underwent an alkaline and acid treatment sequence.
830H2O (x = 60 or 100, y = 8.3 or 5, respectively). The mixture was transferred into a stainless-steel autoclave equipped with a PEEK inlet and heated at 170 °C for 24 h under static conditions. The product was separated by centrifugation, washed three times with distilled water, dried at 110 °C for 8 h and subsequently calcined at 550 °C for 10 h. The nano-sized ZSM-5 crystals with Si/2Al ratios 100 and 60 are denoted as Z100 and Z60, respectively. Both Z100 and Z60 underwent an alkaline and acid treatment sequence.
The alkaline treatment was carried out under mild conditions with 0.1 M NaOH at 80 °C for 10 h. After the reaction the product was recovered by centrifugation, washed three times with distilled water and dried at 110 °C for 8 h. During base leaching, alumina-silicate species redeposit, however, they can be removed by mild acid treatment the consequence of which is that the access to the pore network is restored.13 The treatment was carried out with 0.1 M HCl at 65 °C for 6 h. After acid washing the product was centrifuged, washed three times with distilled water, dried (110 °C, 8 h) and calcined (550 °C, 5 h). Base leached and acid washed products are denoted with the suffix H: Z100_H and Z60_H.
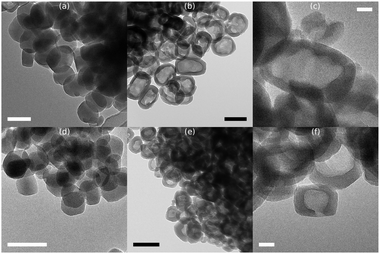
The crystal dimensions with 95% confidence intervals in Table 1 are obtained from the TEM micrographs of the parent and modified zeolites. Representative examples are shown in Fig. 1 at lower and higher magnification. The crystal size of Z100 is 113 nm in length and 86 nm in width (Fig. 1a and Table 1). After making the crystal hollow, the dimensions remain virtually unchanged at 113 nm × 84 nm with an average wall thickness of 15 nm (Fig. 1b and c and Table 1).
| Sample | Crystal length [nm] | Crystal width [nm] | Wall thickness [nm] |
|---|---|---|---|
| Z100 | 113 ± 5 | 86 ± 5 | — |
| Z100_H | 113 ± 4 | 84 ± 5 | 13 ± 1 |
| Z60 | 70 ± 5 | 54 ± 4 | — |
| Z60_H | 68 ± 5 | 52 ± 4 | 15 ± 1 |
 | ||
| Fig. 1 TEM micrographs of Z100 (a), Z100_H (b, c), Z60 (d) and Z60_H (e, f). Scale bars represent 100 nm (a, b, d, e) and 20 nm (c, f). | ||
Fig. 1b shows that each crystal is hollow. At higher magnification Fig. 1c shows uninterrupted lattice fringes of the zeolite crystal, indicating that the mild treatments only affected the crystal interior and did not damage the crystal shell. Z60 and Z60_H have a slightly elongated shape like Z100 but are smaller in size: 70 nm × 54 nm. After the base leaching–acid wash sequence the crystals have a hollow core and single crystal shell structure with an average wall thickness of 13 nm while the crystal size was retained (68 nm × 52 nm). Each crystal is hollow as evidenced by TEM (Fig. 1e) and the lattice fringes remain well visible over the whole crystal (Fig. 1f). The high magnification images (Fig. 1c and f) are included in larger size along with other micrographs in the ESI† (Fig. S1–S4).
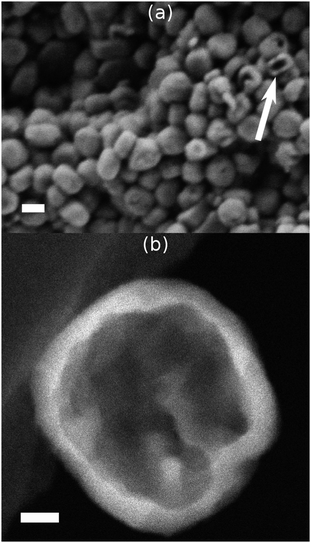
Fig. 2a shows a SEM image of Z100_H, which probes the crystal surface by detecting secondary electrons. Only a few crystals showed large openings, which probably are caused by crushing during the preparation for the measurement. In the Z-contrast image (Fig. 2b), the transmitted electrons scattered at high angles are detected and bulk information is obtained. The hollow nature of the crystal is clearly visible as the walls which are thick in projection appear bright whereas the thin inner area is dark.
 | ||
| Fig. 2 SEM (a) and Z-contrast (b) images of Z100_H. The scale bars represent 100 nm (a) and 20 nm (b). | ||
Preferential dissolution of the crystal interior is typically explained by the presence of negatively charged tetrahedral Al centres that can enrich in the rim of the crystals and are relatively resistant to the attack of hydroxide ions.14–16 An Al gradient from the surface towards the crystal interior originates from using the TPA template during the synthesis of ZSM-5.17
The measured Si/2Al ratios (Table 2) are close to the nominal values that were set in the synthesis mixture of ZSM-5 and either did not change (Z60_H) or slightly increased (Z100_H) during the treatment. During our procedure, there was no evidence of the selective leaching of silicon. The weight loss after base leaching is approximately 30 wt% as determined by AAS (29% for Z100 and 27% for Z60).
| Sample | Si/Ala | S BET b [m2 g−1] | S ext c [m2 g−1] | V micr c [cm3 g−1] | V tot d [cm3 g−1] |
|---|---|---|---|---|---|
| a Determined by AAS. b Derived from the BET model. c Derived from the t-plot. d Derived from single point measured at p/p0 = 0.95. | |||||
| Z100 | 92 | 346 (0.7) | 171 (2.8) | 0.08 (1.3) | 0.26 (5.5) |
| Z100_H | 98 | 390 (3.5) | 193 (5.5) | 0.09 (1.7) | 0.33 (5.0) |
| Z60 | 62 | 275 (1.2) | 108 (1.6) | 0.08 (0.8) | 0.27 (3.9) |
| Z60_H | 62 | 388 (4.8) | 161 (9.2) | 0.10 (0.6) | 0.47 (7.6) |
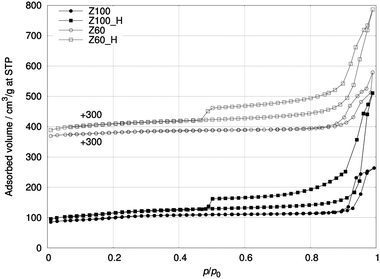
Table 2 also shows the parameters derived from N2 physisorption (Fig. 3). The parent samples Z100 and Z60 had already a relatively large total surface area (SBET), 346 and 275 m2 g−1, respectively, which further increased by approximately 10 and 40% after the treatment. The isotherms of both products, Z100_H and Z60_H, show an increased nitrogen uptake and a pronounced hysteresis loop owing to the porosity created during the alkaline treatment. The micropore volume (Vmicr) shows a slight increase in both samples which can be explained by removal of some amorphous material that may have resulted from the synthesis. The total pore volume (Vtot) measured as a single point at p/p0 = 0.95 increased considerably for both samples due to the formation of accessible hollows. Comparing Vtot of the products there is an apparent difference, however, it is measured in a steep region of the isotherms. Small variation in the pressure causes larger variation in the adsorbed volume measured. The nitrogen uptake measured at maximum pressure is very similar for both products (Fig. S5, ESI†) suggesting similar pore volumes.
 | ||
| Fig. 3 Nitrogen physisorption isotherms of Z100, Z100_H, Z60 and Z60_H. The isotherms of Z60 and Z60_H are lifted by 300 cm3 g−1. | ||
XRD diffractograms of the parent samples Z100 and Z60 as well as the products Z100_H and Z60_H show (Fig. S6, ESI†) that the MFI structure is preserved after leaching irrespective of the Si/2Al ratio. The relative crystallinity of Z100 and Z60 increased by 5% and 16%, respectively, after leaching (Fig. S7, ESI†). The increase is explained by the dissolution of the crystal interior containing a higher concentration of defect sites than the shell of the crystal.8 The increase in crystallinity was more pronounced for Z60 because a higher amount of Al correlates with a higher amount of defect sites.18
Based on the IR bands at 1545 cm−1 and 1455 cm−1 as well as the corresponding absorption coefficients reported in the literature,19 the amount of Brønsted and Lewis acid sites was determined. They are summarized in Table 3 and the spectra are shown in Fig. S8 and S9 (ESI†). The concentration of Brønsted and Lewis acid sites increases after leaching, however, their relative ratio does not change. The spectra of Z100 and Z100_H in Fig. S10 (ESI†) were measured after dosing pyridine with background taken before the doses. The negative intensities at 3745 cm−1 and 3603 cm−1 are due to adsorption of pyridine on terminal silanols and bridging hydroxyls, respectively. The increased negative intensity of Z100_H at 3603 cm−1 indicates the increased uptake of pyridine relative to the parent zeolite Z100.
The Z100 and Z100_H zeolites were further characterized by NH3-TPD (see Fig. S11, ESI†). Both Z100 and Z100_H show a single peak at 420 °C. Z100_H had a 10% larger peak area. No change in acid strength was detected, however, in agreement with pyridine adsorption, more acid sites became accessible for ammonia in Z100_H.
Hollow ZSM-5 nanocrystals with an average size of 100 and 60 nm were synthesized in a two-step process. The products have the same size as the respective parent samples, a single hollow in the crystal interior and an approximately 15 nm single crystal shell as indicated by the presence of uninterrupted zeolite channels. The MFI structure is preserved during synthesis and properties like the Si/2Al ratio as well as the ratio of Brønsted and Lewis acid sites remain virtually unchanged. Crystallinity and the absolute number of Brønsted and Lewis acid sites as well as NH3 uptake increase.
The authors acknowledge support from the Electron Microscopy of ETH Zurich (EMEZ) and Center for Microscopy and Image Analysis of University of Zurich. The authors are grateful to Amaia Beloqui Redondo and Matthew Brown for their support in the IR measurements and Renata Bessa Duarte for her help in XRD and Gianvito Vilé for his help in NH3-TPD measurements.
Notes and references
- C. Mei, Z. Liu, P. Wen, Z. Xie, W. Hua and Z. Gao, J. Mater. Chem., 2008, 18, 3496 RSC.
- Y. Wang and A. Tuel, Microporous Mesoporous Mater., 2008, 113, 286 CrossRef CAS PubMed.
- J. Zhao, Z. Hua, Z. Liu, Y. Li, L. Guo, W. Bu, X. Cui, M. Ruan, H. Chen and J. Shi, Chem. Commun., 2009, 7578 RSC.
- F. Caruso, R. A. Caruso and H. Möhwald, Science, 1998, 282, 1111 CrossRef CAS.
- Y. Zhu, J. Shi, W. Shen, X. Dong, J. Feng, M. Ruan and Y. Li, Angew. Chem., Int. Ed., 2005, 44, 5083 CrossRef CAS PubMed.
- E. González, J. Arbiol and V. F. Puntes, Science, 2011, 334, 1377 CrossRef PubMed.
- Y. Yin, R. M. Rioux, C. K. Erdonmez, S. Hughes, G. A. Somorjai and A. P. Alivisatos, Science, 2004, 304, 711 CrossRef CAS PubMed.
- Y. Wang, M. Lin and A. Tuel, Microporous Mesoporous Mater., 2007, 102, 80 CrossRef CAS PubMed.
- M. H. Oh, T. Yu, S.-H. Yu, B. Lim, K.-T. Ko, M.-G. Willinger, D.-H. Seo, B. H. Kim, M. G. Cho, J.-H. Park, K. Kang, Y.-E. Sung, N. Pinna and T. Hyeon, Science, 2013, 340, 964 CrossRef CAS PubMed.
- R. Güttel, M. Paul and F. Schüth, Chem. Commun., 2010, 46, 895 RSC.
- M. Feyen, C. Weidenthaler, R. Güttel, K. Schlichte, U. Holle, A.-H. Lu and F. Schüth, Chem.–Eur. J., 2011, 17, 598 CrossRef CAS PubMed.
- H. Mochizuki, T. Yokoi, H. Imai, R. Watanabe, S. Namba, J. N. Kondo and T. Tatsumi, Microporous Mesoporous Mater., 2011, 145, 165 CrossRef CAS PubMed.
- A. E. W. Beers, J. A. van Bokhoven, K. M. de Lathouder, F. Kapteijn and J. A. Moulijn, J. Catal., 2003, 218, 239 CrossRef CAS.
- A. Čižmek, B. Subotić, I. Šmit, A. Tonjec, R. Aiello, F. Crea and A. Nastro, Microporous Mater., 1997, 8, 159 CrossRef.
- J. C. Groen, T. Bach, U. Ziese, A. M. Paulaime-van Donk, K. P. de Jong, J. A. Moulijn and J. Pérez-Ramírez, J. Am. Chem. Soc., 2005, 127, 10792 CrossRef CAS PubMed.
- N. Danilina, F. Krumeich, S. A. Castelanelli and J. A. van Bokhoven, J. Phys. Chem. C, 2010, 114, 6640 CAS.
- A. Tissler, P. Polanek, U. Girrbach, U. Müller and K. K. Unger, Stud. Surf. Sci. Catal., 1989, 46, 399 CrossRef.
- M. Müller, G. Harvey and R. Prins, Microporous Mesoporous Mater., 2000, 34, 135 CrossRef.
- C. A. Emeis, J. Catal., 1993, 141, 347 CrossRef CAS.
Footnote |
| † Electronic supplementary information (ESI) available: Experimental part, TEM images, isotherms, XRD data, IR spectra and NH3-TPD curves. See DOI: 10.1039/c3cc45336g |
| This journal is © The Royal Society of Chemistry 2014 |
