Detection of traces of fluorine in micrometer sized uranium bearing particles using SIMS
Anne-Laure
Fauré
*,
Céline
Rodriguez
,
Olivier
Marie
,
Jean
Aupiais
and
Fabien
Pointurier
Commissariat à l'Energie Atomique DAM-Ile de France, Bruyères le Châtel, 91297 Arpajon, France. E-mail: anne-laure.faure@cea.fr; Fax: +33 169267065; Tel: +33 169266747
First published on 10th October 2013
Abstract
The isotopic analysis of micrometer sized uranium bearing particles, released from nuclear facilities, has been proven to be an efficient tool for safeguarding purposes. However these analyses are not always sufficient for identifying specifically some crucial nuclear operations, like uranium conversion, which are most of the time carried out with natural uranium. A secondary ion mass spectrometry (SIMS) methodology to detect and analyze micrometer sized particles that contain both uranium and fluorine is described. Following the particle detection, which is performed automatically, individual particles are analyzed under microbeam conditions to measure both a precise uranium isotopic composition and the relative amount of fluorine. We first confirm that the sample thermal treatment is prohibited to preserve the fluorine signature of the particles. The methodology was applied to uranium particles coming from the fuel cycle upstream from the enrichment step. This study demonstrates that, contrary to uranium isotopic measurements, the measurement of the relative amount of fluorine allows discrimination between uranium ore concentrate particles and particles coming from a conversion plant. Moreover, the results, obtained for particles which were collected 4 years ago in the surroundings of a conversion plant, show also that the sample storage in a plastic bag at ambient temperature and in the dark is enough to prevent a significant loss of fluorine and the disappearance of the conversion signature. Finally the methodology was applied successfully to an unknown real-life environmental sample.
Introduction
For safeguarding purposes, it has become increasingly important to develop analytical techniques applicable to particulate matter collected at both established nuclear facilities and locations suspected of clandestine nuclear material handling.1 IAEA inspectors routinely collect particulate matter at nuclear facilities by wiping smooth surfaces at various locations inside the facility using square pieces of cotton cloths, referred to as “swipe samples”. The goal of the analyses of such samples is to detect the presence of any particles of nuclear materials (mainly uranium) and to determine their isotopic composition. Because particle isotopic and elementary compositions are representative of the original material, these particles can be considered as fingerprints of specific processes of the nuclear industry.2 Secondary ion mass spectrometry3,4 and fission track-thermal ionization mass spectrometry5,6 are the relevant techniques to determine the isotopic composition of such uranium particles. However, the initial steps of the nuclear fuel cycle may involve only natural uranium. Therefore, isotopic measurements alone are not always sufficient for identifying some crucial nuclear operations, like uranium conversion, carried out just before enrichment. Uranium conversion consists of transforming uranium ore concentrates, UOC (often referred to as “yellow cake” or ammonium di-uranate), into uranium tetrafluoride (UF4) and then into uranium hexafluoride (UF6). UF6 is a very reactive gas that reacts with atmospheric moisture to form uranium oxyfluoride (UO2F2).7,8 Given the large amounts of UF4 and UF6 used at conversion and enrichment facilities, very small releases to the atmosphere are common and result in the deposition of particulate UF4 and/or UO2F2 material. So, the detection of a significant amount of F in such U particles is a proof that uranium has been converted at one point before the sampling. Many studies aimed at the characterization of UO2F2 particles, produced at the Institute for Reference Materials and Measurements (EC-JRC-IRMM, Geel, Belgium),9 in order to establish possible correlations between the amount of fluorine and the time elapsed since the release of the particles.10–13 However, prior to the measurement of fluorine in uranium particles from a real-life sample, the first step is to detect these U particles among the numerous other particulate materials also sampled. In addition, further isotopic measurements on these uranium–fluorine particles could provide information on whether particles have been enriched or just converted (assuming conversion is carried out on natural uranium). SIMS is the only technique that can provide both particle location and isotopic measurements within one instrument. Moreover, the automatic search for U particles by SIMS has been greatly improved by the development of the Automatic Particle Measurement, APM, software by CAMECA. The APM software is mainly aimed at fast screening measurements by performing a two-dimensional image scan over a large surface in order to locate the particles of interest at selected masses and to make a first assessment of the isotopic composition of each particle.14 Once the location of all particles has been determined, the isotopic composition of selected particles can be obtained by microbeam analysis.In this paper, a recently developed 2-step methodology for which aim is to detect and analyze particles that contain both U and F is described. The first step consists of an automated detection of such particles. The second step consists of the determination of both the U isotopic composition and the relative amount of fluorine in individual particles. The goal is to identify the different industrial steps of U processing, thanks to the combination of U isotopic measurement and of the level of F. The fluorine quantification and the stoichiometric composition determination of single particles are beyond the scope of this work and might be a difficult task because of in situ recombination.
Materials, sample preparation and analytical methods
Materials and sample preparation
Two particle deposition methodologies were used depending on the samples. Particles from the CRM UF4 17-b material (New Brunswick Laboratory, DOE, USA) were deposited on a cotton cloth (TX 303, Texwipe, NC, USA) then transferred under a glove bag on a carbon planchet (grade FP2584 Schunk Electrographite SAS, Germany) using a vacuum impactor.15 This method consists of impacting particles on a carbon planchet beforehand covered with an organic compound, polyisobutylene in nonane, acting as a sticky agent. The vacuum impactor technique was also used to deposit particles coming from the conversion plant and the unknown swipe sample. The U conversion facility, which was sampled to get real-life particles, produces UF4 from UOC. Particles were collected on filters and cotton cloths inside and outside the buildings, but not directly on the bulk nuclear material itself. CP 1 and CP 2 correspond to two different sample locations outside the buildings. CPPurif. and CPFluor. samples were taken inside the buildings, respectively in the purification workshop and in the fluorination workshop.The other deposition method was used for CRMs UOC purchased from CETAMA (CEA, France). It consists of depositing, droplet by droplet, ethanol-solutions containing particles from these reference materials onto carbon planchets.
In addition, to study the impact of the possible in situ recombination of fluorine, coming from non-uranium bearing particles, and uranium particles during SIMS analysis, we prepared two swipe samples by adding particles of sodium fluoride (NaF Normapur, Prolabo, France) to two different UOC CRMs. The ratio between the number of NaF particles and U particles is about 50/1 in all the samples.
The list of all the samples and of their preparation method is given in Table 1. The size ranges of the particles were investigated by SEM and are also reported in Table 1.
| Name | Size (in μm) | Deposition method |
|---|---|---|
| CRM UF4 | A few μm | VI |
| CRM UOC “Amethyste”, “Morille”, “Calcedoine”, “Bolet”, “Chanterelle”, “Grenat” | Up to 15 μm | ES |
| CRM UOC + NaF “Bolet” + NaF, “Chanterelle” + NaF | Up to 15 μm for UOC more than 5 μm for NaF | VI |
| CP 1, CP 2, CPPurif., CPFluor. | Up to 15 μm | VI |
| Unknown sample | Up to 1 μm | VI |
Throughout the study, particles coming from the U standard material, CRM U020-A from New Brunswick Laboratory (DOE, USA), were used for Instrumental Mass Fractionation (IMF) determination. Monodispersed U particles were produced from CRM U 020-A at the Institute for Transuranium (European Commission, Joint Research Center, Karlsruhe, Germany).
It should also be mentioned that 4 years elapsed between the sampling of the conversion plant and the particle deposition on the carbon planchet. Swipe samples and filters were stored at ambient laboratory temperature (∼20 °C), under plastic bags and in the dark. No information is available on the sampling date or the storage conditions of the unknown sample and the CRMs. They were not exposed to ambient moisture and direct light after they were received in the laboratory.
Scanning electron microscopy
An FEI “Quanta3D FEG” SEM was used to image U–F particles after their deposition on a carbon planchet. This instrument is equipped with an EDX analyser (EDAX, Eastern Analytical SPRL, Stevelot, Belgium) and software for automated detection and location of particles (Eastern Analytical SPRL, Stevelot, Belgium). This software, called “Gun Shot Residue” (GSR), automatically detects particles for which the average atomic number is above a given threshold (usually 20 to 25) and acquires a fast EDX spectrum (1 s) on each detected particle. The GSR software allows a first screening of the samples and can detect fluorine associated with uranium particles. The analytical settings were an atomic number threshold of 15 and a magnification of 310 (which corresponds to 3 pixels for 0.3 μm) in order to detect U-bearing particles with diameters as low as 0.5 μm.Secondary ion mass spectrometry
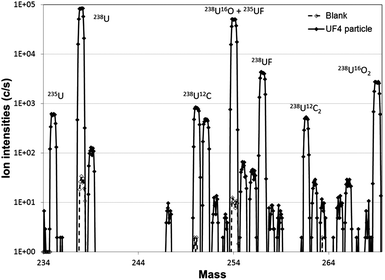
SIMS measurements were performed with a double focusing Cameca IMS 7f. This instrument is equipped with two ion sources: a duoplasmatron (O2+) source and a cesium source (Cs+). A primary ion beam of oxygen ions is typically used to enhance the production of electropositive ions such as U+ whereas bombardment using Cs+ primary ions stimulates the production of electronegative secondary ions such as O− or F−. Simultaneous measurements of both U and F therefore imply that secondary ion yield is not optimal for one of these species. Both sources were employed in the studies described in the literature. Thus, the two ion sources of our instrument were tested in a preliminary study in order to choose the one which offers the better compromise. The Cs source did not allow detection of UF4 particles through the elementary U ions and polyatomic U ions such as UO+, UC+ or UF+. Actually no uranium peaks were clearly identified on corresponding mass spectra mainly because of a high background signal measured on the blank carbon planchet. In contrast, the duo-plasmatron source enabled detection of clearly elementary and polyatomic U ions (see Fig. 4). Thus, all measurements described in this paper were carried out with the O2+ primary beam accelerated to 15 keV. The positive secondary ions were accelerated through 5 keV. The mass resolving power (MRP) was set to 450 to obtain flat top peaks and a good sensitivity, which improves the accuracy and the reproducibility of the measurements. Ion species were recorded in a magnet peak jump sequence using a single electron multiplier detector.SIMS analytical protocol
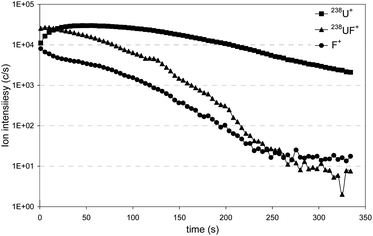
The automatic U particle searching was performed with the APM under the parameters given in Table 2. Ion images were recorded at mass to charge, m/z, ratios of 233 and 234.041 (corresponding to the 234U isotope) to detect potential polyatomic interference which may bias the isotopic measurements (for instance 206Pb12C16O+ which interferes with 234U+). Recording of ion images at m/z corresponding to 235U and 238U isotopes enables us to detect and locate U particles and to provide a first estimation of the 235U abundances after the data treatment. Acquisition of the 238UF+ ions is used to get a first estimation of the relative amount of fluorine in U particles. A preliminary study on UF4 particles showed that fluorine is better detected at the m/z ratio corresponding to the 238UF+ ions than at the m/z ratio corresponding to the F+ ions (see Fig. 1). Moreover, because of the presence of F-rich dust particles on a blank carbon planchet, already observed by Kips et al.,16 measurement of the 238UF+ ion suggests that fluorine is initially associated with uranium. To increase the level of confidence of this uranium–fluorine association, the impact of the in situ recombination between fluorine and uranium, coming from two different particles, was measured. Results are given in the next section.| Operating conditions | APM | Microbeam |
|---|---|---|
| Primary ion current (O2+) | 150 nA | 250 pA |
| Raster area | 500 μm × 500 μm | No raster |
| Dynamic transfer | 100% | 0% |
| Contrast aperture | 400 μm | |
| Field aperture | 1800 μm | |
| Image field | 75 μm | |
| Energy bandwidth | 75 eV | |
| Analyzed masses, in brackets: acquisition time in s | 233U (6), 234U (6), 235U (15), 238U (15), 238UF (6) | 234U (4), 235U (2), 236U (4), 238U (1), 238UH (1), 238UF (1) |
| Presputtering time | 6 s | 0 s |
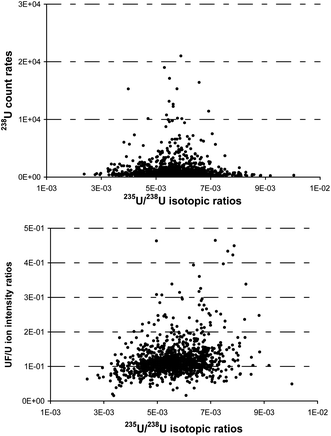
Once the data acquisition is completed, the APM image processing module determines the boundaries of the particles. Then, a selection based on the U isotopic composition, on the intensity of a given isotope or on the amount of fluorine can be carried out (see Fig. 2). Microbeam measurements were then performed on selected individual particles using a low primary current (250 pA) with a slightly defocused primary beam (Ø ∼ 2 μm) (see microbeam conditions in Table 2). 234U+, 235U+, 236U+, 238U+ and 238U1H+ ion intensities were recorded for determination of the U isotopic composition, whereas the 238UF+ ion intensity was measured to determine the relative amount of fluorine in U particles.
For all measurements, the 238U1H+ ion intensity was used for the uranium hydride correction of the 236U+ signal, and the IMF correction was determined by measuring U020-A particles within the same measurement conditions. All isotopic ratios given in this paper are corrected for the IMF and the corresponding expanded uncertainties are given with a coverage factor of 2.
As the work presented here is based on the comparison of the relative amount of fluorine between reference materials and real samples, the concentration of fluorine in the different particles was not calculated. Thus the ion intensity ratios 238UF+/238U+ were not corrected using the relative sensitivity factor (RSF) which is usually defined to convert secondary ion count rates into concentration levels. Actually, the calculation of this RSF requires the knowledge of the exact concentration of fluorine in the uranium matrix. Moreover, the RSF can be matrix-dependent and can differ between UOC, UF4 and other uranium compounds. So, only the relative amounts of fluorine were considered. The given uncertainties for the 238UF+/238U+ correspond to the counting statistics.
Results and discussion
Influence of thermal treatment on the detection of fluorine in uranium particles
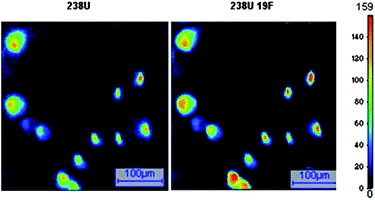
In order to eliminate residual organic compounds that can induce isobaric interference at U isotopic masses, the IAEA recommends heating the carbon planchet at 400 °C for 30 min after particle deposition.17 However, according to previous studies on UO2F2 particles, a decrease of the fluorine signal after thermal treatment at 350 °C over 6 h is observed.9 For this reason, the impact of heating on the fluorine signal was investigated for UF4 particles. APM analyses were performed on carbon planchets on which heated and non-heated UF4 particles were separately deposited. Ionic images acquired on 0.25 mm2 surfaces (5 × 5 fields of 500 μm × 500 μm) were treated with the autothreshold CAMECA program. The number of detected U particles at the m/z of 238U was ∼100 for both disks. The detection efficiency of these particles at the m/z of 238UF was 100% on non-heated particles and fell down to 12% on heated particles. So, fluorine containing uranium particles are harder to detect after the heat treatment. Moreover depth profile analyses carried out on UF4 particles showed that heating at 400 °C for 30 min decreases the relative amount of fluorine by a factor of ca. 30. Therefore, no heating is carried out when fluorine detection is required.In other respects, the absence of isobaric interference on a blank carbon planchet with only PIB/nonane coating was verified. No particles were detected both at 238U+ and 238UF+ masses after an APM analysis and the ion intensities in each APM field were 1000 times lower than the signal measured for UF4 particles. Ion images of non-heated UF4 particles obtained under the APM analytical conditions are given in Fig. 3. The mass spectrum recorded for an individual UF4 particle is shown in Fig. 4 along with the mass spectrum obtained for a blank carbon planchet under the same analytical conditions. All peaks are attributed to uranium species (U, UOxCyFz, and associated hydrides) and the main species are identified on the spectra. The absence of isobaric interference due to the carbon planchet is confirmed.
Gas phase in situ recombination between fluorine, coming from NaF particles and uranium, coming from UOCs
Individual particles coming from the CRMs UOC “Bolet” and “Chanterelle” samples, the corresponding samples with NaF particles and the CRM UF4 were measured in depth profile mode in order to get the ion intensity ratios of 238UFx/238U, x = 1, 2 or 3 (see Fig. 5). Attempts were made to measure the 238UF4+ ion but no signal was detected even for the CRM UF4 sample. These ion intensity ratios correspond to the ratio of the integrated counts of each species, i.e. of 238UFx+ and 238U+.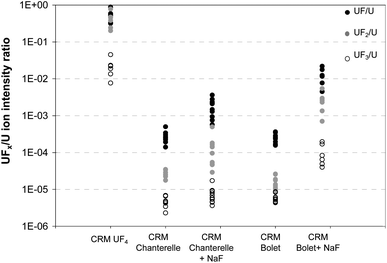 | ||
| Fig. 5 UFx/U ion intensity ratios of CRM UF4 and CRM UOCs with and without the addition of NaF particles. | ||
The addition of NaF particles increased all the 238UFx/238U ion intensity ratios by one to two decades. The highest increase of these ratios is observed for the CRM “Bolet”. This can be explained by a higher ratio of NaF/UOC particles in this sample (4 times more) than in the sample prepared with CRM “Chanterelle”.
This result indicates that in situ recombination of F and U ions occurs during an analysis. Nevertheless the ion ratio 238UF/238U of CRM UOCs never reaches the one of CRM UF4, even after the addition of high amounts of fluorine bearing particles.
This preliminary study also shows that the 238UF/238U and 238UF2/238U ion ratios in CRM UF4 are in the same range whereas the 238UF2/238U ion ratios in UOCs are still lower than the 238UF/238U ones even after the addition of NaF. The use of the 238UF2/238UF ratio to discriminate between fluorine which is chemically linked to uranium and fluorine which is not included in a U bearing particle (coming from a nearby NaF particle) was investigated. The 238UFx/238U ion ratios of the samples CP 1 and CP 2 coming from the outside of the conversion plant buildings were measured. The 238UF/238U ratios were characteristic of a conversion activity (see the next chapter) but the 238UF2/238UF ratios were much lower than the one of the standard UF4 particles and were similar to the one of UOCs (see Fig. 6). These conversion plant particles were probably not pure UF4 particles. They may have been modified by environmental conditions prior to the sampling or by laboratory storage conditions. Studies are on-going to determine the evolution of UF4 particles under different conditions (light, humidity, age and temperature). Another study on the ageing of UO2F2 particles in the environment showed that the 238UF2/U ionic ratio, measured by SIMS, decreased faster than the 238UF/U ionic ratio under the effect of humidity, light level and temperature.12 According to these preliminary results, the 238UF2/U and 238UF2/UF ionic ratios cannot be used yet to discriminate between different industrial origins of uranium. All the determinations of the relative amount of fluorine in particles described in this paper are based on the measurement of the 238UF/U ionic ratio.
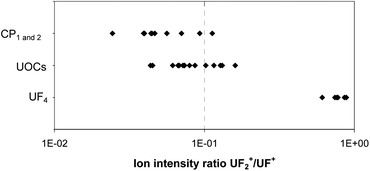 | ||
| Fig. 6 UF2/UF ion intensity ratios measured for particles from the UF4 CRM, the UOC CRMs and from the two samples collected outside the buildings of the conversion facility (CP1 and CP2). | ||
Relative amount of fluorine in U particles coming from the fuel cycle upstream the enrichment step
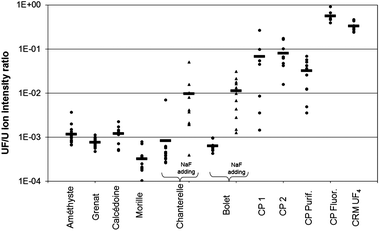
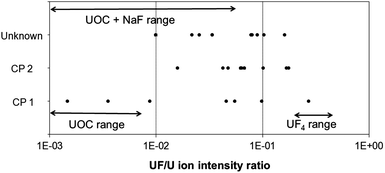
Particles coming from the CRM UOC samples with and without NaF particles, the CRM UF4 and the conversion plant samples were measured according to the methodology described in this paper. After detection and location of U particles with the APM software, F and U isotopic measurements were carried out in microbeam mode. Uranium isotopic compositions were all in agreement with the natural uranium (NU) composition, with an average atomic isotopic ratio 235U/238U of (7.27 ± 0.21) × 10−3 (2σ). Relative amounts of fluorine for about 10 particles of each sample and their average amounts are compared in Fig. 7. The same trends were also observed with the 238UF+/238U+ ratios given by the modified APM acquisition.Fluorine was detected in all the particles. The lowest amount of fluorine was measured in the 6 UOC CRM samples. An outlier in the “Chanterelle” sample with a UF/U intensity ratio one decade above the others was observed. This higher UF+ signal may come from contamination by F-rich particles present in the laboratory atmosphere during the sample preparation or by an in situ recombination during SIMS analysis. Nevertheless, the average amount of fluorine of this sample did not differ significantly from the one obtained in the other UOC CRMs. In addition, this result shows that it is essential to analyze more than one particle to get reliable information. Fluorine was also detected in significant amounts in UF4 CRMs and in some of the particles from the conversion plant even if 4 years elapsed between the sampling and the analysis. The highest amount of fluorine was logically found in the fluorination workshop, i.e. the place where UOC is converted to UF4. Moreover the amount of fluorine was in agreement with the value measured in the CRM UF4. The CP sample which contained the lowest amount of fluorine was the one collected in the purification workshop, where UOC is purified prior to the fluorination step. However the average amount of fluorine measured in this sample was higher than the one measured in pure UOC samples. This can be attributed to the closeness between the purification and the fluorination workshops which allows exchange of UF4 and UOC particles between the two workshops. Concerning the CP 1 and CP 2 samples, which contain particles collected outside the buildings, larger variations of the amount of fluorine amounts between these particles were observed because different types of particles are present in the facility. The lowest values of fluorine correspond to UOC particles, present for instance in the purification workshop, whereas the highest values are in agreement with the amount of fluorine measured in particles coming from the fluorination workshop. Nevertheless the average of the relative amount of fluorine differs by about two decades between particles from the UOCs and from the conversion plant and by about one decade after the addition of NaF particles to UOCs. Thus, the measurement of the relative amount of fluorine allows discrimination between these two uranium cycle steps whereas isotopic measurements cannot. This result, obtained on particles collected 4 years ago in the surroundings of the conversion plant, shows also that the storage in a plastic bag at ambient temperature and in the dark is enough to prevent a significant loss of fluorine and the disappearance of the conversion signature.
Application of the methodology to a real-life environmental sample
After particle extraction from the swipe with the vacuum impactor technique, the carbon planchet was analysed by SEM to estimate the number and size of U particles and to detect the possible presence of fluorine. However, detection of fluorine by SEM is not sufficient to know if uranium was converted and enriched or just converted. Only isotopic measurements can provide this information.A total of ∼3700 particles were detected amongst which 0.4% (i.e. 14 particles) were U-bearing particles. The sizes of all particles but one were between 0.5 μm and 1 μm. The SEM image and the associated EDX spectrum of the largest particle (approximately 7 μm × 4 μm) are given in Fig. 8. The EDX spectrum revealed the presence of fluorine in these 14 U-bearing particles.
 | ||
| Fig. 8 SEM images and associated EDX spectra of the largest U-bearing particle detected in the real-life environmental sample. | ||
Using APM acquisition, 28 U-bearing particles were detected with a relative amount of fluorine in the same range as the one observed in the conversion plant samples. Isotopic measurements were carried out on 10 representative particles. The average atomic isotopic ratio 235U/238U is (7.299 ± 0.178) × 10−3 (2σ) which is in good agreement with NU. In addition, these microbeam analyses confirmed the presence of fluorine (see Table 3) and the highest values of the 238UF+/238U+ ratios were in the same range as the one observed in the conversion plant samples (see Fig. 9). The highest relative amounts of fluorine are a clear signature that a conversion process was applied to uranium at one point before the sampling. According to these isotopic ratios and fluorine results, it can be concluded that the uranium detected in the unknown sample was man-modified, with evidence of uranium conversion to UF4 at one point before the particles were sampled. The institution which provided us with this sample confirmed that this sample came from a conversion facility.
| Particle | 238UF/238U |
|---|---|
| # 1 | 0.08883 ± 0.00059 |
| # 2 | 0.07969 ± 0.00037 |
| # 3 | 0.1602 ± 0.0010 |
| # 4 | 0.02169 ± 0.00024 |
| # 5 | 0.10304 ± 0.00084 |
| # 6 | 0.0780 ± 0.0011 |
| # 7 | 0.02541 ± 0.00033 |
| # 8 | 0.00994 ± 0.00025 |
| # 9 | 0.03357 ± 0.00049 |
| # 10 | 0.03357 ± 0.00049 |
Conclusions
This study demonstrates that the SIMS technique with the Duoplasmatron source allows automatic detection of fluorine in U particles in a matrix with other particulate materials (environmental dust), thanks to the APM protocol developed here. Moreover the simultaneous measurement of U isotopic ratios and of the relative amount of fluorine on individual particles can provide information on the industrial origin of particles and allows identification of UOC purification, U conversion and U enrichment steps. Despite the fact that limited precautions (plastic bag, ambient temperature, dark) were taken for the storage of the samples before and after particle deposition on a carbon planchet, fluorine was detected in particles collected 4 years ago in the surroundings of a conversion plant. In addition in situ recombination of U and F, coming from mixing NaF particles and U particles, showed that the level of recombination is not sufficient to induce a 238UF+/238U+ ratio in the same range as the one of real uranium–fluorine particles. The use of other criteria, such as the 238UF2+/238UF+ and 238UF2+/238U+ ion intensity ratios, was also investigated to increase the level of confidence on the industrial origin of uranium particles but further work is necessary to validate them. Studies are also ongoing to characterize the UF4 particle ageing under different conditions (light, humidity, light). Finally, the analysis of an unknown real-life environmental sample confirmed the potential of the SIMS technique to identify a conversion activity at one point before the particle sampling.Thanks to its triple capacity, particle mapping, trace element measurements and isotopic ratio measurements, SIMS can be used well beyond “traditional” nuclear safeguard measurements (U isotope ratio measurements in micrometer-sized particles) and has great potential for nuclear forensic analysis.
Acknowledgements
The authors acknowledge the International Atomic Energy Agency for supplying samples and related information.References
- E. Kuhn, D. Fisher and M. Ryjinski, Environmental sampling for IAEA Safeguards: a five year review. IAEA-SM-367/10/01 2001.
- A. J. Pidduck, M. R. Houlton, G. M. Williams and D. L. Donohue, in Micro-analytical characterization of Uranium particles in support of environmental sampling for safeguards, Institute of Nuclear Materials Management Annual Meeting, Nashville, TN, 2006 Search PubMed.
- J. C. Vickerman, A. Brown and N. M. Reed, Secondary Ion Mass Spectrometry, Principles and Applications, Oxford University Press, New York, 1989 Search PubMed.
- G. Tamborini, M. Betti, V. Forcina, T. Hiernaut, B. Giovannone and L. Koch, Spectrochim. Acta, Part A, 1998, 53, 1289–1302 CrossRef.
- C. G. Lee, K. Iguchi, J. Inagawa, D. Suzuki, F. Esaka, M. Magar, S. Sakurai, K. Watanabe and S. Usuda, J. Radioanal. Nucl. Chem., 2007, 272, 299–302 CrossRef CAS PubMed.
- S. Baude and R. Chiappini, IAEA-SM-367-10105, 2002.
- J. A. Carter and D. M. Hembree, Formation and characterization of UO2F2 particles as a result of UF6 hydrolysis, Task A.200.3, K/NSP-777, Oak Ridge Gaseous Diffusion Plant, 1998.
- P. W. Pickrell, Characterization of the solid, airborne materials created by the interaction of UF6 with atmospheric moisture in a contained volume, K/PS-144–DE82 015436, Union Carbide Corporation, Nuclear Division, Oak Ridge Gaseous Diffusion plant, 1982.
- R. S. Kips, A. Leenaers, G. Tamborini, M. Betti, S. Van den Berghes, R. Wellum and P. Taylor, Microsc. Microanal., 2007, 156–164 CrossRef CAS PubMed.
- R. Kips, M. J. Kristo, I. D. Hutcheon, Z. Wang, T. J. Johnson, D. C. Gerlach, J. E. Amonette, K. B. Olsen and E. Stefaniak, Proc. Radiochim. Acta, 2011, 1, 7–11 Search PubMed.
- R. Kips and M. J. Kristo, J. Radioanal. Nucl. Chem., 2009, 282, 1031–1035 CrossRef CAS PubMed.
- R. Kips, A. J. Pidduck, M. R. Houlton, A. Leenears, J. D. Mace, O. Marie, F. Pointurier, E. A. Stefaniak, P. D. P. Taylor, S. Van Den Berghes, P. Van Espen, R. Van Grieken and R. Wellum, Spectrochim. Acta, Part B, 2009, 64(3), 199–2007 CrossRef PubMed.
- R. S. Kips and R. Wellum, Fluorine as a Safeguards tool for age dating of Uranium oxyfluoride particles?, ESARDA Bulletin no. 38, 2008 Search PubMed.
- P. M. L. Hedberg, P. Peres, J. B. Cliff, F. Rabemananjara, S. Littmann, H. Thiele, C. Vincent and N. Albert, J. Anal. At. Spectrom., 2011, 26(2), 406–413 RSC.
- F. Esaka, K. Watanabe, H. Fukuyama, T. Onodera, K. T. Esaka, M. Magara, S. Sakurai and S. Usuda, J. Nucl. Sci. Technol., 2004, 41(11), 1027–1032 CrossRef CAS.
- R. S. Kips and M. J. Kristo, J. Radioanal. Nucl. Chem., 2009, 282, 1031–1035 CrossRef CAS PubMed.
- D. Donohue, Environmental sample analysis, Advances and future trends IAEA-CN-184/159.
| This journal is © The Royal Society of Chemistry 2014 |

