Chemotaxis of catalytic silica–manganese oxide “matchstick” particles†
Adam R.
Morgan‡
a,
Alan B.
Dawson‡
a,
Holly S.
Mckenzie
a,
Thomas S.
Skelhon
a,
Richard
Beanland
b,
Henry P. W.
Franks
c and
Stefan A. F.
Bon
*a
aDepartment of Chemistry, The University of Warwick, Coventry, CV4 7AL, UK. E-mail: s.bon@warwick.ac.uk; Web: www.bonlab.info Tel: +44 (0)2476 574009
bDepartment of Physics, The University of Warwick, Coventry, CV4 7AL, UK
cDepartment of Computer Science, The University of Warwick, Coventry, CV4 7AL, UK
First published on 3rd September 2013
Abstract
Particles that can undergo directed self-propulsion are desirable for colloidal cargo delivery and self-assembly. Herein we describe the synthesis of silica–manganese oxide “matchstick” colloids that undergo catalytic self-propulsion by consumption of hydrogen peroxide. Chemotaxis is observed when particles are placed in a fuel gradient. Movement opposes convective flow which is tracked by following inert polymer microspheres simultaneously.
Autonomous movement of microscopic particles or organisms in liquids operates in a regime where inertial forces are often insignificant.1 Here colloidal matter undergoes Brownian motion, whereby the mean squared displacement is diffusive in character over long time intervals. In addition to this random movement certain particles and microorganisms have the ability to undergo self-propulsion, which can be expressed in the form of “enhanced diffusion coefficients”. Broadly speaking there are two ways how small objects dispersed in fluids can self-propel. (1) They are motile and undergo a time-irreversible mechanical deformation, such as bacteria/flagella, or Purcell swimmers.2,3 (2) They generate a gradient field onto their local environment. For the latter, there are a plethora of mechanisms proposed. Examples include the traditional camphor or soap boat,4 bubble propulsion,5 diffusiophoresis,6 induced electrophoresis,7 and catalytic fluid pumping.8 Self-propulsion can be made directional, when external gradients are imposed on the particles.9–13 In manmade systems, the direction of motion is the apex of colloidal delivery of cargo and self-assembling systems. An elegant example whereby an external magnetic field is used has been described by Sanchez et al.14 who demonstrated that catalytic microtubes undergoing bubble propulsion can be guided against the direction of fluid flow in microfluidic channels. Light induced self-propulsion and dynamic assembly of photoactivated colloidal particles into colloidal crystals were recently demonstrated by Palacci and coworkers.15 When the external gradient is of a chemical origin, one speaks of (chemo)taxis. This is crucial in the movement of microorganisms in their quest to survive. They use “temporal sensing” as an internal feedback loop to determine the direction of the gradient. Velegol and coworkers showed that bimetallic colloidal rods could be accumulated into a gel, which was soaked in hydrogen peroxide as the attractant and fuel.16
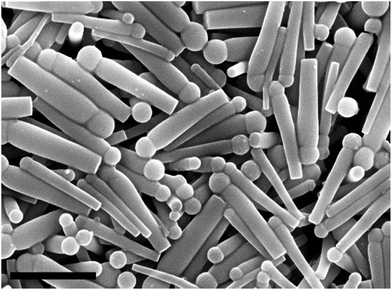
We set out to develop “matchstick” shaped particles with a catalytic head which can undergo chemotaxis (see Fig. 1). The reason for this design was twofold. Firstly, high aspect ratio rod-like particles are a favourable geometry for chemotactic swimmers, as seen for example in nature in the shapes of highly motile bacterial cells.17 Zerbetto et al.18 showed using dissipative particle dynamics that rods with an aspect ratio of 5 were more efficient propulsion devices over long time intervals than catalytic Janus spheres, rods with a lower aspect ratio, and disk-like particles. High aspect ratio rod-shaped particles have their rotational diffusion suppressed, which facilitates translational motility.19,20 Secondly, the engine that drives the self-propulsion needs to be localized at a specific part on the microparticle. A “matchstick” type of design whereby the head contains the engine, in this case a metal oxide catalyst, is ideal as it shows asymmetry perpendicular to the direction of self-propulsion, and at the same time it maintains rotational symmetry parallel to the plane of motion.
Our strategy for the fabrication of the “matchstick” particles found its origin in a versatile procedure for the preparation of silica microrods which used water droplets as the seed for silica growth.21 The synthetic twist, which led to the design of a distinct “matchstick” head, was to introduce this catalytic engine by templating the water droplets with in situ prepared metal oxide nanoparticles. These nanoparticles served as Pickering stabilizers thus decorating the emulsion droplets.
In a typical reaction 0.20 mL of a 0.18 M aqueous sodium citrate solution, 0.84 mL of a 0.10 M manganese sulfate solution, and 3.00 mL of ethanol were added to 30.00 mL of a 100 g L−1 poly(vinyl pyrrolidone) solution in 1-pentanol. This mixture was emulsified after which 0.40 mL of 18.1 M aqueous ammonia solution was added to initiate the formation of manganese oxide nanoparticles. After 2 minutes, 0.30 mL of tetraethylorthosilicate was added to start silica growth (see the ESI† for further details).
SEM characterization clearly shows that our target “matchstick” shaped particles had been formed (see Fig. 1). The mean averages of the overall length (1702 ± 208 nm), head width (327 ± 107 nm), and tail width (234 ± 93 nm) were calculated from analysis of 100 particles from SEM images. The aspect ratio of our particles tapers along the long axis of the rod, averaging at 5.2 at the end containing the “matchstick” head, and 7.3 at the opposite end. These aspect ratios approximate the criteria outlined by Zerbetto and coworkers for efficient self-propulsion.
If our synthesis strategy is correct, that is that the manganese oxide nanoparticles act as Pickering stabilizers, and thus armor the water droplets, then the manganese oxide should be concentrated predominantly in the head of our “matchstick” particles, with a small enrichment at the opposite end. The latter occurs upon protrusion of the growing silica rod out of the armored water droplet. This distribution of manganese oxide is indeed confirmed by spatial TEM EDAX analysis of a single rod (see Fig. 2, Table 1 and the ESI†). In addition, XRD patterns of our catalytic microrods were measured as a function of temperature up to 850 °C throughout which it transitioned from being amorphous into a complex mixture of silicon, oxygen, and manganese crystalline polymorphs (see the ESI for details – Fig. S2 and S3†).
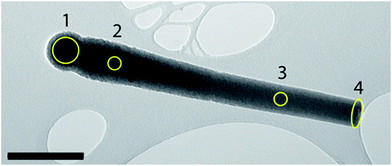 | ||
| Fig. 2 TEM image of an individual SiO2–MnxOy rod that was analyzed via EDAX at each area shown. The results of the analysis are summarized in Table 1. Scale bar = 400 nm. | ||
| Analysis area in Fig. 1B | Weight% Mn2O3 | Weight% SiO2 |
|---|---|---|
| 1 | 19.4 | 80.6 |
| 2 | 1.0 | 99.0 |
| 3 | 2.0 | 98.0 |
| 4 | 3.3 | 96.7 |
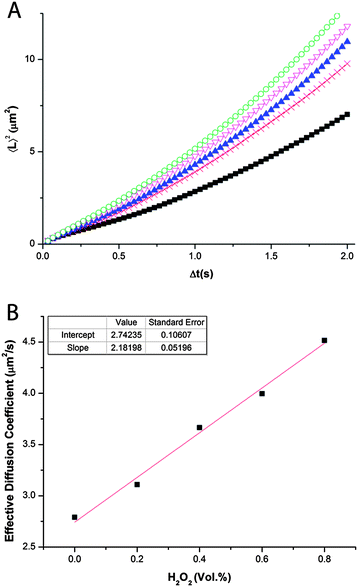
The use of manganese oxide as a choice of catalytic engine in the head of our micro-matchsticks allows the particles to self-propel in the presence of hydrogen peroxide as the fuel. Particle tracking was used to study the enhanced diffusion of the particles in the presence of hydrogen peroxide in water as dispersion medium by means of measuring the mean squared displacement (MSD) as a function of time interval. One of the inherent problems with tracking of catalytically motile particles that have the potential to generate bubbles upon consumption of hydrogen peroxide is that bubble formation can lead to erroneous results. These arise from either direct imaging of bubbles instead of particles, or the generation of convection gradients induced by bubble formation, their Ostwald ripening, or buoyancy. To avoid bubbles, we decided to keep the concentrations of the fuel low (0%, 0.20%, 0.40%, 0.60%, and 0.80% H2O2 by volume) to ensure oxygen generation was kept below water saturation levels.
An excellent discussion on methodology to distinguish propulsion from other motion-inducing phenomena, such as Brownian motion, convection, and sedimentation or creaming, was recently outlined by Howse and coworkers.22 Propulsion can be distinguished by observing a crossover from ballistic propulsion at short time intervals, to a combination of Brownian motion and propulsion at longer time intervals. This transition from ballistic to diffusive behavior is linked to rotational diffusion.23
Typically we tracked 50 individual particles at each concentration of hydrogen peroxide (see the ESI† for details). The individual tracking profiles of the particles show a typical random walk behavior, so that motion due to other phenomena such as convection can be ruled out (see the ESI – Fig. S4†). For this it is important to state that no bulk concentration gradient of hydrogen peroxide is imposed.
The data were averaged to provide one single MSD vs. Δt plot (see Fig. 3A). It can be observed that each of the datasets is curved in a way that two separate linear regimes can be identified spanning short and long time intervals, respectively. The slope of the linear region at short time intervals is the ballistic component. Its increase in value upon higher hydrogen peroxide concentration can be assigned to catalytic self-propulsion of our matchsticks. The calculated effective diffusion coefficient shows apparent first order kinetic behavior with respect to the overall hydrogen peroxide concentration in water (see Fig. 3B). In the absence of hydrogen peroxide the Brownian diffusion coefficient is 2.74 μm2 s−1. Adding hydrogen peroxide leads to an increase in the effective diffusion coefficient. For example at a concentration of 0.8 vol% H2O2 an experimental value of 4.52 μm2 s−1 is obtained. An increase of the effective diffusion coefficient of 2.18 μm2 s−1 per unit vol% of H2O2 is impressive for self-propulsion via diffusiophoresis. This confirms that a matchstick design is indeed an excellent choice for the shape of self-propelling microparticles. At higher concentrations of fuel propulsion occurs through formation of bubbles (Fig. S6†).
One phenomenon of interest in the motion of microparticles and organisms would be the capability to control its direction. In our case an imposed gradient of hydrogen peroxide should cause our matchstick particles to undergo chemotaxis. Experiments were conducted in a wax-sealed Dunn cell with the hydrogen peroxide solution (0.75 vol% H2O2), placed in the outer well, and particles dispersed in water in the inner well and on the cover slip (see Fig. S7†). In order to prove that the motion of the particles was indeed caused by chemotaxis we added polystyrene microspheres to the same sample as a control. A movie of this chemotaxis experiment is provided in the ESI† (a sped-up version as well as its real-time original). Three snapshots taken at different times are given in Fig. 4. Note that the hydrogen peroxide containing well is the top right dark part of the images. To guide the eye, vectors are overlaid that track three catalytic matchstick rods (red arrows) and three microspheres (yellow arrows). It can be seen that the “inert” microspheres undergo convection in this case away from the hydrogen peroxide filled well, whereas the catalytic rods counteract this force in order to reach the higher concentrations of fuel located in the well. The hydrogen peroxide acts like a chemo-attractant. This is logical as the effective diffusion coefficient of the catalytic matchstick particles increases for higher hydrogen peroxide concentrations (see Fig. 3B). There does also appear to be a correlation between the initial distance from the well and the distance travelled due to chemotaxis (Fig. S8†) over a period of 90 seconds, which can be rationalized in terms of the higher effective diffusion coefficient at higher concentrations of fuel.
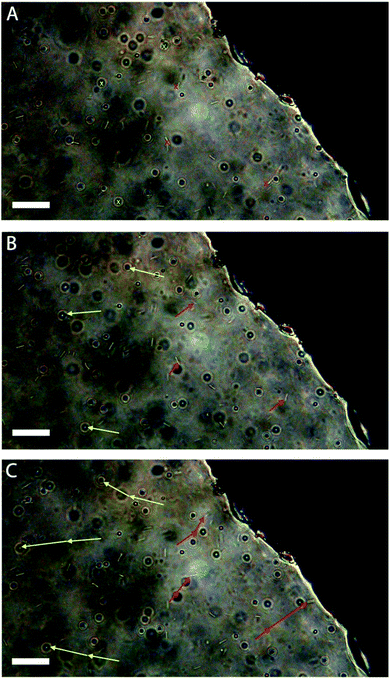 | ||
| Fig. 4 Optical micrographs taken from Video S1† showing a mixture of chemically “inert” polystyrene microspheres and self-propelled catalytic silica–manganese oxide rods in the presence of a hydrogen peroxide gradient (H2O2 well is on the right of the images) at (A) t = 0 s, (B) t = 35 s, (C) t = 70 s. Red vectors show rod displacement between each image, whereas yellow vectors indicate motion of microspheres between each image. Scale bar = 10 μm. | ||
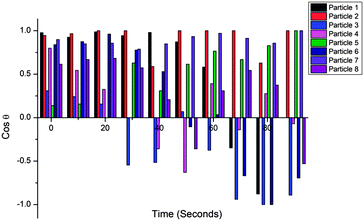
One important aspect of the matchstick particles undergoing chemotaxis is their respective orientation to the imposed fuel gradient. We analyzed this as follows. A tangent line to the edge of the well containing hydrogen peroxide was drawn in order to demark the “finish line” (see Fig. S9†). We denote that when the particle is perpendicular to this tangent line with the head facing forward, it has an angle of 0°. In the opposite case where the particle is perpendicular to the tangent, but the head is at the back, an angle of 180° is assigned. By taking the cosine of the angle in radians when the catalytic head is facing forward, i.e. 1st and 4th quadrant, it returns a positive value, and when it is facing backwards, i.e. 2nd or 3rd quadrant, a negative value. We tracked 8 particles and monitored their angle at 10 second intervals (see Fig. 5).
Looking at the distribution that we obtain in the cosine of the angle it is apparent that there is a significant bias towards the case in which the head is facing forwards. It is quite impressive that over half of the particles never actually reverse orientation over 90 seconds – even though there is significant convection and Brownian rotation.
Conclusions
In conclusion, we have reported a method for synthesis of matchstick shaped silica-based microparticles that have an asymmetric inclusion of manganese oxide nanoparticles, predominantly concentrated in the head of the rods. We showed that this particle design is an effective self-propelling object, which can undergo directed motion through chemotaxis. We believe that our synthesis approach is versatile and should allow for future fabrication of micro-objects of added complexity. The ability to direct motion of these colloidal structures can form a platform for advances in supracolloidal science.Acknowledgements
The authors wish to thank Peter W. Dunne, David Burnett, and Luke A. Rochford for help with XRD analysis. We thank EPSRC, Chemistry Innovation, and AkzoNobel for funding (ARM). Some of the equipment used was funded by West Midlands AM2 Science City initiative.Notes and references
- E. M. Purcell, Am. J. Phys., 1977, 45, 3 CrossRef.
- R. Dreyfus, J. Baudry, M. L. Roper, M. Fermigier, H. A. Stone and J. Bibette, Nature, 2005, 437, 862 CrossRef CAS PubMed.
- R. Golestanian, Phys. Rev. Lett., 2010, 105, 018103 CrossRef.
- N. J. Suematsu, Y. Ikura, M. Nagayama, H. Kitahata, N. Kawagishi, M. Murakami and S. J. Nakata, J. Phys. Chem. C, 2010, 114, 9876 CAS.
- K. M. Manesh, M. Cardona, R. Yuan, M. Clark, D. Kagan, S. Balasubramanian and J. Wang, ACS Nano, 2010, 4, 1799 CrossRef CAS PubMed.
- H. J. Keh and Y. K. Wei, Colloid Polym. Sci., 2000, 278, 539 CAS.
- W. F. Paxton, A. Sen and T. E. Mallouk, Chem.–Eur. J., 2005, 11, 6462 CrossRef CAS PubMed.
- T. R. Kline, W. F. Paxton, Y. Wang, D. Velegol, T. E. Mallouk and A. Sen, J. Am. Chem. Soc., 2005, 127, 17150 CrossRef CAS PubMed.
- J. Burdick, R. Laocharoensuk, P. M. Wheat, J. D. Posner and J. Wang, J. Am. Chem. Soc., 2008, 130, 8164 CrossRef CAS PubMed.
- T. R. Kline, W. F. Paxton, T. E. Mallouk and A. Sen, Angew. Chem., Int. Ed., 2005, 44, 744 CrossRef CAS PubMed.
- W. Gao, A. Pei, X. Feng, C. Hennessy and J. Wang, J. Am. Chem. Soc., 2013, 135, 998 CrossRef CAS PubMed.
- S. Sundararajan, P. E. Lammert, A. W. Zudans, V. H. Crespi and A. Sen, Nano Lett., 2008, 8, 1271 CrossRef CAS PubMed.
- G. Zhao, S. Sanchez, O. G. Schmidt and M. Pumera, Chem. Commun., 2012, 48, 10090 RSC.
- S. Sanchez, A. A. Solovev, S. M. Harazim and O. G. Schmidt, J. Am. Chem. Soc., 2011, 133, 701 CrossRef CAS PubMed.
- J. Palacci, S. Sacanna, A. P. Steinberg, D. J. Pine and P. M. Chaikin, Science, 2013, 339, 936 CrossRef CAS PubMed.
- Y. Hong, N. M. K. Blackman, N. D. Kopp, A. Sen and D. Velegol, Phys. Rev. Lett., 2007, 99, 178103 CrossRef.
- K. D. Young, Curr. Opin. Microbiol., 2007, 10, 596 CrossRef PubMed.
- F. Lugli, E. Brini and F. Zerbetto, J. Phys. Chem. C, 2012, 116, 592 CAS.
- A. Ortega and J. García de la Torre, J. Chem. Phys., 2003, 119, 9914 CrossRef CAS.
- Y. G. Tao, W. J. Den Otter, J. T. Padding, J. K. G. Dhont and W. J. Briels, J. Chem. Phys., 2005, 122, 244903 CrossRef PubMed.
- A. Kuijk, A. Van Blaaderen and A. Imhof, J. Am. Chem. Soc., 2011, 133, 2346 CrossRef CAS PubMed.
- G. Dunderdale, S. Ebbens, P. Fairclough and J. Howse, Langmuir, 2012, 28, 10997 CrossRef CAS PubMed.
- J. Howse, R. Jones, A. Ryan, T. Gough, R. Vafabakhsh and R. Golestanian, Phys. Rev. Lett., 2007, 99, 8 CrossRef.
Footnotes |
| † Electronic supplementary information (ESI) available: Experimental details of synthetic and analytical techniques, XRD pattern and scattering intensity as a function of temperature, optical microscope images of bubble formation, particle trajectories from particle tracking. information pertaining to error analysis of the particle tracking measurements, and further information pertaining to the orientation analysis and translational movement of the particles undergoing chemotaxis. Videos of particle movement through chemotaxis are also provided. See DOI: 10.1039/c3mh00003f |
| ‡ These authors contributed equally. |
| This journal is © The Royal Society of Chemistry 2014 |

