Lithium-ion storage properties of titanium oxide nanosheets†
Veronica
Augustyn
ab,
Edward R.
White
bc,
Jesse
Ko
ab,
George
Grüner
bc,
Brian C.
Regan
bc and
Bruce
Dunn
*ab
aDepartment of Materials Science and Engineering, University of California, Los Angeles, CA 90095, USA. E-mail: bdunn@ucla.edu; Fax: +1 310-206-7353; Tel: +1 310-825-1519
bCalifornia NanoSystems Institute, University of California, Los Angeles, CA 90095, USA
cDepartment of Physics and Astronomy, University of California, Los Angeles, CA 90095, USA
First published on 17th December 2013
Abstract
A detailed kinetic analysis is used to determine the fundamental energy storage properties and rate capabilities of TiO2 nanosheets. These materials exhibit different properties compared to anatase nanocrystals including a shift to lower redox potentials for Li+ storage and the reversible charge storage of Na+. Nanosheets are intriguing for energy storage applications due to the fact that nearly the entire surface of the material, including specific crystal facets, can be exposed to the electrolyte.
Electrochemical energy storage (EES) plays a ubiquitous part in our daily lives primarily through the use of portable electronic devices and hybrid vehicles. Moreover, EES is expected to play a key role in the expansion of renewables because of the need to store the intermittent energy of these sources. Although batteries are the most widely used EES technology, electrochemical capacitors (ECs) possess several attractive properties that complement or exceed those of batteries. The current technology for ECs is based on electric double layer capacitors (EDLCs) where charge storage is due to the faradaic adsorption of electrolyte ions onto the surface of a high surface area carbon.1 A second type of capacitive storage is that of pseudocapacitance, a non-faradaic process in which charge storage can arise from either surface redox reactions or ion insertion that is not limited by solid-state ion diffusion.2
Although EDLCs have high power capabilities, the energy density for EDLCs is below that of batteries. For that reason, a key research objective in the EC field is to increase their energy densities while maintaining the high power capabilities. One particularly popular direction has been to study nanomaterials because of their high surface areas and controllable surface chemistry.3–6 While the impact of nanoparticle size has been well-characterized, the effects of surface orientation and morphology on EES behavior are just beginning to be addressed as synthesis methods become more sophisticated. Among the transition metal oxides used for EES, TiO2 and associated compounds have been well studied. Anatase TiO2 is often a starting point for these investigations as the material has been considered for lithium-ion batteries and electrochemical capacitors in nanocrystal,6,7 nanotube,8 and nanosheet9 morphologies.
Nanosheets are particularly intriguing for energy storage applications due to the fact that nearly the entire surface of the material can be exposed to the electrolyte. In addition, the material can be engineered to grow in specific directions10–12 leading to the exposure of a particular surface facet to the electrolyte. Electrochemical measurements of Li+ intercalation into anatase single crystals have shown that the exposure of different anatase surface orientations to the electrolyte leads to different redox potentials, charge transfer rates and diffusion coefficients.13 Density functional theory (DFT) calculations have shown that nanosheet thickness also plays an important part in determining the material behavior.14 Previous research on anatase TiO2 nanosheets9,15,16 has shown that these materials exhibit excellent capacity retention at high rates, but in these cases the energy storage properties were investigated with composite electrodes that utilized carbons and binders. While such composite electrodes are essential for device applications, they make the determination of fundamental behavior difficult. In this work, we present the electrochemical characterization of single-layer anatase nanosheets (NS) with exposed {001} facets without utilizing any carbons or binders in the electrode in order to determine their fundamental electrochemical behavior. We present a detailed kinetic analysis to determine their energy storage and rate capabilities as compared to anatase nanocrystals (NCs). We also show that, in contrast to NCs or bulk anatase, TiO2 nanosheets exhibit reversible insertion/de-insertion of sodium-ions.
The solvothermal synthesis of anatase TiO2 NS with exposed {001} facets has been reported previously.11 A key step in the process is to substitute oleylamine with tetrabutylammonium hydroxide which effectively exfoliates the lamellar structure of the oleylamine-bound nanosheets. The electrochemical behavior of the NS as well as TiO2 nanocrystals (NC) was examined by utilizing drop-cast electrodes and three-electrode cells with lithium or sodium ion non-aqueous electrolytes (see ESI† for detailed experimental procedure).
XRD of TiO2 NS before and after exfoliation and TiO2 NC are shown in Fig. S1.† The diffraction pattern of the NS before exfoliation is indicative of two dimensional crystal growth in the a–b directions with ordering along the c direction. It has been shown previously that the oleylamine ligand binds tightly to the (001) facet of the NS and results in a lamellar structure.11 After exfoliation, the NS become randomly ordered and the diffraction pattern is featureless. The addition of water to the synthesis results in NCs as demonstrated by the fact that the anatase reflections are now those of the bulk material. TEM images of the NS and NC (after treatment with TBAOH) are shown in Fig. S2.† The electron diffraction pattern corresponds to anatase TiO2, not TiO2 (B) (Fig. S3†), and the electron beam does not modify the nanosheet structure during the time it takes to perform the imaging (Fig. S4†). In addition, the small amount of NCs present in the NS sample from trace moisture during the synthesis are not entirely responsible for the observed anatase diffraction pattern (Fig. S5†). The NS exhibit sheet-like morphology, and the thickness of each sheet was previously measured to be approximately 7.5 Å (ref. 11) corresponding to molecular layer thickness. Fig. S6† demonstrates that after exfoliation, nanosheets that lie flat on the TEM grid beam exhibit a strong diffraction peak corresponding to the (200) plane of anatase, and that the (101) peak is greatly suppressed. Such a diffraction pattern is indicative of nanosheets that expose the (001) plane, consistent with the XRD pattern. The NC grow in a rhombohedral morphology of approximately 70 nm in length and 40 nm in width as shown in Fig. S2.†
The cyclic voltammograms (CVs) for the first 10 cycles at 10 mV s−1 of NS and NCs, after treatment with TBAOH, are shown in Fig. 1a and b. Although TBAOH does not exfoliate the NCs, it does render them more soluble in ethanol than when they are capped with oleylamine. In the case of the NS, cycling between 1 and 3 V vs. Li/Li+ initially results in a low capacity with cathodic peaks at 2.1, 1.57, and 1.1 V and anodic peaks at 1.44 and 2 V. After 10 cycles the CV becomes stable and there is one set of broad peaks at 1.3 and 1.48 V for the cathodic and anodic currents, respectively. During the first 10 cycles, the capacity of the NS electrode increases from 99 to 135 mA h g−1, which is likely due to the exchange of TBA+ with Li+. In addition, there was obvious blue electrochromism of the electrode, indicative of oxidation/reduction of TiO2. TEM micrographs of the NS before and after cycling are shown in Fig. 2. While the material appears to remain in a sheet-like morphology, the surface is covered entirely by the solid–electrolyte interphase (SEI) layer. In the case of the NCs, the first cycle in the CV results in a set of sharp peaks (at 1.65 and 2.3 V for the cathodic and anodic currents, respectively) corresponding to Li+ insertion/de-insertion in bulk anatase. There is an additional cathodic peak at 1 V due to either the irreversible insertion of Li+ into the NCs or the growth of the SEI on the surface. Further cycling down to 1 V at 10 mV s−1 reduced the capacity from 136 to 67 mA h g−1.
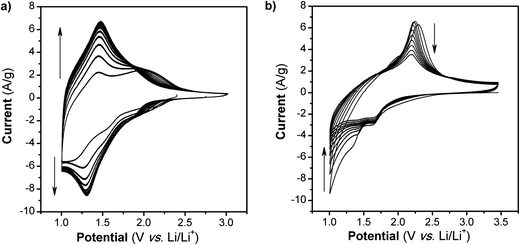 | ||
| Fig. 1 CVs at 10 mV s−1 in Li+ for TiO2 (a) NS and (b) NC. After 10 cycles at this rate and potential range, the capacity of the NS increases while in the case of the NC, it fades. | ||
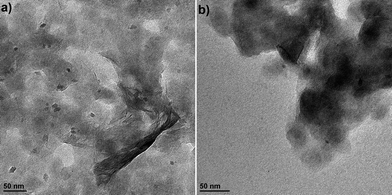 | ||
| Fig. 2 TEM images of the TiO2 NS (a) after exfoliation with TBAOH and before electrochemical cycling and (b) after electrochemical cycling in a Li+ electrolyte at 10 mV s−1 for 5 cycles. | ||
The significant peak shift to lower potentials indicates that the lithium storage sites in the NS are different from those in the NC. The shape of the NS CV in Li+ electrolyte has more in common with that of TiO2 (B)17,18 and particularly hydrogen titanates (e.g. H2Ti3O7)19,20 than anatase. While there is a possibility of the NS undergoing a phase transformation during exfoliation with TBAOH,21 there are no reports of such processes occurring at room temperature. In addition, the electron diffraction pattern taken after exfoliation does not index to H2Ti3O7 or TiO2 (B). During the first 10 cyclic voltammetry cycles, the NS undergo a subtle rearrangement, which leads to an increase in capacity. According to DFT calculations, the transition from anatase to lepidocrocite TiO2 can occur with no energy barrier for a bilayer of anatase oriented along the (001) direction.22 Lepidocrocite TiO2 is a building block of the titanates23 which, when dehydrated, transform into TiO2 (B).18 This close structural relationship between anatase NS of only a few molecular layers and lepidocrocite TiO2 may explain the reason why the NS store Li+ at potentials commonly associated with the hydrogen titanates and TiO2 (B).
The XPS scans of the O 1s, Ti 2p and N 1s regions in TiO2 NS before and after cycling at 10 mV s−1 are shown in Fig. S7.† For the O 1s region (Fig. S7a†), initially there is a large peak corresponding to Ti–O bonds in TiO2 and a smaller broad peak corresponding to hydroxide bonds, presumably due to the presence of tetrabutylammonium hydroxide. After cycling, the O 1s region contains additional contributions from O–C, O–N, and O–Cl bonds which have to do with the composition of the SEI layer. In the Ti 2p region (Fig. S7b†), before and after cycling the oxidation state of Ti corresponds to Ti4+ in TiO2. The slight shift in the binding energy after cycling indicates that some Li+ may remain in the NS. In the N 1s region (Fig. S7c†) initially there is one peak corresponding to the presence of tetrabutylammonium. After cycling, that peak disappears and instead there is a peak corresponding to nitrate, presumably due to the presence of lithium nitrate in the SEI products. The disappearance of the tetrabutylammonium peak indicates that this ion is exchanged by Li+ during electrochemical cycling.
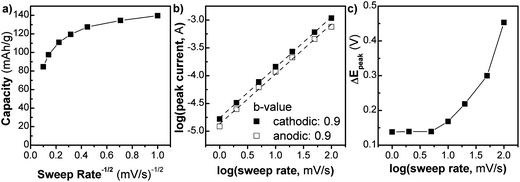
We investigated the kinetics of the NS (Fig. 3) using analytical approaches that take advantage of the differences between diffusion and capacitive charge storage processes. In Fig. 3a, the capacity of the NS (Q) is plotted vs. v−1/2 (where v is the sweep rate of the cyclic voltammetry experiment) from 1 to 100 mV s−1. In this type of plot, linear regions are those that are limited by semi-infinite diffusion, as proposed by Trasatti et al.:24
| Qtot = Q∞ + constant(v−1/2) |
The extrapolation of the plot to the y-intercept leads to the determination of the “infinite sweep rate” capacitance, Q∞, which corresponds to the capacitive (or surface-controlled) capacity. For the NS, up to 20 mV s−1 the Q vs. v−1/2 plot is relatively constant. At this sweep rate the charging time is only 60 s. In this region, the kinetics are not controlled by semi-infinite diffusion, corresponding well with the fact that the material is mostly surface. After 20 mV s−1 the capacity begins to change rapidly in a linear fashion corresponding to diffusion-controlled behavior. The maximum capacity of 140 mA h g−1, observed at 1 mV s−1, corresponds to the storage of 0.4 Li+/TiO2, which is similar to that of nanocrystalline anatase TiO2.25 At a timescale of 60 seconds (v = 20 mV s−1), the capacity decreases somewhat to 110 mA h g−1.
A related analysis can be performed on the behavior of the peak current (i) vs. sweep rate:25
| i = avb |
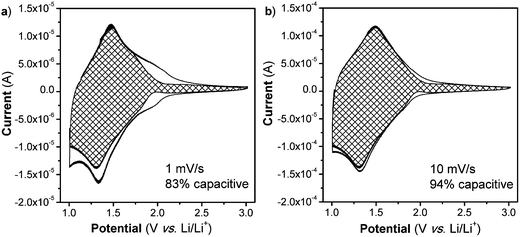
Lastly, one hallmark of surface-controlled reactions is small peak voltage offsets (difference between the cathodic and anodic peak voltages, ΔEp), with perfect surface-controlled behavior exhibiting 0 V offset at slow rates.28 The ΔEpvs. log(v) plot is shown in Fig. 3c. In the case of the NS, at 1 mV s−1 the peak voltage offset is 0.14 V (Fig. S8†) and remains relatively constant up to 5 mV s−1 followed by significant increase above 20 mV s−1which correlates well with the switch to fully diffusion-controlled behavior at faster sweep rates. It is possible to determine the potential regions where the diffusion contributions occur in the CV plots by using a more detailed analysis (Fig. 4). In this analysis, the current at a particular voltage is considered to contain contributions from diffusion and capacitive processes:29
| i(V) = k1v + k2v1/2 |
We also determined the electrochemical behavior of NS in a Na+ non-aqueous electrolyte. Previous research on Na+ insertion in TiO2 has demonstrated that anatase TiO2 nanoparticles (Degussa P25, ∼27 nm diameter) do not exhibit Na+ storage.30 On the other hand, TiO2 nanotubes do store Na+ when their lattice is widened through doping with niobium30 or by using an appropriate geometry.31 Our results further support the importance of morphology in achieving reversible Na+ insertion. The CV at 1 mV s−1 (t = 20 min) for TiO2 NS cycled in a Na+ electrolyte for 3 cycles is shown in Fig. 5. The NS exhibit a CV that has broad peaks and a reversible capacity of 50 mA h g−1. The peaks in the CV of the NS indicate that redox reactions are taking place while the multiple cycles show that the process is highly reversible. The capacity of the NS as a function of charging time is shown in Fig. 5b. Our results demonstrate that the open NS morphology enables the access of Na+ ions to the Ti redox sites.
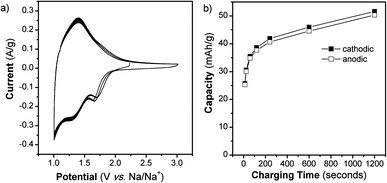 | ||
| Fig. 5 TiO2 NS cycled in a Na+ non-aqueous electrolyte. (a) CVs at 1 mV s−1 for 3 cycles and (b) capacity vs. charging time from 1 to 100 mV s−1, as calculated from the 2nd cycle of each CV. | ||
It is interesting to compare the electrochemical behavior of the TiO2 NS in Li+ and Na+ electrolytes. Based upon the location of the redox peaks, as well as the capacity, it is clear that Na+ is stored differently from Li+. In the Li+ electrolyte, the anodic peak occurs at 1.48 V vs. Li/Li+, whereas in Na+ electrolyte, the anodic peak is at 1.40 V vs. Na/Na+ (1.73 V vs. Li/Li+). At 1 mV s−1, the capacity in the Li+ electrolyte is almost 3 times that in the Na+ electrolyte.
TiO2 NS exhibit highly reversible and high-rate charge storage in Li+ and Na+ non-aqueous electrolytes with CVs that are significantly different from those of nanocrystals. These results show that the 2D nanosheet morphology has a profound influence on the potentials and the reaction kinetics associated with energy storage in anatase. Due to the large exposed surface of the nanosheets, the rate limiting step for lithium-ion storage is a surface-limited process and solid-state ion diffusion is no longer rate-limiting, even at the peak voltage. As compared to nanocrystals, the peak voltage for lithium insertion in the nanosheets occurs 0.4 V lower. The peak voltage separation is also affected by the change in morphology. At a voltammetric sweep rate of 1 mV s−1, the peak voltage separation is decreased from 0.36 in the nanoparticles to 0.13 V for the nanosheets indicating the highly reversible nature of the redox reaction. In addition, at a sweep rate of 100 mV s−1 the nanosheets retain approximately 70% of the capacity at 1 mV s−1vs. 20% for the nanoparticles. Nanosheets possess several features that are advantageous for energy storage. The fact that the thickness is limited to a few atomic layers leads to high rate energy storage as all storage sites are located very close to or on the surface. Moreover, the openness of the structure enables charge storage to occur with larger ions such as sodium. The results of this fundamental study demonstrate that the nanosheet architecture allows for the tuning of energy storage properties beyond what is observed with bulk material morphologies.
Acknowledgements
This work was supported as part of the Molecularly Engineered Energy Materials, an Energy Frontier Research Center funded by the US Department of Energy, Office of Science, Office of Basic Energy Sciences, under award DE-SC001342. We also appreciate the partial support of this research by the Office of Naval Research. We would like to thank Dr Sergey Prikhodko and Hyungseok Kim for HRTEM and TEM measurements, respectively.References
- P. Simon and A. Burke, Electrochem. Soc. Interface, 2008, Spring 2008, 38–43 Search PubMed.
- B. E. Conway, Electrochemical Supercapacitors: Scientific Fundamentals and Technological Applications, Kluwer-Academic, 1999 Search PubMed.
- A. E. Fischer, M. P. Saunders, K. A. Pettigrew, D. R. Rolison and J. W. Long, J. Electrochem. Soc., 2008, 155, A246–A252 CrossRef CAS PubMed.
- Z. Gao, J. Wang, Z. Li, W. Yang, B. Wang, M. Hou, Y. He, Q. Liu, T. Mann, P. Yang, M. Zhang and L. Liu, Chem. Mater., 2011, 23, 3509–3516 CrossRef CAS.
- M. Sathiya, A. S. Prakash, K. Ramesha, J.-M. Tarascon and A. K. Shukla, J. Am. Chem. Soc., 2011, 133, 16291–16299 CrossRef CAS PubMed.
- J.-Y. Shin, D. Samuelis and J. Maier, Adv. Funct. Mater., 2011, 21, 3464–3472 CrossRef CAS.
- J. Wang, J. Polleux, J. Lim and B. Dunn, J. Phys. Chem. C, 2007, 111, 14925–14931 CAS.
- G. Zakharova, C. Jähne, A. Popa, C. Täschner, T. Gemming, A. Leonhardt, B. Büchner and R. Klingeler, J. Phys. Chem. C, 2012, 116, 8714–8720 CAS.
- J. S. Chen, H. Liu, S. Z. Qiao and X. W. Lou, J. Mater. Chem., 2011, 21, 5687–5692 RSC.
- X. Han, Q. Kuang, M. Jin, Z. Xie and L. Zheng, J. Am. Chem. Soc., 2009, 131, 3152–3153 CrossRef CAS PubMed.
- B. Wu, C. Guo, N. Zheng, Z. Xie and G. D. Stucky, J. Am. Chem. Soc., 2008, 130, 17563–17567 CrossRef CAS PubMed.
- A. Chemseddine and T. Moritz, Eur. J. Inorg. Chem., 1999, 1999, 235–245 CrossRef.
- R. Hengerer, L. Kavan, P. Krtil and M. Grätzel, J. Electrochem. Soc., 2000, 147, 1467–1472 CrossRef CAS PubMed.
- A. Vittadini and M. Casarin, Theor. Chem. Acc., 2008, 120, 551–556 CrossRef CAS PubMed.
- S. Ding, J. S. Chen, D. Luan, F. Y. C. Boey, S. Madhavi and X. W. D. Lou, Chem. Commun., 2011, 47, 5780–5782 RSC.
- H. B. Wu, X. W. Lou and H. H. Hng, Chem.–Eur. J., 2012, 18, 3132–3135 CrossRef PubMed.
- A. G. Dylla, P. Xiao, G. Henkelman and K. J. Stevenson, J. Phys. Chem. Lett., 2012, 3, 2015–2019 CrossRef CAS.
- M. Zukalová, M. Kalbáč, L. Kavan, I. Exnar and M. Grätzel, Chem. Mater., 2005, 17, 1248–1255 CrossRef.
- J. Li, Z. Tang and Z. Zhang, Electrochem. Commun., 2005, 7, 62–67 CrossRef CAS PubMed.
- M. Wei, K. Wei, M. Ichihara and H. Zhou, Electrochem. Commun., 2008, 10, 1164–1167 CrossRef CAS PubMed.
- F. Alvarez-Ramirez and Y. Ruiz-Morales, Chem. Mater., 2007, 19, 2947–2959 CrossRef CAS.
- T. Orzali, M. Casarin, G. Granozzi, M. Sambi and A. Vittadini, Phys. Rev. Lett., 2006, 97, 156101 CrossRef.
- M. Casarin, A. Vittadini and A. Selloni, ACS Nano, 2009, 3, 317–324 CrossRef CAS PubMed.
- S. Ardizzone, G. Fregonara and S. Trasatti, Electrochim. Acta, 1989, 35, 263–267 CrossRef.
- H. Lindström, S. Södergren, A. Solbrand, H. Rensmo, J. Hjelm, A. Hagfeldt and S.-E. Lindquist, J. Phys. Chem. B, 1997, 101, 7717–7722 CrossRef.
- Y. Wang, Z. Hong, M. Wei and Y. Xia, Adv. Funct. Mater., 2012, 22, 5185–5193 CrossRef CAS.
- J. Li, Z. Tang and Z. Zhang, Chem. Mater., 2005, 17, 5848–5855 CrossRef CAS.
- B. E. Conway, J. Electrochem. Soc., 1991, 138, 1539–1548 CrossRef CAS PubMed.
- T.-C. Liu, W. G. Pell, B. E. Conway and S. L. Roberson, J. Electrochem. Soc., 1998, 145, 1882–1888 CrossRef CAS PubMed.
- A. Ghicov, M. Yamamoto and P. Schmuki, Angew. Chem., Int. Ed., 2008, 47, 7934–7937 CrossRef CAS PubMed.
- H. Xiong, M. D. Slater, M. Balasubramanian, C. S. Johnson and T. Rajh, J. Phys. Chem. Lett., 2011, 2, 2560–2565 CrossRef CAS.
Footnote |
| † Electronic supplementary information (ESI) available. See DOI: 10.1039/c3mh00070b |
| This journal is © The Royal Society of Chemistry 2014 |

