Forming self-rotating pinwheels from assemblies of oscillating polymer gels†
Debabrata
Deb
,
Olga
Kuksenok
,
Pratyush
Dayal‡
and
Anna C.
Balazs
*
Chemical Engineering Department, University of Pittsburgh, Pittsburgh, PA 15261, USA. E-mail: balazs@pitt.edu; Tel: +1 412-648-9250
First published on 26th September 2013
Abstract
Using computational modeling, we show that millimeter-sized polymer gels undergoing the self-oscillating Belousov–Zhabotinsky (BZ) reaction can spontaneously self-aggregate to form macroscopic, self-rotating pinwheels. Notably, we find that the system is bistable and the formation of the pinwheels depends on initial random fluctuations. The pinwheel formation can, however, be promoted by tailoring the local concentration of the activator for the BZ reaction. Furthermore, we demonstrate approaches for controlling the chirality of the pinwheels' motion. These materials could form simple self-propelled machines, such as gears, that perform autonomous work.
Gears and pinwheels are designed to rotate in a particular direction, with the former enabling the functioning of larger machines and the latter bringing a source of amusement to children of all ages. While synthetic materials can self-assemble into a myriad of complex morphologies, there are few examples of systems that can spontaneously form a moving pinwheel-like structure. Specifically, self-organized, rotating assemblies have been created with the aid of applied fields,1–3 but to the best of our knowledge, to date there have been no reported synthetic systems that dynamically organize into a spinning assembly in the absence of external stimuli or agents.4 With the ability to self-organize into a coherent structure that undergoes regular circular motion, materials could be driven to autonomously form simple “machines” and the spontaneous interaction between these machines could then lead to the creation of more complex tools. Here, we use computational modeling to show the first step in this cascade of events: millimeter-sized polymer gels undergoing self-propelled motion to form a “pinwheel”, which spontaneously rotates (see Fig. 1). Furthermore, the directionality of this rotation can be controlled so that the pinwheel moves in a clockwise or counter-clockwise direction, indicating the ability to tailor the movement of these self-organized gears.
The materials displaying this unique behavior are polymer networks undergoing the oscillating chemical reaction known as the Belousov–Zhabotinsky (BZ) reaction.5,6 These BZ gels can undergo autonomous, self-oscillatory behavior due to the presence of a ruthenium catalyst, which is covalently bonded to the polymers.7–11 The BZ reaction generates periodic oxidation and reduction of the anchored metal ion (ruthenium catalyst).7–11 The hydrating effect of the oxidized metal catalyst induces an expansion of the gel, which then contracts when the catalyst is in the reduced state. In other words, the chemical energy from the BZ reaction is transduced into the mechanical oscillations of the gels. And hence, the gels can expand and contract without external input; notably, the BZ gels are the only polymer network that can pulsate in the absence of external stimuli.
To describe the dynamic behavior of the BZ gels, we use a modified version12 of the two-variable Oregonator model13,14 that explicitly takes into account the polymer volume fraction, φ. The governing equations for this system are:12,15
 | (1) |
 | (2) |
 | (3) |
| G(u, v, φ) = (1 − φ)2u − (1 − φ)v, | (4) |
 | (5) |
The parameters q, f and ε have the same meaning as in the Oregonator model.13
The constitutive equation for the gel is given by:12,16
 | (6) |
![[small sigma, Greek, circumflex]](https://www.rsc.org/images/entities/b_char_e111.gif) is the dimensionless stress tensor, Î is the unit tensor,
is the dimensionless stress tensor, Î is the unit tensor,  is the local strain tensor, and the isotropic pressure P(φ, v) is:
| P(φ, v) = −[φ + ln(1 − φ) + χ(φ)φ2 − χ*vφ] + c0v0φ(2φ0)−1, | (7) |
The osmotic term (in the square brackets) depends on χ(φ) = χ0 + χ1φ, which is derived from the Flory–Huggins parameter for the polymer–solvent interactions.12 The parameter χ* > 0 describes the hydrating effect of the oxidized catalyst and captures the coupling between the gel dynamics and the BZ reaction. The last term on the right side of eqn (7) describes the pressure from the elasticity of the network; c0 represents the crosslink density of the gel, v0 is the volume of a monomeric unit, and φ0 is the polymer volume fraction in the undeformed state.
We assumed12 that the total velocity of the gel/solvent system is v ≡ φv(p) + (1 − φ)v(s) = 0; with this assumption, the incompressibility condition, ∇·v = 0, is automatically satisfied. In other words, it is solely the polymer–solvent interdiffusion that contributes to the gel dynamics.12,17 We further assumed that dynamics of the gel is purely relaxational,17 so the forces that act on the deformed gel are balanced by the frictional drag due to the motion of the solvent. Consequently, we can obtain the polymer velocity as:12
 | (8) |
Given that we know the stress tensor (eqn (6)), we can compute the polymer velocity (eqn (8)) and hence, numerically integrate the dynamic equations (eqn (1)–(3)). We perform these calculations via our recently developed three-dimensional gel lattice spring model (gLSM),15 which combines both finite element and finite difference techniques. The gLSM has proven to be a powerful approach for predicting the behavior of these self-oscillating gels.16,18–23 Of particular relevance here, we predicted that rectangular-shaped BZ gels on a surface would undergo self-propelled, directed motion in the presence of light;24,25 these predictions have been recently confirmed experimentally.26 We have augmented the gLSM27 by incorporating the evolution of the activator concentration, u, outside the gels and within the external fluid:
 | (9) |
The last term on the right hand side represents the decay of the activator due to the disproportionation reaction.28 Hence, we account for the diffusive exchange of reagents between the gels and fluid, capturing reaction–diffusion processes occurring in the solution.27 By incorporating a short range, repulsive potential between gel pieces,29 we introduce excluded volume interactions and thereby prevent the motile samples from colliding and penetrating into each other.29 All our simulation parameters and their relationship to experimental values are given in Section A of the ESI.†
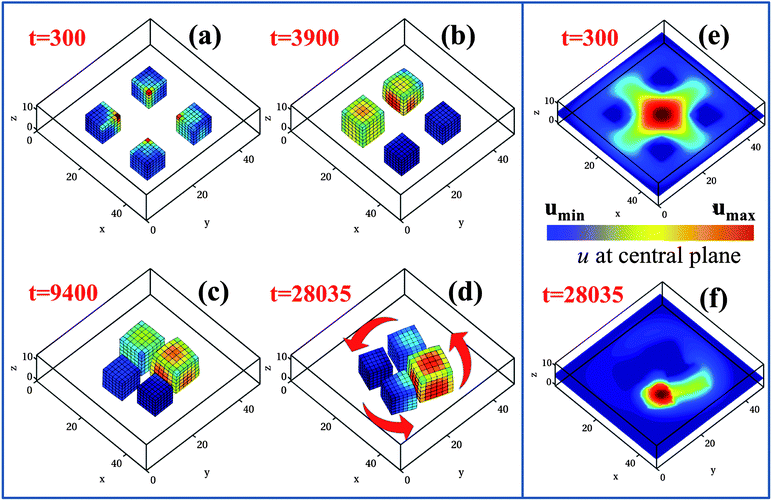
The BZ reaction occurring within the gels leads to the production of u within the polymer network and the subsequent diffusion of this activator into the surrounding solution. In previous studies,29 we showed that these gels not only emit u, but also “sense” the concentration of u in the fluid. Consequently, these gels exhibit a distinct form of auto-chemotaxis, moving to the highest concentration of the self-generated chemical gradient. This behavior is illustrated in Fig. 1, where we consider four equally spaced BZ gel cubes that are located on the lower wall of the simulation box; these gel pieces can slide freely on this surface. The simulation box is 49 × 49 × 13 lattice units in size and for each BZ cube l = 8.9 units on a side. Here, a lattice unit corresponds to ∼25 μm and hence, the cubes are 0.22 mm in size and the box size is ∼1.23 mm × 1.23 mm × 0.33 mm. Additionally, a unit of simulation time t represents 0.31 seconds (see Section A of the ESI,† where we relate our simulation parameters to experimental values).
Initially, the gel cubes are placed relatively far apart, with the distance between their centers being 20 units (Fig. 1a), which corresponds to 0.5 mm. We impose the constraint that u = 0 along all the side walls of the simulation box and apply no-flux boundary conditions on the top and bottom walls. As the reaction proceeds, the activator produced within the polymer network diffuses into the surrounding fluid and due to the symmetric arrangement of the gels, it becomes highly concentrated between the four neighboring cubes (see Fig. 1e). At later times, the cubes respond to the concentration gradient in u by moving significantly closer together, as shown in Fig. 1b and c.29 This behavior can be explained as follows. For a small, isolated sample, the intrinsic oscillation frequency of the BZ gel increases with the concentration of u in the surrounding solution.27 From Fig. 1a and e, it can be seen that the “inner” surfaces of the gel cubes (those facing the center of the simulation box) are exposed to the highest concentration of u and hence, have the highest intrinsic frequency. It is known that in systems of coupled oscillators, the one with the highest intrinsic frequency serves as the pacemaker and initiates the chemical waves traveling throughout the system.30,31 With respect to the system in Fig. 1a, this means that chemical waves within the gels travel from the inner to the outer surfaces (those facing the edges of the box). Due to the interdiffusion of the polymer and solvent, the gel moves in the direction opposite to these traveling waves and consequently, the four cubes all migrate toward the center of the box, forming the cluster shown in Fig. 1c. (The movement of the gels and chemical waves in opposite directions was observed via our simulations in other examples involving motile BZ gels.19,24,25,27,29) In effect, the gels move towards the highest concentration of u.
The above behavior sets the stage for the new phenomena described here: the autonomous formation of self-rotating “pinwheels”. As indicated in Fig. 1d, the four-cube assembly rotates around a central point; in this example, the rotation is counter-clockwise. Furthermore, each cube rotates about its center of mass, also in a counter-clockwise direction in this example. The concurrent temporal evolution of u resembles a moving comet, with a large “head” and a trailing “tail” (Fig. 1f), which circles about the center of the four-cube cluster in a clockwise direction.
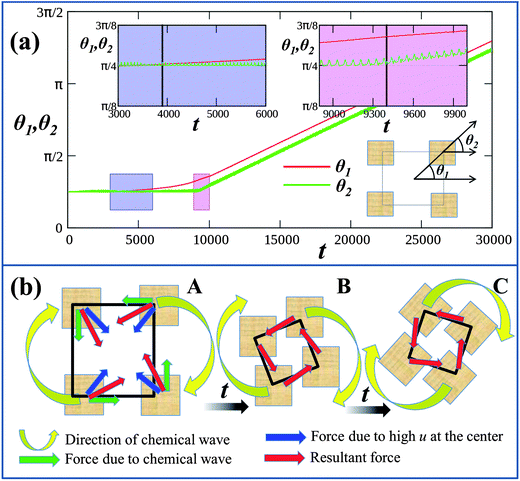
To pinpoint the times marking the rotation of the entire assembly and the rotation of the individual gels, in Fig. 2a we plot the respective rotation angles of the center of mass of the four-gel assembly, θ1, and of the individual gel, θ2, with respect to the horizontal axes (measured as shown in the schematic in the right lower inset of Fig. 2a). At early times, the gels move towards the center of the box only and hence no rotation is observed, so that both the angles θ1 and θ2 remain constant (and equal to their initial values, π/4). The plot of θ1 indicates that the entire assembly begins to rotate at t = 3900, when the cubes are still relatively far apart (as shown in Fig. 1b). As measured by θ2, each individual gel begins to rotate about its center of mass at t = 9400 (in the configuration shown in Fig. 1c); we refer to the latter time as the moment of pinwheel formation. (In Fig. 2a, for clarity, we plot θ2 only for a single gel; however, all the gels start rotating at roughly the same moment in time.)
The rotation of the four-cube assembly can be rationalized as indicated in the schematic in Fig. 2b, which shows the forces acting on the gels due to the gradients of u and excluded volume interactions. Image A represents the gel configuration at a time near Fig. 1b; as revealed in Fig. S1 and S2,† the chemo-mechanical oscillations among the gels now become phase locked. Specifically, there is a constant phase difference between the oscillations of neighboring gels and the chemical waves travel successively from one gel to the next, moving in a clockwise direction in this particular example. We observed that this mode of phase locking is a necessary component for ultimately forming pinwheels (which encompass both the rotating gel assembly and the spinning of the individual gels).
As noted above, the gels move in the direction opposite to that of the traveling chemical waves. Hence, the four gels are effectively driven towards the high concentration of u in the center of the box and to undergo a counter-clockwise rotation (in response to the clockwise rotation of the chemical wave). The resultant force drives the gels closer together at a slight angle with respect to the diagonal through the centers of the cubes (as marked by the red arrow in Fig. 2b) and thus, after some time, the gels self-organize into the structure drawn in B. As the gels continue to approach each other due to high concentration of u in the central region, the excluded volume interactions begin to affect their motion when the gels are within a distance rc of each other (see Fig. S3 in the ESI†). These excluded volume interactions exert a torque on the neighboring gels, leading to the structure drawn in C and the rotation of the individual gels about their centers of mass. In particular, the time when the individual gels begin to rotate (when θ2 > π/4) corresponds to the moment when the gels come within rc of each other (see Fig. S3 in the ESI†).
Notably, the above example represents the outcome of one simulation; for another independent simulation (i.e., using a different random seed), the system did not undergo rotation, but simply exhibited auto-chemotaxis, with the gels coming together in a configuration similar to Fig. 1c. To gain further insight into factors leading to the rotary motion, we plot the time evolution of quantities characterizing both the rotating and non-rotating systems in Fig. 3, where the points marked (a)–(d) correspond to images in Fig. 1. The parameter At represents the area of a square whose vertices are the centers of the four cubes;29At decreases as the cubes come closer together and remains lower for the self-rotating pinwheel, indicating that at late times, the cubes in the rotating structure lie closer together than the non-rotating cluster. Fig. 3b indicates that the average concentration of activator, uavg, in the system is significantly higher for the rotating than for the non-rotating assembly. (Note that uavg remains relatively constant after t = 9400, i.e., after the pinwheel is formed.) We previously showed that the oscillation frequency, ω, of an isolated gel increases with the concentration of u in the outer solution.27 Hence, from the values of uavg in Fig. 3b, it is understandable that ω, measured for one of the gels, is higher for the rotating systems (see Fig. 3c). Finally, we emphasize that both rotating and non-rotating scenarios are outcomes of the same simulation setup but are obtained with different initial random fluctuations. In other words, the system in Fig. 1 is bistable. For the initial configuration in Fig. 1a, we also find that the probability of realizing the non-rotating assembly is significantly higher than that for forming a pinwheel. From analyzing 24 independent simulations, we observed pinwheel formation in only three cases. Fig. 3 can, however, provide clues to promote the formation of pinwheels.
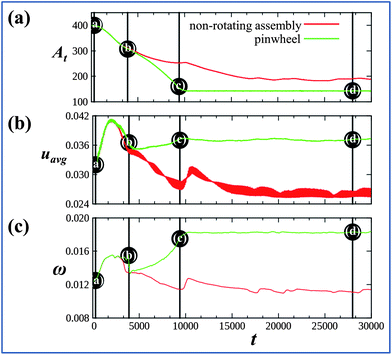 | ||
Fig. 3 Time evolution of various quantities related to the pinwheel (green curves) and non-rotating assembly (red curves). (a) Time evolution of the area At, the area of a square whose vertices are the centers of the four cubes. (b) Evolution of the average activator concentration, uavg. (c) Evolution of the frequency of oscillations, ω, in one of the four gels. Vertical lines are at t = 300, 3900, 9400, and 28![[thin space (1/6-em)]](https://www.rsc.org/images/entities/char_2009.gif) 035. The points marked as (a)–(d) on the green curves correspond to the respective systems shown in the Fig. 1(a)–(d). 035. The points marked as (a)–(d) on the green curves correspond to the respective systems shown in the Fig. 1(a)–(d). | ||
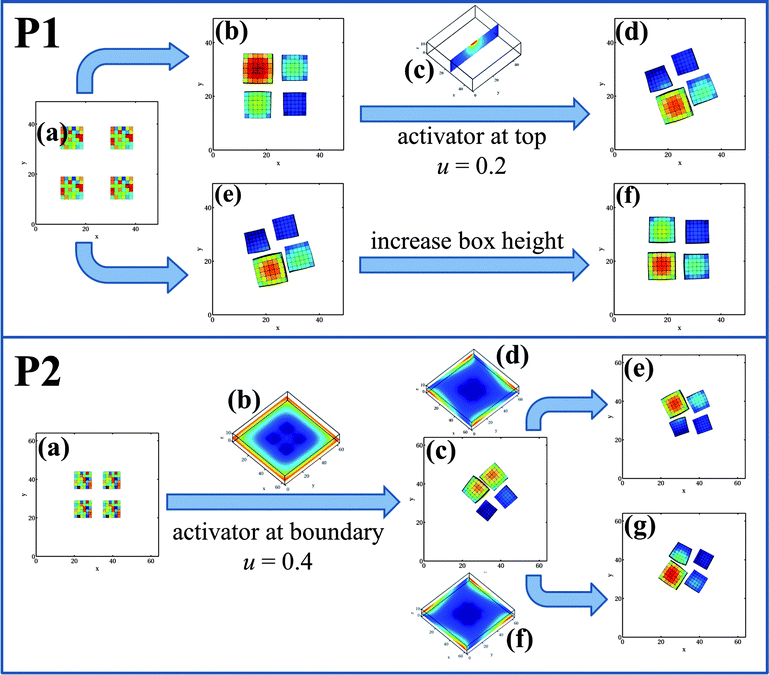
Fig. 3 clearly indicates that a critical difference between the rotating and non-rotating assemblies is the higher average concentration of u in the rotary system. We hypothesized that by increasing the concentration of u in the simulation box, the probability of forming the rotating assembly could be significantly increased and that a non-rotating assembly might be turned into a pinwheel. Fig. 4 reveals the validity of this hypothesis. We started with the initial configuration shown in P1a and selected a simulation run that ultimately yielded a non-rotary cluster at late times (as shown in P1b). With knowledge of the random seed that produced the latter result, we modified the initial conditions by imposing a high concentration of u at the center of the top wall of the simulation box (see P1c) and re-ran the simulation with the gels arranged as shown in P1a. (We maintain this value of u within a well-defined region of size 6 × 6 units around the center on the top wall and then remove this modification of the boundary conditions at t = 5000.) With this introduction of u, the value of uavg is sufficiently higher and the system now undergoes rotary motion (see P1d), with both the cluster and the individual gels spinning, similar to the scenario depicted in Fig. 1d. With this modification, 29 out of 32 independent simulations produced pinwheels.
To test our hypothesis further on the need for high concentrations of u to promote the spinning, we focused on a simulation that yielded a rotator (P1e). We increased the height of the simulation box by five lattice sites, while keeping all other conditions same, and ran the simulation with the original initial random seed and conditions depicted in P1a. Since the volume of the box is increased at fixed u, the value of uavg decreases and at late times, the system forms the non-rotating assembly (P1f). This behavior is robust; with the increased box height, we did not observe any bistability. All 16 independent simulations yielded non-rotating assemblies. Our results not only indicate that large activator concentrations are necessary for the circular motion of the assembly (and each gel), but also provide guidelines for controlling the dynamic behavior of the clusters, as shown in P2.
The scenario depicted in P2 sheds further light on necessary conditions for forming pinwheels and indicates a scheme for controlling the direction of rotation. With the initial configuration shown in P2a, the system always yields a non-rotating cluster (based on 24 independent runs). These cubes are initially placed closer together than in P1a (the distance between the centers is 15 units); the high concentration of u between these closely placed gels dominates the behavior of the system, keeping the gels effectively locked in position (with respect to each other), and effectively inhibits the dynamic cascade of events that enables the rotary behavior. These results indicate that the initial separation between the gels also plays a vital role in determining the dynamic behavior of the system.
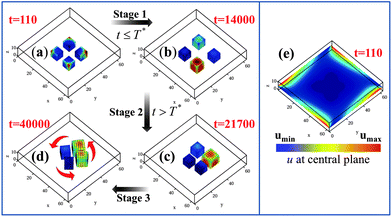
Knowing that the gels move to the highest concentration of u in the system, we can alter the above behavior by initially setting u = 0.4 at the edges of the simulation box in P2a; this ultimately leads to the pinwheel in P2c. Fig. 5 reveals that the transition from the non-rotating system in P2a to a rotating assembly in P2c can be divided into three distinct stages. During Stage 1 (from t = 0 to 14![[thin space (1/6-em)]](https://www.rsc.org/images/entities/char_2009.gif) 000), we maintain the u = 0.4 condition at the four edges of the simulation box (Fig. 5e). The gels have moved relatively far apart by t = 14
000), we maintain the u = 0.4 condition at the four edges of the simulation box (Fig. 5e). The gels have moved relatively far apart by t = 14![[thin space (1/6-em)]](https://www.rsc.org/images/entities/char_2009.gif) 000; with the gels driven towards the high u at the boundaries, the distance between the cubes' centers is roughly 20 units. Note, however, that the gel pieces are now spaced slightly asymmetrically with respect to each other and the walls (due to initial random fluctuations that give rise to differences in their trajectories). Hence, the average value of u around each gel32 can be different from its neighbor's. In effect, the u = 0.4 constraint served to break the symmetry of the system in Fig. 5a; now the gel surrounded by the higher concentration of u can act as a pacemaker, instigating synchronization among the beating gels. With this initial influx of u having served this symmetry breaking role, we now set u = 0 at the edges at time T* = 14
000; with the gels driven towards the high u at the boundaries, the distance between the cubes' centers is roughly 20 units. Note, however, that the gel pieces are now spaced slightly asymmetrically with respect to each other and the walls (due to initial random fluctuations that give rise to differences in their trajectories). Hence, the average value of u around each gel32 can be different from its neighbor's. In effect, the u = 0.4 constraint served to break the symmetry of the system in Fig. 5a; now the gel surrounded by the higher concentration of u can act as a pacemaker, instigating synchronization among the beating gels. With this initial influx of u having served this symmetry breaking role, we now set u = 0 at the edges at time T* = 14![[thin space (1/6-em)]](https://www.rsc.org/images/entities/char_2009.gif) 001.33 During Stage 2 (from t = 14
001.33 During Stage 2 (from t = 14![[thin space (1/6-em)]](https://www.rsc.org/images/entities/char_2009.gif) 001 to 24
001 to 24![[thin space (1/6-em)]](https://www.rsc.org/images/entities/char_2009.gif) 750), the system does replicate processes in Fig. 1a–c, with gels moving into positions that enable the phase locking of the oscillations, until the excluded volume interactions begin to affect their dynamics (Fig. 5c). Finally, during Stage 3 (t > 24
750), the system does replicate processes in Fig. 1a–c, with gels moving into positions that enable the phase locking of the oscillations, until the excluded volume interactions begin to affect their dynamics (Fig. 5c). Finally, during Stage 3 (t > 24![[thin space (1/6-em)]](https://www.rsc.org/images/entities/char_2009.gif) 750), the gels form a pinwheel (Fig. 5d).
750), the gels form a pinwheel (Fig. 5d).
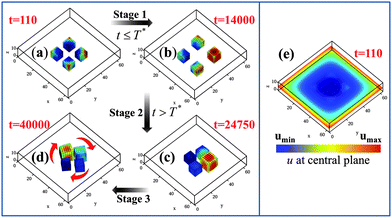 | ||
Fig. 5 Three stage mechanism of pinwheel formation. Stage 1 is from t = 0 to 14![[thin space (1/6-em)]](https://www.rsc.org/images/entities/char_2009.gif) 000, when u = 0.4 is set at the four edges of the simulation box (see (e), where the distribution of u in the plane z = 6 is shown at t = 110). (a) and (b) show the position of the gels at t = 110 and 14 000, when u = 0.4 is set at the four edges of the simulation box (see (e), where the distribution of u in the plane z = 6 is shown at t = 110). (a) and (b) show the position of the gels at t = 110 and 14![[thin space (1/6-em)]](https://www.rsc.org/images/entities/char_2009.gif) 000, respectively. Stage 2 begins when u = 0 is set at four edges (at T* = 14 000, respectively. Stage 2 begins when u = 0 is set at four edges (at T* = 14![[thin space (1/6-em)]](https://www.rsc.org/images/entities/char_2009.gif) 001) of the simulation box and ends at t = 24 001) of the simulation box and ends at t = 24![[thin space (1/6-em)]](https://www.rsc.org/images/entities/char_2009.gif) 750 when the gels get sufficiently close that the excluded volume interactions begin to affect their dynamics (as in (c)). Stage 3 corresponds to the gels forming pinwheels at t > 24 750 when the gels get sufficiently close that the excluded volume interactions begin to affect their dynamics (as in (c)). Stage 3 corresponds to the gels forming pinwheels at t > 24![[thin space (1/6-em)]](https://www.rsc.org/images/entities/char_2009.gif) 750, as shown in (d). Note that this simulation box is 64 × 64 × 13 and hence, larger than that in Fig. 1. 750, as shown in (d). Note that this simulation box is 64 × 64 × 13 and hence, larger than that in Fig. 1. | ||
All the pinwheels described above have an equal probability of rotating in either the clockwise or counter-clockwise direction. In addition, while our simulations show that the introduction of u at the boundaries (as in Fig. 5e) significantly increases the probability of pinwheel formation, the system still remains bistable. Out of 20 independent runs, we observe formation of non-rotating clusters in five cases, and pinwheels in 15 cases (eight of which were clockwise and seven were counter-clockwise). Importantly, it is only for the pinwheel-forming cases that we observe distinct differences between the values of u around the different gels, with these critical differences resulting in the phase-locking pattern (as discussed above).
As shown in P2d–g of Fig. 4, we found that the directionality of the pinwheel rotation can be controlled by applying gradients in u at the four walls of the simulation box; the distribution in Fig. 4P2d yields a clockwise motion of the pinwheels (Fig. 4P2e), while the distribution in Fig. 4P2f yields the counter-clockwise motion of the pinwheels (Fig. 4P2g). The details of the process are shown in Fig. 6 for the case of the counter-clockwise rotation. The distinctive feature of this case is that during Stage 1, a linear gradient in u from u = 0 to 0.6 is set along all the four edges of the simulation box in a counter-clockwise manner (see the right panel in Fig. 6e, where the distribution of u in the plane at z = 6 is shown at t = 110). At Stage 2, this gradient is replaced with the condition that u = 0 at the four edges of the simulation box and again the dynamic steps similar to those in Fig. 1a–c are repeated, with excluded volume interactions starting to play a role at the end of the Stage 2 (Fig. 6c). This procedure results in the counter-clockwise rotation of the pinwheel in Stage 3 (Fig. 6d). The introduction of a comparable gradient in the clockwise direction during Stage 1 results in a pinwheel rotating in the clockwise direction during Stage 3. Hence, we have established a means of controlling the chirality of the motion for the configuration in P2a. Moreover, this process is robust and the clockwise (counter-clockwise) pinwheel formation is now observed in all of our simulations (18 independent runs for each direction).
The gradients of u along the edges of the simulation box serve to orient the gels, drag them apart and produce a slightly asymmetric arrangement of these cubes (with respect to the center of the box). Hence, by the end of the Stage 1, the average values of u around the gels32 have distinctly different values. The major difference between the scenarios in Fig. 5 and 6 is that the patterning in Fig. 6 effectively controls the average distributions of activator around the gels at the end of Stage 1. For example, for the counter-clockwise rotation shown in Fig. 6, we find the highest distribution of u by the end of the Stage 1 to be around gel 4 and the second higher value around the neighboring gel 3 (for gel numbering, see Fig. S2 of ESI†). Such distributions of u at the end of Stage 1 set the directionality of the rotating traveling wave to be in a clockwise direction (from gel 4 to gel 3), which results in a pinwheel rotating in a counter-clockwise direction. Changing the patterning on the wall from counter-clockwise to clockwise effectively “flips” the average values of u around these gels and the resulting direction of the rotating traveling wave.
Finally, we consider an assembly of 16 cubes as shown in Fig. 7. The box is now 124 × 124 × 13 units in size and the gel pieces are placed as shown in Fig. 7a, with four square-shaped clusters in the box. The initial center-to-center distance between the clusters is 70 units and within each cluster, the initial center-to-center distance between the gels is 25 units. We impose the u = 0 constraint at the edges of the box and allow the system to self-organize. Remarkably, in this scenario each of the clusters forms a pinwheel. Namely, the cluster rotates and each cube in the pinwheel spins. Using the same setup in five independent simulations, we observed that in four cases, the system self-organized into four separate pinwheels, as in Fig. 7, while in one case, the system produced three pinwheels and only one non-rotating assembly. The significantly higher probability of pinwheel formation in the larger system can be attributed to: (1) the asymmetric positioning of the gels within each cluster with respect to the outer walls and the other clusters and (2) effects of the interactions between different groups of gels. Both these factors introduce asymmetry and hence lead to differences in the average values of u around the gels within each cluster, thereby promoting pinwheel formation. These results indicate that fundamental properties of the system, i.e., the motion induced by the self-generated chemical gradients and the excluded volume interactions, give rise to a novel dynamic state. Namely, the four cubes of BZ gels characteristically self-organize into a pinwheel.
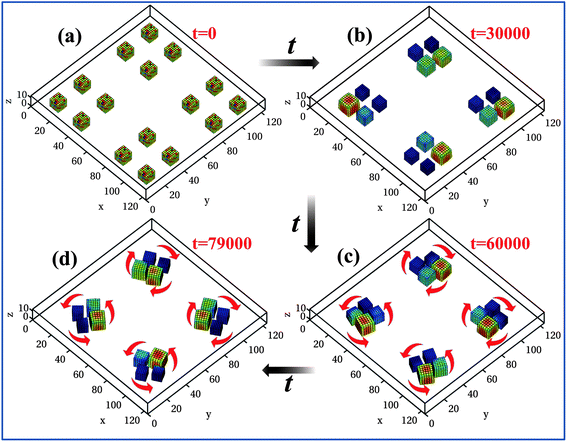 | ||
Fig. 7 Dynamics in colony of 16 self-oscillating BZ gels at times t = 0 (a), 30![[thin space (1/6-em)]](https://www.rsc.org/images/entities/char_2009.gif) 000 (b), 60 000 (b), 60![[thin space (1/6-em)]](https://www.rsc.org/images/entities/char_2009.gif) 000 (c), and 79 000 (c), and 79![[thin space (1/6-em)]](https://www.rsc.org/images/entities/char_2009.gif) 000 (d). Red arrows mark the direction of rotation of the pinwheels. 000 (d). Red arrows mark the direction of rotation of the pinwheels. | ||
In summary, we used computational modeling to show that self-oscillating polymer gels autonomously undergo a cascade of dynamic, interlinked events, which lead to the formation of a self-propelled rotator. To the best of our knowledge, this is the first observation of a system that inherently forms this structure and it does so in the absence of external stimuli. The driving force for this behavior is an internalized chemical reaction that “fuels” the mechanical oscillations and movement of the gels. The autonomous rotations of the cluster and the assembly of clusters in Fig. 7 indicate that these materials can form simple gears, and pave the way for harnessing the assemblies to perform self-propelled work. In future studies, we will determine how to drive the motion of entire four-cube rotators so that when these pinwheels come within the critical distance, the rotation of one can controllably direct the rotation of the other. In this way, we can begin to design self-driven interlocking gears that can be harnessed as a simple self-assembled machine.
Acknowledgements
The authors gratefully acknowledge financial support from the ARO (for DD), AFOSR (for OK) and NSF (for ACB).References
- J. Yan, M. Bloom, S. C. Bae, E. Luijten and S. Granick, Nature, 2012, 491, 578–581 CrossRef CAS PubMed.
- A. Snezhko, M. Belkin, I. S. Aranson and W. K. Kwok, Phys. Rev. Lett., 2009, 102, 118103 CrossRef CAS.
- A. Snezhko and I. S. Aranson, Nat. Mater., 2011, 10, 698–703 CrossRef CAS PubMed.
- A. Sokolov, M. M. Apodaca, B. A. Grzybowski and I. S. Aranson, Proc. Natl. Acad. Sci. U. S. A., 2010, 107, 969–974 CrossRef CAS PubMed.
- B. P. Belousov, Collection of Short Papers on Radiation Medicine, Medgiz, Moskow, 1959 Search PubMed.
- A. N. Zaikin and A. M. Zhabotinsky, Nature, 1970, 535–537 CrossRef CAS PubMed.
- R. Yoshida, T. Takahashi, T. Yamaguchi and H. Ichijo, J. Am. Chem. Soc., 1996, 118, 5134–5135 CrossRef CAS.
- R. Yoshida, S. Onodera, T. Yamaguchi and E. Kokufuta, J. Phys. Chem. A, 1999, 103, 8573–8578 CrossRef CAS.
- S. Sasaki, S. Koga, R. Yoshida and T. Yamaguchi, Langmuir, 2003, 19, 5595–5600 CrossRef CAS.
- R. Yoshida, Colloid Polym. Sci., 2011, 289, 475–487 CAS.
- K. Miyakawa, F. Sakamoto, R. Yoshida, E. Kokufuta and T. Yamaguchi, Phys. Rev. E: Stat. Phys., Plasmas, Fluids, Relat. Interdiscip. Top., 2000, 62, 793–798 CrossRef CAS.
- V. V. Yashin and A. C. Balazs, J. Chem. Phys., 2007, 126, 124707 CrossRef PubMed.
- J. J. Tyson and P. C. Fife, J. Chem. Phys., 1980, 73, 2224–2237 CrossRef CAS.
- J. J. Tyson, in Oscillations and Traveling Waves in Chemical Systems, ed. R. J. Field and M. Burger, Wiley, New York, 1985, pp. 93–144 Search PubMed.
- O. Kuksenok, V. V. Yashin and A. C. Balazs, Phys. Rev. E: Stat., Nonlinear, Soft Matter Phys., 2008, 78, 041406 CrossRef.
- V. V. Yashin, O. Kuksenok, P. Dayal and A. C. Balazs, Rep. Prog. Phys., 2012, 75, 066601 CrossRef PubMed.
- B. Barriere and L. Leibler, J. Polym. Sci., Part B: Polym. Phys., 2003, 41, 166–182 CrossRef CAS.
- I. C. Chen, O. Kuksenok, V. V. Yashin, R. M. Moslin, A. C. Balazs and K. J. Van Vliet, Soft Matter, 2011, 7, 3141–3146 RSC.
- O. Kuksenok, V. V. Yashin, M. Kinoshita, T. Sakai, R. Yoshida and A. C. Balazs, J. Mater. Chem., 2011, 21, 8360–8371 RSC.
- P. Yuan, O. Kuksenok, D. E. Gross, A. C. Balazs, J. S. Moore and R. G. Nuzzo, Soft Matter, 2013, 9, 1231–1243 RSC.
- I. C. Chen, O. Kuksenok, V. V. Yashin, A. C. Balazs and K. J. Van Vliet, Adv. Funct. Mater., 2012, 22, 2535–2541 CrossRef CAS.
- V. V. Yashin, S. Suzuki, R. Yoshida and A. C. Balazs, J. Mater. Chem., 2012, 22, 13625–13636 RSC.
- O. Kuksenok, P. Dayal, A. Bhattacharya, V. V. Yashin, D. Deb, I. C. Chen, K. J. Van Vliet and A. C. Balazs, Chem. Soc. Rev., 2013, 42, 7257–7277 RSC.
- P. Dayal, O. Kuksenok and A. C. Balazs, Langmuir, 2009, 25, 4298–4301 CrossRef CAS PubMed.
- P. Dayal, O. Kuksenok and A. C. Balazs, Soft Matter, 2010, 6, 768–773 RSC.
- X. Lu, L. Ren, Q. Gao, Y. Zhao, S. Wang, J. Yang and I. R. Epstein, Chem. Commun., 2013, 49, 7690–7692 RSC.
- P. Dayal, O. Kuksenok, A. Bhattacharya and A. C. Balazs, J. Mater. Chem., 2012, 22, 241–250 RSC.
- O. Steinbock, P. Kettunen and K. Showalter, Science, 1995, 269, 1857–1860 CAS.
- P. Dayal, O. Kuksenok and A. C. Balazs, Proc. Natl. Acad. Sci. U. S. A., 2013, 110(2), 431–436 CrossRef CAS PubMed.
- A. S. Mikhailov and A. Engel, Phys. Lett. A, 1986, 117, 257–260 CrossRef.
- O. U. Kheowan, E. Mihaliuk, B. Blasius, I. Sendina-Nadal and K. Showalter, Phys. Rev. Lett., 2007, 98, 074101 CrossRef.
- We calculated the average value of u around each gel within a frame that oscillates and moves with the gel; the faces of this frame were at a distance of 14 units from the gel center.
- In a similar manner, adding a high value of u to the top wall of the box in the scenario described in Fig. 4 (panel P1) also effectively resulted in breaking the symmetry in this system by somewhat speeding up the motion of the gels towards the center and leading to differences in the values of u around the gels.
Footnotes |
| † Electronic supplementary information (ESI) available. See DOI: 10.1039/c3mh00083d |
| ‡ Present address: Department of Chemical Engineering, Indian Institute of Technology, Gandhinagar 382424, India. |
| This journal is © The Royal Society of Chemistry 2014 |

