Physiological effects of nanoparticulate ZnO in green peas (Pisum sativum L.) cultivated in soil
Arnab
Mukherjee
ab,
Jose R.
Peralta-Videa
abc,
Susmita
Bandyopadhyay
ab,
Cyren M.
Rico
bc,
Lijuan
Zhao
bc and
Jorge L.
Gardea-Torresdey
*abc
aEnvironmental Science and Engineering PhD program, The University of Texas at El Paso, 500 West University Ave., El Paso, TX 79968, USA. E-mail: jgardea@utep.edu; Fax: +1 915-747-5748; Tel: +1 915-737-5359
bUniversity of California Center for Environmental Implications of Nanotechnology (UC CEIN), The University of Texas at El Paso, 500 West University Ave., El Paso, TX 79968, USA
cDepartment of Chemistry, The University of Texas at El Paso, 500 West University Ave., El Paso, TX 79968, USA
First published on 18th October 2013
Abstract
The toxicological effects of zinc oxide nanoparticles (ZnO NPs) in plants are still largely unknown. In the present study, green pea (Pisum sativum L.) plants were treated with 0, 125, 250, and 500 mg kg−1 of either ZnO NPs or bulk ZnO in organic matter enriched soil. Corresponding toxicological effects were measured on the basis of plant growth, chlorophyll production, Zn bioaccumulation, H2O2 generation, stress enzyme activity, and lipid peroxidation using different cellular, molecular, and biochemical approaches. Compared to control, all ZnO NP concentrations significantly increased (p ≤ 0.05) root elongation but no effects were observed in the stem. Whereas all bulk ZnO treatments significantly increased both root and stem length. After 25 days, chlorophyll in leaves decreased, compared to control, by ∼61%, 67%, and 77% in plants treated with 125, 250, and 500 mg kg−1 ZnO NPs, respectively. Similar results were found in bulk ZnO treated plants. At all ZnO NP concentrations CAT was significantly reduced in leaves (p ≤ 0.05), while APOX was reduced in both roots and leaves. In the case of bulk ZnO, APOX activity was down-regulated in the root and leaf and CAT was unaffected. At 500 mg kg−1 treatment, the H2O2 in leaves increased by 61% with a twofold lipid peroxidation, which would be a predictive biomarker of nanotoxicity. This study could be pioneering in evaluating the phytotoxicity of ZnO NPs to green peas and can serve as a good indicator for measuring the effects on ZnO NPs in plants grown in organic matter enriched soil.
Introduction
According to “The Nanotechnology Consumers Products Inventory”, ZnO NPs are one of the most widely used nanomaterials.1 They are extensively used in personal care products, paints, and as anti-microbial agent, among others.2–4 However, recent literature suggests that NPs produce adverse effects in terrestrial plants. For instance, Lin and Xing reported that ZnO caused phytotoxicity in ryegrass (Lolium perenne), radish (Raphanus sativus) and rape (Brassica napus),4 displayed as a reduction in root elongation. These researchers concluded that the phytotoxicity of ZnO NPs to ryegrass seedlings was caused by disruption in water and nutrient pathways.5 Other negative effects include the reduction of biomass production in wheat (Triticum aestivum), reduction in germination and root elongation in some desert plants,6 and changes in the activities of various soil enzymes such as catalase, protease, and peroxidase.7 Kim et al. reported that ZnO NPs induced excess Zn bioaccumulation in Cucumis sativus grown in soil treated with ZnO NPs,8 and López-Moreno et al. reported that ZnO NPs are genotoxic to soybean (Glycine max).9The risk of soil contamination with ZnO NPs increases with the increased use of these NPs in goods and consumer products. Reports indicate that biosolids from wastewater treatment plants in the United States end in agricultural fields and could be contaminated with metal oxide NPs.10 These NPs can produce toxicity in plants, whose mechanisms and consequences are not well understood yet. In the case of ZnO NPs, it seems that the toxicity is due to the release of ionic Zn7,8 and/or by NPs induced oxidative stress.11–13 In wheat, the phytotoxicity of ZnO NPs was associated with oxidative stress.13 On the other hand, Zhao et al. reported that ZnO NPs produced toxicity in the corn (Zea mays) Golden variety, by affecting chlorophyll production when the soil was amended with alginate, a natural organic matter.14 Concerning the mechanism of toxicity, the most recent literature indicates an increased level of intracellular reactive oxygen species (ROS) production.11–13 ROS molecules can accumulate and cause membrane damage which might lead to apoptotic cell death.15
Plants overcome the damage from ROS molecules by increasing the activity of stress enzymes like catalase (CAT) and ascorbate peroxidase (APOX), among others. However, to the best of authors' knowledge, only two reports have described the effects of ZnO NPs in plants.14,16 But, the effect of ZnO NPs on green pea (Pisum sativum L.) has not been documented in terms of ROS generation and corresponding up- and down-regulation of antioxidant enzymes. Green peas are one of the widely used legumes in healthy diets because of the high protein content, presence of essential amino acids (lysine and leucine), vitamins and minerals like potassium, phosphorus, calcium, copper, iron, and Zn.17,18 As this legume is cultivated in a wide range of soils, it could be grown in soils amended with biosolids contaminated with metal oxide NPs. Therefore, there is an urgent need to understand the toxicity of ZnO NPs in important food crops like green peas.
This study was aimed at determining the impact of ZnO NPs on seed germination, plant growth, chlorophyll production, Zn accumulation, and metabolic processes in green peas grown in soil treated with ZnO NPs. The production of ROS, measured in terms of H2O2, the lipid peroxidation (LPOX) and the activity of antioxidant enzymes (CAT and APOX) were quantified. In addition, the accumulation of Zn in plant tissues was determined by using Inductively Coupled Plasma-Optical Emission Spectroscopy (ICP-OES). Bulk ZnO treatments were set to study the growth and physiological changes produced in green pea plants grown in soil impacted with ZnO NPs.
Results and discussion
Size and ζ-potential of the ZnO NPs
Variations in size, pH, and ζ-potential of the ZnO NPs at the concentrations used are shown in Table 1. As can be seen in this table, the size of the NPs increased in suspension (DI water) compared to its dry, solid state. As the concentration of NPs increased, the hydrodynamic diameter decreased; however, the differences were not statistically significant.19 As a result of that, larger nanoparticles formed, which gravitated out of the solution, leaving behind comparatively smaller NP-assemblies. However, no statistically significant changes in ζ-potential and pH were observed.| ZnO NPs (10 nm in DI water) | Size (nm) | Zeta potential (mV) | pH |
|---|---|---|---|
| 125 mg L−1 | 385.2 (±1.61) | 14.5 (±0.8) | 7.92 (±0.006) |
| 250 mg L−1 | 326.5 (±7.00) | 17.8 (±0.3) | 7.95 (±0.006) |
| 500 mg L−1 | 292.9 (±2.70) | 18.5 (±0.5) | 7.98 (±0.005) |
Accumulation of Zn in green pea tissues
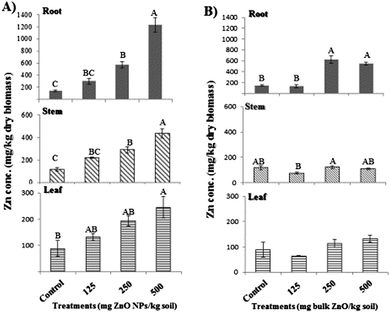
Zinc concentrations in dry pea plant tissues are shown in Fig. 1. As seen in Fig. 1A, plants treated with 250 and 500 mg kg−1 ZnO NPs had nearly 2× and 4× more Zn in roots compared to 125 mg kg−1 treatment, respectively. Fig. 1B shows that the Zn concentration in roots, from the 250 mg L−1 bulk ZnO treatment, was similar to the concentration found with 250 mg L−1 NP treatment. However, the Zn found in roots, from NP at 500 mg L−1, was ∼2× compared to Zn in roots of plants treated with bulk ZnO at 500 mg L−1. A previous study has shown about six and three times increase in Zn uptake by corn roots and shoots, respectively, in plants grown with 800 mg kg−1 ZnO NP, compared to plants treated with 100 mg kg−1.20In stems, green pea plants treated with ZnO NPs at 500 mg kg−1 accumulated significantly more Zn compared to plants treated with 250 and 125 mg kg−1 (Fig. 1A). However, at all bulk ZnO concentrations, stems of pea plants had Zn concentrations similar to those of control stems (Fig. 1B). At leaf level, the Zn accumulation at the highest ZnO NP concentration was different only compared to the control. The translocation rates (defined as the ratio of the Zn concentration in shoots to that in roots) for control, 250 mg kg−1, and 500 mg kg−1 ZnO NP treatments were 0.83, 0.51, and 0.35, respectively. On the other hand, stems and leaves of plants treated with bulk ZnO had similar Zn concentrations as control plants (Fig. 1B). The higher uptake and translocation in ZnO NP treated plants could be due to the smaller particle size. Hao et al.21 reported that bulk ZnO has a particle size of 2000 nm (2920 nm hydrodynamic size), while the ZnO NPs used in our study have a primary size of 10 nm and hydrodynamic sizes of ∼385, ∼327, and ∼293 nm for the 125, 250 and 500 mg kg−1 treatments, respectively. A previous study showed that the ZnO NPs were taken up by corn roots with a very low translocation to the shoots.20 In addition, at high concentration, the ZnO NPs could be adsorbed to the root surface avoiding the uptake and translocation because there were no changes in the particle and ζ-potential in the NP suspensions.
Effects of ZnO NPs on plant growth
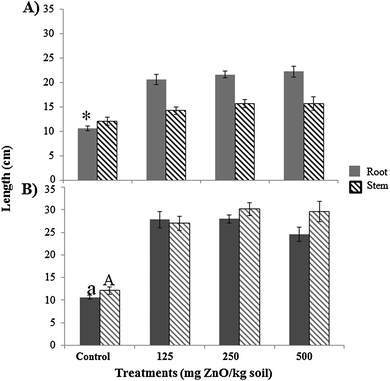
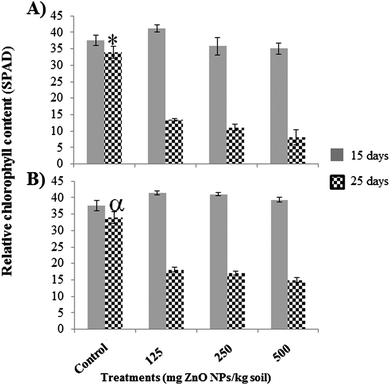
The root and stem length of green pea plants grown for 25 days in soil treated with 0–500 mg kg−1 of ZnO NPs are shown in Fig. 2. As can be seen in Fig. 2, all ZnO NP/bulk ZnO treatments significantly increased root elongation (p ≤ 0.05). Root lengths in all treatments were approximately 2× longer than that of control. On the other hand, compared to control, the stem lengths were increased by approximately 18%, 30%, and 29%, respectively for 125, 250, and 500 mg kg−1 ZnO NPs (Fig. 2A). However, the differences were not statistically significant. It is interesting to point out that plants treated with ZnO NPs had significantly larger roots compared to stems. In bulk ZnO treated pants, there were no differences between root and stem lengths (Fig. 2B). It is possible that the Zn concentration in stems and leaves of ZnO NP treated plants reached toxic levels that reduced stem lengths. Reports indicate that more than 200 mg kg−1 of Zn are toxic to Lolium perenne L. cv Apollo leaves.22 These results indicate that at all concentrations tested ZnO NPs promoted the root growth of green pea plants cultivated in organic matter enriched soil. Priester et al.23 reported that ZnO NPs at 500 mg kg−1 increased the root biomass in soybean. However, more experiments are needed to determine the effects of lower ZnO NP concentrations on green pea plant growth. The study of the effects of ZnO NPs in nodulation of green pea plants deserves special attention, as this is a key factor in legume plant growth.As can be seen in Fig. 3A, the relative chlorophyll content was not impacted by ZnO NPs after 15 days. However, after 25 days, the leaves of ZnO NP treated plants looked less green and the SPAD measurements showed a decrease in chlorophyll of ∼61%, 67%, and 77% at 125, 250, and 500 mg kg−1 ZnO NPs treatments, respectively. Similar results were found in plants treated with bulk ZnO (Fig. 3B). This means that Zn started to produce toxicity when the plants were at middle age. It has been reported that the substitution of the central atom of chlorophyll by Zn damaged the mechanism in stressed plants.24 As stated by Küpper et al.,24 “This substitution prevents photosynthetic light-harvesting in the affected chlorophyll molecules, resulting in a breakdown of photosynthesis.” As can be seen in Fig. 1A, the Zn concentration in leaves varied from ∼150 to 200 mg kg−1 dry weight biomass and there was an increasing trend with increased NP concentration. In bulk ZnO treated plants, the Zn concentration in leaves varied from 50 to ∼150 (Fig. 1B). It is possible that at all the treatments, the Zn concentration in pea leaves had approached the threshold toxicity limit and impacted the chlorophyll synthesis after 25 days.
H2O2 generation induced by ZnO NPs
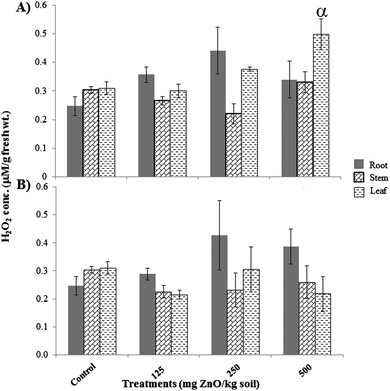
Previous reports have shown that most abiotic and biotic stress results in an increased production of ROS.15,25 Inside the cells, there are different types of ROS molecules. In the present study, the ZnO NP concentrations used did not induce overproduction of H2O2 in green pea roots and stems (Fig. 4A). However, in leaves, the 500 mg kg−1 treatment induced overproduction of H2O2 (61% higher compared to control leaves), which is an indication of oxidative stress. None of the bulk ZnO treatments increased the H2O2 concentration (Fig. 4B). Perhaps this was due to the lower concentration of Zn found in bulk ZnO treated plants (Fig. 1B). Previous studies reported that zinc induced the production of free radicals in various plants.26–28H2O2-scavenging enzyme activities
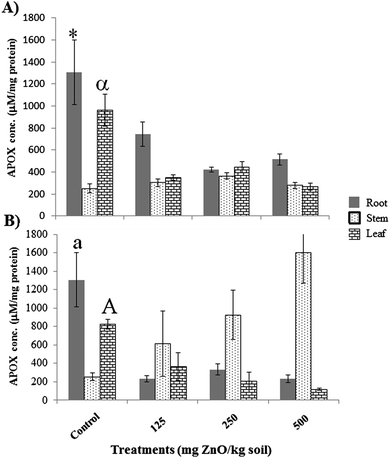
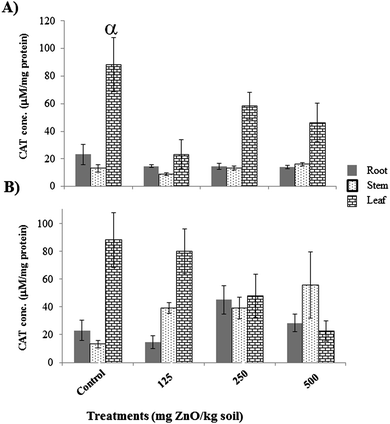
The control of oxidant levels is achieved by antioxidative systems. Enzymatic scavengers of activated oxygen, e.g., APOX and CAT are important components of the defense system in plants.29 CAT and APOX enzymes are known to be involved in the detoxification of H2O2 by converting the H2O2 to water and oxygen.15 We determined the concentration of both CAT and APOX in different tissues at 25 days. As shown in Fig. 5A, none of the ZnO NP treatments affected the concentration of APOX in stems; however, all the ZnO NP treatments reduced the concentration of APOX in roots (about 2× less), although overproduction of H2O2 was not observed in roots. In leaves, though overproduction of H2O2 was observed at the 500 mg kg−1 treatment, the concentration of APOX enzyme was significantly reduced (p ≤ 0.05). Similar results were found in roots and leaves of bulk ZnO treated plants. In stems, there was a concentration-dependent increase of APOX; however, the differences were not statistically significant (Fig. 5B). CAT activity was also not significantly changed in response to the high level of H2O2 in the root and stem. However, in leaves, all ZnO NP concentrations reduced CAT activity (Fig. 6A). A similar trend was observed in bulk ZnO treated plants but, in this case, the differences were not statistically significant (Fig. 6B).The inhibition of antioxidative enzymes induced by ZnO NPs resulted in the H2O2 accumulation (statistically significant at 500 mg kg−1 treatment, Fig. 4A). This confronts the defensive system of the plant. Zhao et al. reported a decrease in APOX and CAT activity in corn plants grown in organic soil treated with 400 mg kg−1 of ZnO NPs.14 However, Hernandez-Viezcas et al. reported that in roots of velvet mesquite (Prosopis juliflora-velutina) grown in soil treated with ZnO NPs at 4000 mg kg−1, there was an increase in CAT activity and a decrease in APOX. However, at 500 mg kg−1 only APOX showed an increase in mesquite stems.30 It is important to point out that H2O2 is just one of the ROS molecules. There are other important ROS molecules in the cells (e.g., superoxide radicals, peroxide radicals, hydroxyl radicals, and singlet oxygen, among others) that could explain the relative discrepancies between the H2O2 concentration and the H2O2 scavenging enzyme activities.31Lipid peroxidation
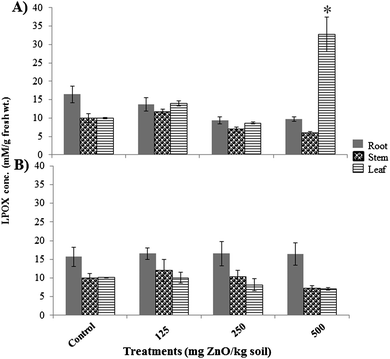
Imbalances in the accumulation and removal of H2O2 and other ROS molecules result in oxidative stress characterized by oxidative damage to proteins, lipids, and DNA.32 To test if H2O2 accumulation causes membrane damage and lipid peroxidation in green pea plants, roots, shoots, and leaves were analyzed. TBARS, a byproduct generated from lipid peroxidation (LPOX), was measured. As shown in Fig. 7A, the concentration of TBARS in the leaves of a 500 mg kg−1 ZnO NP treated plant was significantly higher than that of control, which concurs with overproduction of H2O2 generation in leaves at that NP concentration. Overproduction of H2O2 and other ROS molecules such as superoxide radicals, peroxide radicals, hydroxyl radicals, and singlet oxygen, and the inhibition of antioxidant enzyme activity lead to membrane damage caused by ZnO NP treatments. However, none of the bulk ZnO treated plants showed lipid peroxidation (Fig. 7B), which signifies the less toxic effect of bulk ZnO than the ZnO NPs.Experimental
Characteristics of ZnO NPs and experimental soil
The ZnO NPs (10 nm commercial spheroid, Meliorum Technologies, New York) were obtained from the University of California Center for Environmental Implications of Nanotechnology (UC CEIN). The ZnO NPs were dispersed in DI water by ultra-sonication. Hydrodynamic diameters and ζ-potential of the ZnO NPs at various concentrations (125, 250, and 500 ppm) were measured using a Malvern Zetasizer (Nano-ZS 90, Malvern). Bulk ZnO (Sigma-Aldrich) was used at the same concentrations for comparison purposes. The bulk ZnO was previously characterized.21The original soil was collected from Horizon, TX (31°51′59.06′′N; top 20 cm), air-dried and sieved through a 2 mm mesh prior to experimental use. The soil type was classified as sandy loam soil (percentages of clay, silt, and sand of 3.73%, 12.15%, and 84.1%, respectively).14 Due to the low organic matter content of the Horizon soil, the experiments were performed in a 1![[thin space (1/6-em)]](https://www.rsc.org/images/entities/char_2009.gif) :
:![[thin space (1/6-em)]](https://www.rsc.org/images/entities/char_2009.gif) 1 mixture of the native soil with high organic matter soil (Scotts, premium potting soil). The potting soil was purchased from a nursery store to maintain the appropriate pore size and augment soil fertility. After mixing, the soil properties were: pH 8.45 ± 0.3, CEC 8.02, and Zn concentration 38.08 mg kg−1.
1 mixture of the native soil with high organic matter soil (Scotts, premium potting soil). The potting soil was purchased from a nursery store to maintain the appropriate pore size and augment soil fertility. After mixing, the soil properties were: pH 8.45 ± 0.3, CEC 8.02, and Zn concentration 38.08 mg kg−1.
Soil preparation (mixing nano and bulk ZnO with soil)
Suspensions of bare ZnO NPs were prepared at 0 (control), 125, 250, and 500 mg ZnO NPs kg−1 of soil by dispersing desired amounts of NPs in Millipore water (MPW) and sonicated for 30 min to avoid aggregation (Crest Ultrasonics, Trenton, NJ. Model 275DA; 120 volt, 3 amp, 50/60 Hz). The pots (20.3 cm × 18.5 cm, Lawn & Garden section; Wal-Mart Inc.) were filled with the soil mixture. Then, the soil was amended with the NP suspensions (well mixed) and kept 24 h for stabilization. Next day, the seeds were planted in the NP amended soil pots. Each treatment, including control (no NPs), was set in four replicates. No additional fertilizer was used. Similar treatments were done in case of bulk ZnO experiments.Seed germination and exposure
Seeds were soaked in a 10% sodium hypochlorite solution for 20 min, rinsed three times with MPW and immersed in MPW for 2 h. After that, seven seeds were sown in each pot. The pots were placed in the growth chamber (Environmental Growth Chamber, Chagrin Falls, OH) with 14 h photoperiod, 25/20 °C day/night temperature, 65% relative humidity, and 340 μmol m−2 s−1 light intensity. After 5 d, the numbers of germinated seeds were counted in each pot and the percentage germination (%G) rates were calculated using the formula described elsewhere.6Zn uptake by green pea plants
To study the Zn uptake from the soil treated with nano and bulk ZnO, green pea seeds were germinated and grown for 25 days in pots filled with the soil mixture (3 kg per pot). The pots were watered for 25 days with deionized water, enough to maintain the soil close to its water holding capacity. After this period of time, plants were harvested for further analysis. Plants were thoroughly washed with tap water for 5 min and rinsed with 2% HNO3 solution, followed by washing with DI water three times.20 For the uptake study, roots, stems, and leaves were separated and dried at 60 °C for 24 h.The dry samples were digested in a microwave acceleration reaction system (CEM MARSx, Mathews, NC) following the USEPA 3051 method using plasma pure HNO3 and H2O2 (1![[thin space (1/6-em)]](https://www.rsc.org/images/entities/char_2009.gif) :
:![[thin space (1/6-em)]](https://www.rsc.org/images/entities/char_2009.gif) 4)33 and analyzed for Zn concentration using ICP-OES (Optima 4300 DV, Perkin-Elmer, Shelton, CT). Blank, spiked samples, and 1570a, a standard reference material (spinach leaves) were used to validate the analytical procedure of Zn measurements. Ten blank samples were analyzed to calculate the detection limit of Zn.
4)33 and analyzed for Zn concentration using ICP-OES (Optima 4300 DV, Perkin-Elmer, Shelton, CT). Blank, spiked samples, and 1570a, a standard reference material (spinach leaves) were used to validate the analytical procedure of Zn measurements. Ten blank samples were analyzed to calculate the detection limit of Zn.
Chlorophyll estimation (SPAD measurements)
Leaf greenness (or relative chlorophyll content) of all plants was measured using a hand-held SPAD chlorophyll meter (Minolta Camera Co., Osaka, Japan) after 15 and 25 days of growth.Biochemical assays
![[thin space (1/6-em)]](https://www.rsc.org/images/entities/char_2009.gif) 000 × g for 20 min. A 1 mL aliquot of the supernatant was added with 1 mL of TCA (20%) containing 0.5% (w/v) thiobarbituric acid (TBA) and 100 μL butylated hydroxyltoluene (BHT, 4% in ethanol). The mixture was heated at 95 °C for 30 min, then quickly cooled on ice and centrifuged at 10
000 × g for 20 min. A 1 mL aliquot of the supernatant was added with 1 mL of TCA (20%) containing 0.5% (w/v) thiobarbituric acid (TBA) and 100 μL butylated hydroxyltoluene (BHT, 4% in ethanol). The mixture was heated at 95 °C for 30 min, then quickly cooled on ice and centrifuged at 10![[thin space (1/6-em)]](https://www.rsc.org/images/entities/char_2009.gif) 000 × g for 15 min. The absorbance was measured at 532 nm. The unspecific turbidity of the sample was measured at 600 nm and subtracted from the absorbance at 532 nm.
000 × g for 15 min. The absorbance was measured at 532 nm. The unspecific turbidity of the sample was measured at 600 nm and subtracted from the absorbance at 532 nm.
![[thin space (1/6-em)]](https://www.rsc.org/images/entities/char_2009.gif) 000 × g for 25 min at 4 °C. The supernatant was collected and stored at −80 °C.
000 × g for 25 min at 4 °C. The supernatant was collected and stored at −80 °C.
All enzyme activity assays were done at 25 °C using 1 mL volume of the reaction mixture. Protein content was determined according to the method of Bradford37 using bovine serum albumin as standard. The enzyme kinetics for the assays was recorded in a Perkin Elmer Lambda 14 UV/Vis spectrometer (single-beam mode, Perkin-Elmer, Uberlinger, Germany). The catalase (CAT) activity was assayed by monitoring the degradation of H2O2 (extinction coefficient 39.4 mM−1 cm−1) at 240 nm.38 The reaction mixture contained 980 μL of 10 mM H2O2 and 20 μL of crude enzyme extract. One unit of CAT is defined as the amount of enzyme necessary to decompose 1 μmol of H2O2 per minute. The ascorbate peroxidase (APOX) activity was measured following the method of Nakano and Asada39 by monitoring the decrease in the AsA (2.8 mM−1 cm−1) content at 290 nm for 2 min. The reaction mixture consisted of 936 μL of 50 mM phosphate buffer (pH 7.4), 4 μL of 25 mM ascorbate (AsA), 10 μL of 17 mM H2O2 and 50 μL of enzyme extract. One unit of APOX activity is defined as 1 μmol of AsA oxidized per minute.
Statistical analysis
All the treatments were done in four replicates and arranged in a completely random design. Zn concentration in roots, stems, and leaves were reported as averages of four replicates ± standard errors. A one-way ANOVA test was performed followed by Tukey-HSD test using the statistical package SPSS Version 19.0 (SPSS, Chicago, IL). Statistical significance was based on probabilities of p ≤ 0.05.Conclusion
This study has demonstrated that when grown in organic matter enriched soil treated with ZnO NPs, green pea plants accumulate Zn in roots in a concentration-dependent manner. However, less Zn accumulation was observed in bulk ZnO treated plants. ZnO NPs increased root elongation, whereas, the bulk treatments showed both root and stem elongation. The ICP-OES data showed that this plant is able to translocate the Zn to the above-ground plant parts, in the case of NP treatments, but the translocation was insignificant in the case of bulk treatments. The high Zn accumulation, mainly in leaves, induces significant accumulation of H2O2, with a reduction in the activity of the stress enzymes CAT and APOX. But, the bulk treatments showed no effect in H2O2 and lipid peroxidation. After 25 days, there was a significant reduction in chlorophyll content and increased lipid peroxidation in plants treated with 500 mg kg−1 of the ZnO NPs. Our results indicate that ZnO NPs induced more toxicity/stress compared to bulk ZnO for green pea plants. Therefore, these results will help us to further understand the phytotoxicity of ZnO NPs and possible ecotoxicological impacts on the food chain. Future studies must be performed in order to determine the effects of ZnO NPs on the seed quality of pea plants.Acknowledgements
This material is based upon work supported by the National Science Foundation and the Environmental Protection Agency under Cooperative Agreement Number DBI-0830117. Any opinions, findings, and conclusions or recommendations expressed in this material are those of the author(s) and do not necessarily reflect the views of the National Science Foundation or the Environmental Protection Agency. This work has not been subjected to EPA review and no official endorsement should be inferred. The authors also acknowledge USDA grant number 2011-38422-30835, and NSF Grant # CHE-0840525. J. L. Gardea-Torresdey acknowledges the Dudley family for the Endowed Research Professorship, the Academy of Applied Science/US Army Research Office, Research and Engineering Apprenticeship program (REAP) at UTEP, grant # W11NF-10-2-0076, sub-grant 13-7, and STARs programs of the University of Texas System. The authors also acknowledge Ms Sanghamitra Majumdar for her contribution in figure preparation.References
- A. Maynard and E. Michaelson, The Nanotechnology Consumers products Inventory, Woodrow Wilson International Center for Scholars, 2006. Available at: http://www.nanotechproject.org/process/files/2753/consumer_product_inventory_analysis_handout.pdf (accessed on 20th Feb. 2013).
- S. Choopun, A. Tubtimtae, T. Santhaveesuk, S. Nilphai, E. Wongrat and N. Hongsith, Appl. Surf. Sci., 2009, 256, 998 CrossRef CAS.
- T. Szabo, J. Nemeth and I. Dekany, Colloids Surf., A, 2003, 230, 23 CrossRef CAS.
- D. Lin and B. Xing, Environ. Pollut., 2007, 150, 243 CrossRef CAS PubMed.
- D. Lin and B. Xing, Environ. Sci. Technol., 2008, 42, 5580 CrossRef CAS PubMed.
- G. de la Rosa, M. L. López-Moreno, J. Hernández-Viescaz, J. R. Peralta-Videa and J. L. Gardea-Torresdey, Int. J. Nanotechnol., 2011, 8(6/7), 492 CrossRef CAS.
- W. Du, Y. Sun, R. Ji, J. Zhu, J. Wu and H. Guo, J. Environ. Monit., 2011, 13, 822 RSC.
- S. Kim, J. Kim and I. Lee, J. Chem. Ecol., 2011, 27, 49 CrossRef CAS.
- M. L. López-Moreno, G. de la Rosa, J. Á. Hernández-Viezcas, H. Castillo-Michel, C. E. Botez, J. R. Peralta-Videa and J. L. Gardea-Torresdey, Environ. Sci. Technol., 2010, 44(19), 7315 CrossRef PubMed.
- Nanotechnology-Workgroup, Nanotechnology White Paper; United States Environmental Protection Agency, Science Policy Council, Washington, DC, 2007.
- A. Nel, T. Xia, L. Moedler and N. Li, Science, 2006, 311, 622 CrossRef CAS PubMed.
- T. Xia, M. Kovochich, J. Brant, M. Hotze, J. Sempf, T. Oberley, C. Sioutas, J. I. Yeh, M. R. Wiesner and A. E. Nel, Nano Lett., 2006, 6, 1794 CrossRef CAS PubMed.
- C. O. Dimkpa, J. E. McLean, D. W. Britt and A. J. Anderson, Ind. Biotechnol., 2012, 8, 344 CrossRef CAS.
- L. Zhao, J. A. Hernandez-Viezcas, J. R. Peralta-Videa, S. Bandyopadhyay, B. Peng, B. Munoz, A. A. Keller and J. L. Gardea-Torresdey, Environ. Sci.: Processes & Impacts, 2013, 15(1), 260 CAS.
- C. Shen, Q. Zhang, J. Li, F. Bi and N. Yao, Am. J. Bot., 2010, 97, 1602 CrossRef CAS PubMed.
- J. A. Hernandez-Viezcas, H. Castillo-Michel, J. C. Andrews, M. Cotte, C. M. Rico, J. R. Peralta-Videa, J. H. Priester, P. A. Holden and J. L. Gardea-Torresdey, ACS Nano, 2013, 7(2), 1415–1423 CrossRef CAS PubMed.
- A. Iqbal, I. A. Khalil, N. Ateeq and M. S. Khan, Food Chem., 2006, 97, 331–335 CrossRef CAS.
- S. S. Deshpande, Crit. Rev. Food Sci. Nutr., 1992, 32, 333 CrossRef CAS PubMed.
- S. Bandyopadhyay, J. R. Peralta-Videa, G. Plascencia-Villa, M. José-Yacamán and J. L. Gardea-Torresdey, J. Hazard. Mater., 2012, 30, 379 CrossRef PubMed.
- L. Zhao, J. R. Peralta-Videa, R. Ren, A. Varela-Ramirez, C. Li, J. A. Hernandez-Viezcas, R. J. Aguilera and J. L. Gardea-Torresdey, Chem. Eng. J., 2012, 184, 1 CrossRef CAS.
- L. Hao, L. Chen, J. Hao and N. Zhong, Ecotoxical. Environ. Saf., 2013, 91, 52 CrossRef CAS PubMed.
- M. Bonnet, O. Camares and P. Veisseire, J. Exp. Bot., 2000, 51, 945 CrossRef CAS PubMed.
- J. H. Priester, Y. Ge, R. E. Mielke, A. M. Horst, S. Cole Moritz, K. Espinosa, J. Gelb, S. L. Walker, R. M. Nisbet, Y.-J. An, J. P. Schimel, R. G. Palmer, J. A. Hernandez-Viezcas, L. Zhao, J. L. Gardea-Torresdey and P. A. Holden, Proc. Natl. Acad. Sci. U. S. A., 2012, 109, E2451 CrossRef CAS PubMed.
- H. Küpper, F. Küpper and M. Spiller, J. Exp. Bot., 1996, 47(295), 259 CrossRef.
- A. Schutzendubel and A. Polle, J. Exp. Bot., 2002, 53(372), 1351 CrossRef CAS PubMed.
- G. R. Rout and P. Das, Agronomie, 2003, 23, 3 CrossRef.
- R. Jain, S. Srivastava, S. Solomon, A. K. Shrivastava and A. Chandra, Acta Physiol. Plant., 2010, 32, 979 CrossRef CAS.
- Z. Hosseini and L. Poorakbar, J. Stress Physiol. Biochem., 2013, 9, 66 Search PubMed.
- G. Noctor and C. H. Foyer, Annu. Rev. Plant Physiol. Plant Mol. Biol., 1998, 49, 249 CrossRef CAS PubMed.
- J. A. Hernandez-Viezcas, H. Castillo-Michel, A. D. Servin, J. R. Peralta-Videa and J. L. Gardea-Torresdey, Chem. Eng. J., 2011, 170(2), 346–352 CrossRef CAS PubMed.
- A. Mhamdi, G. Queval, S. Chaouch, S. Vanderauwera, F. Van Breusegem and G. Noctor, J. Exp. Bot., 2010, 61(15), 4197 CrossRef CAS PubMed.
- B. Halliwell and J. M. C. Gutteridge, Free Radicals in Biology and Medicine, Oxford University Press, London, 4th edn, 2007 Search PubMed.
- P. Packer, D. Lariviere, C. Li, M. Chen, A. Fawcett, K. Nielsen, K. Mattson, A. Chatt, C. Scriver and L. S. Erhardt, Anal. Chim. Acta, 2007, 588, 166 CrossRef PubMed.
- C. Gay and J. M. Gebicki, Anal. Biochem., 2000, 284, 217–220 CrossRef CAS PubMed.
- R. L. Heath and L. Packer, Arch. Biochem. Biophys., 1968, 125, 189 CrossRef CAS PubMed.
- D. H. Lee and C. B. Lee, Plant Sci., 2000, 159, 75 CrossRef CAS PubMed.
- M. M. Bradford, Anal. Biochem., 1976, 72, 248 CrossRef CAS PubMed.
- H. Aebi, Catalases, in Methods of enzymatic analysis, ed. H. U. Bergmeyer, Academic Press, NY and London, 1974, pp. 673–677 Search PubMed.
- Y. Nakano and K. Asada, Plant Cell Physiol., 1981, 22, 867 CAS.
| This journal is © The Royal Society of Chemistry 2014 |

