 Open Access Article
Electrophoretic deposition as a new approach to produce optical sensing films adaptable to microdevices†
Marta
Marín-Suárez
*a,
Santiago
Medina-Rodríguez
ab,
Olgaç
Ergeneman
*c,
Salvador
Pané
c,
Jorge F.
Fernández-Sánchez
a,
Bradley J.
Nelson
c and
Alberto
Fernández-Gutiérrez
a
aDepartment of Analytical Chemistry, Faculty of Sciences, University of Granada, Avda. Fuentenueva s/n, E-18071 Granada, Spain. E-mail: mmarinst@ugr.es; Tel: +34 958248593
bDepartment of Signal Theory, Networking and Communications, CITIC-UGR, University of Granada, C/Periodista Rafael Gómez 2, E-18071 Granada, Spain
cInstitute of Robotics and Intelligent Systems, ETH Zurich, Tannenstrasse 3, CH-8092 Zurich, Switzerland. E-mail: oergeneman@ethz.ch
First published on 7th October 2013
Abstract
We report the fabrication of optical oxygen sensor films using electrophoretic deposition (EPD) of poly(styrene-co-maleic anhydride) nanoparticles containing the oxygen-sensitive dye platinum(II) meso-tetra(pentafluorophenyl)porphine. Compared to other deposition methods, the EPD is simple and allows easy control over deposition, which is crucial for the implementation of optical sensing films in microdevices. By optimizing the synthesis of the functional nanoparticles, anodic EPD can be performed. The amount of deposited particles can be tuned by varying either the electrical potential or the deposition time. The sensing phases were characterized using a phase-modulation technique showing a Stern–Volmer constant (kSV1) between 45 and 52 bar−1 for gas and of 20.72 bar−1 in the aqueous phase without leaching of the particles from the surface. The small thickness of the layers lead to short response times (<0.4 s). This is the first time that polymeric optical sensing films have been obtained by EPD from dispersions of oxygen sensing nanoparticles.
1. Introduction
Molecular oxygen influences cell metabolism and viability. The determination of molecular oxygen in vascular systems and tissues is crucial to understand the diagnosis and the evolution of certain diseases. For example, several ocular pathologies such as diabetic retinopathy, glaucoma, age-related macular degeneration and retinal vein occlusions1–4 are connected with insufficient supply of oxygen to the eye (hypoxia).Recent advances in micro- and nanofabrication have enabled the development of miniaturized sensing instruments employed in domains such as medicine and biotechnology. Due to their small sizes, these devices can be operated in vitro and in vivo as monitoring and diagnosis tools.5–7 Among the sensing strategies, optical methods offer certain advantages over others in the biomedical arena such as no analyte consumption, no interference with electromagnetic fields, and wireless signal transduction.8–11 Recently, the use of untethered magnetic microrobots has shown high potential in ophthalmic applications,7,12 including minimally invasive detection of oxygen inside the eye.11,13,14 In order to confer sensing functionalities to the microrobot, methods to integrate sensing blocks are urgently required. The functionalization of three-dimensional structures such as the one presented by Ergeneman et al.11 is challenging. The integration of the sensing material should be uniform in thickness and conformal. The available optical sensing films such as membranes, nanoparticles, paints, and fibers cannot be easily incorporated into microstructures without compromising the uniformity of the layer thickness.
This paper proposes a method based on electrophoretic deposition (EPD) to integrate oxygen-sensitive nanoparticles in arbitrary shapes. This technique enables the integration of films in a conformal manner.15,16 In EPD, charged nanoparticles dispersed in a liquid move towards a conductive substrate of opposite charge on which they are deposited.17 Consequently, deposition can be performed over a wide range of microarchitectures. Moreover, the film thickness can be controlled by simply adjusting the deposition time and the applied potential.
EPD is of considerable interest for a wide range of applications due to its simplicity and low cost, and it has been successfully applied to deposit a variety of materials,15,17,18 including different types of nanoparticles and composites for optical sensors.19–21 In this area, Yarimaga et al. used EPD to create micropatterns of polydiacetylene, which show heat-induced non-fluorescence to fluorescence switching. The authors investigate the in situ polymerization and its suitability to monitor temperature in microheaters.19 Sun et al. have also used EPD to produce films with selective detection of mercury by fluorescence quenching. This film is based on a mercury sensitive fluorophore 1-amino-8-naphthol-3,6-disulfonic acid sodium and layered double hydroxides (LDHs).20 The same authors developed an optical pH sensor based on LDHs and fluorescein.21
On the other hand, we perform EPD from dispersions of polymeric nanoparticles (defined here as solid colloidal particles with a diameter below 300 nm) that act as carriers of oxygen-sensitive dyes, namely, platinum(II) meso-tetra(pentafluorophenyl)porphine (PtTFPP). The excited triplet states of this metalloporphyrin are quenched effectively with dynamic quenchers, such as oxygen, nitrogen oxides, etc.22,23 The permeability of the polymer nanoparticles to molecular oxygen enables a selective interaction of O2 with the luminescent PtTFPP and the quenching can be used to determine the oxygen concentration. The amount of polymer used in the synthesis of the particles was optimized in order to obtain appropriate particle size with a narrow size distribution for EPD. Potentials and deposition times were also investigated. In addition, the optical characterization of the resulting sensing films has been fully investigated using a phase-resolved method. The films showed both good sensitivity to oxygen and shorter response times than currently reported polymeric membranes.
2. Experimental
2.1. Reagents
Poly(styrene-co-maleic anhydride) polymer (PSMA, 7% maleic anhydride, Mw = 224![[thin space (1/6-em)]](https://www.rsc.org/images/entities/char_2009.gif) 000 g mol−1), tetrahydrofuran (THF), acetone, isopropanol, sodium hydroxide (NaOH), and hydrochloric acid (HCl, 37%) were purchased from Sigma Aldrich. Oxygen indicator Pt(II) meso-tetra(pentafluorophenyl)porphine (PtTFPP) was purchased from Frontier Scientific (http://www.frontiersci.com/). Piranha solution consisted of a 3
000 g mol−1), tetrahydrofuran (THF), acetone, isopropanol, sodium hydroxide (NaOH), and hydrochloric acid (HCl, 37%) were purchased from Sigma Aldrich. Oxygen indicator Pt(II) meso-tetra(pentafluorophenyl)porphine (PtTFPP) was purchased from Frontier Scientific (http://www.frontiersci.com/). Piranha solution consisted of a 3![[thin space (1/6-em)]](https://www.rsc.org/images/entities/char_2009.gif) :
:![[thin space (1/6-em)]](https://www.rsc.org/images/entities/char_2009.gif) 1 mixture of concentrated sulfuric acid and 30% hydrogen peroxide (both from Sigma Aldrich).
1 mixture of concentrated sulfuric acid and 30% hydrogen peroxide (both from Sigma Aldrich).
2.2. Preparation and characterization of the nanoparticles
The nanoparticles were prepared following the procedure described elsewhere.24 Briefly, 100 mg of PSMA (0.1% w/v) and 1.5 mg of PtTFPP (1.5% w/w respect to the polymer) were dissolved in 100 mL of THF. 6 mL of the cocktail were subsequently dropped over 10 mL of deionized water under agitation. The mixture was exposed to blown air for at least 20 minutes until THF was evaporated. The resulting polymeric particles with the embedded dye formed stable dispersions. NaOH or HCl was used to adjust the pH of the dispersion of particles.Particle mean diameter (d, in nm), size distribution (PdI), zeta potential (ζ, in mV), and conductivity (C, in mS cm−1) of the particle dispersion were measured with a Zetananosizer (Malvern Instrument, model Zetasizer Nano ZS, http://www.malvern.com), which is equipped with a laser and a dynamic light scattering (DLS) detector.
2.3. Electrophoretic deposition
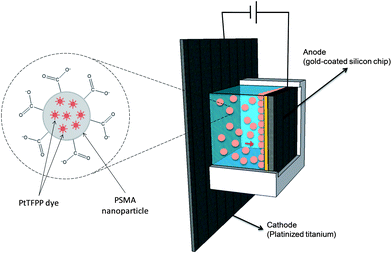
A homemade electrophoretic cell was built by placing an acrylglass compartment (polymethylmethacrylate) on a platinized titanium plate sheet (purchased from http://www.ti-shop.com) that acted as the cathode. The anode consisted of a 1 cm2 silicon chip coated with a 25 nm titanium adhesion layer and a 50 nm gold seed layer both obtained by means of e-beam evaporation. The chips were cleaned using acetone, isopropanol, and piranha, respectively, in order to remove organic contamination. The chips were placed facing the platinized plate keeping a constant distance of 5 mm. A schematic drawing is presented in Fig. 1.The platinum cathode and the gold chip anode were connected to a programmable DC power supply (Promax, model FA-665, http://www.promaxelectronics.com) in order to perform EPD. After the deposition, the chips were rinsed with deionized water and dried with nitrogen to remove all non-attached particles.
2.4. Measurements
Excitation and emission spectra were obtained with a Varian Cary-Eclipse luminescence spectrometer (Varian Inc.-Agilent Technologies, http://www.agilent.com, CA, USA) equipped with a Xe flash lamp (peak power equivalent to 75 kW), Czerny-Turner monochromators, and a red-sensitive photomultiplier tube (PMT) R-928 from Hamamatsu Photonics (http://www.sales.hamamatsu.com, Japan) with a manual or automatic voltage regulator. In addition, a customized version of the optical fiber measurement system previously described25 (see Fig. ESI-1†) was used to characterize the sensitivity to oxygen of the sensing layers. For this purpose, the phase-resolved method described in the ESI† was applied using a commercial dual lock-in amplifier as the phase-sensitive detector. The phase shift (Φ) measurements at different oxygen concentrations were used to calculate the lifetime and characterize the oxygen sensitivity of the materials, while the magnitude or amplitude (R) measurements (proportional to the emission intensity) of the modulated emission signal were employed to extract information about the amount of particles deposited and their adhesion to the gold surface. The selection of the modulation frequency for these measurements is also described in Fig. ESI-2.†For the gas characterization, the sensing phase was placed inside a homemade flow-through cell and different mixtures of nitrogen and oxygen gases (supplied by 50 L gas bottles at 200 bars with nitrogen 60 and oxygen 55, Air Liquide) were passed through the cell. The flow cell was made of black polytetrafluoroethylene to prevent stray reflections and to assure the chemical inertness. Both the flow cell and the PMT were housed in a dark room (Thorlabs GmbH, model XE25C1) to prevent interference from stray light and temperature was monitored during all the experiments. For gas mixing, two mass-flow controllers (MFCs) (Bronkhorst High-Tech, model EL-FLOW Select F-201CV, http://www.bronkhorst.com) were used. After the MFCs, copper and stainless steel tubing was used to connect the MFCs with the flow-through cell. The system was fully controlled from a PC using a self-made program written in Matlab 7.10 (http://www.mathworks.com) and LabView 8.5 (http://www.ni.com).
For the determination of dissolved oxygen, the same cell was filled with water at a constant flow rate of 1 mL min−1 using a peristaltic pump (Gilson Inc., model Minipuls 3, http://www.gilson.com). The dissolved oxygen present in the water was adjusted by blowing different ratios of oxygen and nitrogen with the aforementioned gas setup. A commercial Clark electrode (Eutech Instruments, model CyberScan PCD-650, http://www.eutechinst.com) was used to monitor the oxygen concentration in the aqueous phase.
3. Results and discussion
3.1. Synthesis optimization of the O2 sensing nanoparticles
The oxygen sensing nanoparticles contain the dye PtTFPP, whose luminescence is quenched in the presence of oxygen, immobilized in the PSMA polymer. PtTFPP is one of the most widely used dyes for the preparation of optical oxygen sensing films due to its good photostability,26 long lifetime of emission, wide excitation range, and large Stokes shift, which simplifies the measurement system.25,27 On the other side, polymeric materials have demonstrated good properties in terms of solubility of the dye and permeability to oxygen.8 Here, the role of the maleic anhydride in PSMA is also significant: when it reacts with water, the produced carboxyl groups provide negative charges to the particles' surface.24,28 This charge is responsible not only for the stability of the particle dispersion but also for the attraction of the particles to the anode to perform EPD. In addition, the presence of carboxyl groups may be interesting for further modification of the films, functionalization or covalent binding, e.g. with enzymes or antibodies for the development of biosensing phases.24,28,29Polymeric nanoparticles with an embedded oxygen indicator can be produced by several methods, such as covalent attachment to the polymer, swelling, or physical entrapment of the dye.24,28,30,31 Precipitation–evaporation (or solvent displacement method)24 is an easy way to produce nanoparticles with a good control over their physical properties, and thus, it was selected to produce the oxygen-sensitive particles. This method requires a water-miscible solvent able to dissolve both the dye and the polymer, such as THF. In this way, when the solvent reaches water, nanoparticles are formed due to the hydrophobicity of the polymer and the lipophilic oxygen indicator gets entrapped inside them. In all the experiments the concentration of the dye was kept at 1.5% w/w with respect to the polymer in order not to exceed the solubility of the dye in the polymer, which produces aggregation and self-quenching.32 In addition, the concentration of the polymer (Cp) was also kept at 0.1% w/v in order to ensure a good size distribution of the particles because aggregates appeared for higher PSMA concentrations.
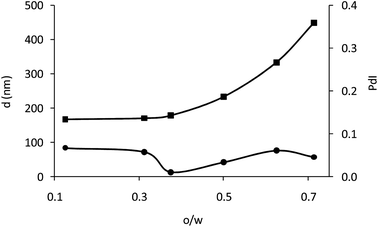
The amount of polymer used in precipitation–evaporation can influence the size and the polydispersity of the obtained particles.24 To evaluate this effect, the volume of the polymer solution (o) was varied, keeping Cp and volume of water (w) constant. Fig. 2a shows the size (d) and size distribution (PdI) obtained for different o/w ratios. When the o/w ratio increased the particles became greater in size. However, the polydispersity of the particles is hardly influenced by the o/w ratio due to the low initial polymer concentration in the discontinuous phase (0.1% w/v) and in all cases the PdI is below 0.1, indicating a good homogeneity for all of them.30 A good homogeneity usually improves the performance of EPD because the particles move approximately at the same speed and a higher ordered packed area is expected than for those particles with a wider size distribution.17 Therefore, as all the obtained particles show good homogeneity, only size was considered to select the o/w ratio. It was set at 0.6 in order to obtain particles with an appropriate amount of oxygen-sensing dye. It provides particles of 280 nm and PdI of 0.06.
3.2. Optimization of the electrophoretic deposition
To perform EPD, the zeta potential and conductivity of the particle dispersion are important factors.17,33 The zeta potential, which is proportional to the electrophoretic mobility, indicates the degree of repulsion between adjacent particles. Therefore, a high zeta potential (ζ in mV), in absolute value, is desirable as it improves the mobility while avoiding the sedimentation of the particles during EPD.17 In all the cases the absolute value of ζ is higher than 30 mV, which is considered inside the range for dispersion stability.34In addition, pH has a strong influence over zeta potential and its adjustment improves the stability of nanoparticles and electrophoretic mobility.17,33Table 1 shows ζ and conductivity (C in mS cm−1) of the dispersion of nanoparticles (o/w = 0.6) when changing the pH. ζ of the dispersion is improved from −33 to −39 mV when a base is added. Since the particles are negatively charged, the addition of acid neutralizes the negative charge, while adding base increases ζ, thus increasing the stability. The negative effect of ionic strength on ζ can be neglected compared to the increase due to pH.
These results can be better understood bearing in mind that the PSMA copolymer has two different classes of carboxyl groups.35,36 Primary carboxyl groups have a pKa1 around 4–5 while secondary ones possess a pKa2 of around 9–10.36–38 At pH 2 both types of carboxylic groups are protonated and the charge is almost neutral, leading to a ζ close to 0. At pH 11 almost all carboxylic groups are deprotonated, resulting in strongly negative charge with a ζ close to −40 mV.
It should be highlighted that the delimitation of deposition time (t) and potential (E) is crucial because when EPD is performed over an aqueous solution, electrolysis of water is a common concern, even at low potential.17 Water electrolysis may cause pH changes in the electrodes as well as gas evolution which may disturb the deposition process. In addition, aqueous EPD produces high current densities that lead to Joule heating and etching of the electrodes.17 For nanoparticles stabilized with a base (ζ = −39.1 mV), the increase of conductivity (C = 16.0 mS cm−1 compared to 0.125 mS cm−1 for the base-free dispersion) leads to the darkening of the polymer when deposition takes place, even at low potentials and deposition times.
For the base-free dispersion (ζ = −33.0 mV, C = 0.125 mS cm−1), a high level of bubble formation within a non-homogeneous deposition was observed, which suggests that a high current transport still exists. To minimize these effects, the base-free dispersion was diluted several times and different potentials and deposition times were screened until suitable working conditions were found for a successful EPD. For a dilution 1![[thin space (1/6-em)]](https://www.rsc.org/images/entities/char_2009.gif) :
:![[thin space (1/6-em)]](https://www.rsc.org/images/entities/char_2009.gif) 4 (with 1 mL of the dispersion of particles and 3 mL of deionized water) successful EPD was reached for an applied potential between 10 and 40 V cm−1 and deposition times between 1 and 10 minutes. Higher potentials or deposition times led to the darkening of the deposit, probably because of Joule heating of the polymer and the electrochemical etching of the deposit.17 In addition, below 10 V cm−1 or deposition times shorter than 1 min, no homogeneous deposition over the whole surface was obtained. Therefore, the influence over the morphology and oxygen sensing properties of the films was studied within these ranges, applying potentials of 10, 20, 30 and 40 V cm−1 and deposition times of 1, 5 and 10 min.
4 (with 1 mL of the dispersion of particles and 3 mL of deionized water) successful EPD was reached for an applied potential between 10 and 40 V cm−1 and deposition times between 1 and 10 minutes. Higher potentials or deposition times led to the darkening of the deposit, probably because of Joule heating of the polymer and the electrochemical etching of the deposit.17 In addition, below 10 V cm−1 or deposition times shorter than 1 min, no homogeneous deposition over the whole surface was obtained. Therefore, the influence over the morphology and oxygen sensing properties of the films was studied within these ranges, applying potentials of 10, 20, 30 and 40 V cm−1 and deposition times of 1, 5 and 10 min.
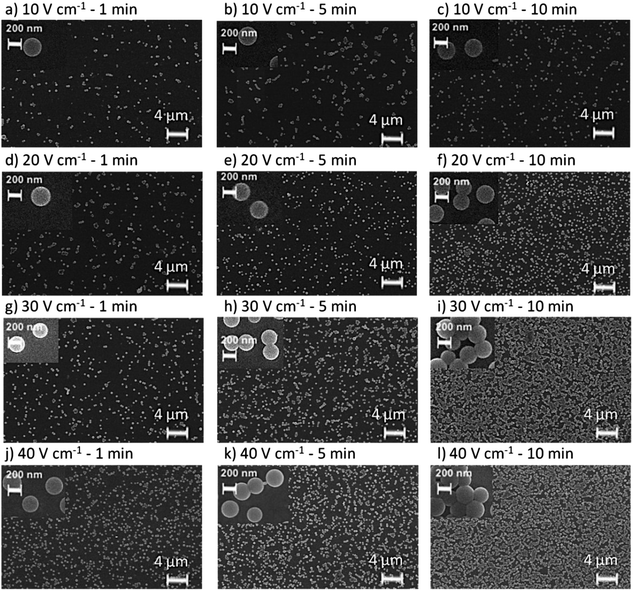
The morphology of the deposits obtained for each of these conditions was investigated using scanning electron microscopy (SEM). Fig. 3 shows the SEM images of the chips undergoing 10, 20, 30, and 40 V cm−1 for the different deposition times. It can be noticed that for the same deposition time, the amount of particles increases with potential. For the chips undergoing 10 V cm−1, the amount of particles is hardly influenced when time is increased compared to the rest of the potentials (see Fig. 3(a)–(c)). However, for the rest of the sensing films (20 V cm−1, 30 V cm−1 and 40 V cm−1) the amount of particles increases for higher deposition times (Fig. 3(d)–(f)). Fig. 3 also confirms that the nanoparticles produced by the precipitation–evaporation method are spherical and their d and PdI are in agreement with the DLS measurements. In addition, it can be observed that the EPD produces a homogeneous distribution of the particles over the surfaces, with a monolayer of particles. The thickness can be therefore considered as the diameter of the nanoparticles, i.e. ≈ 250 nm.
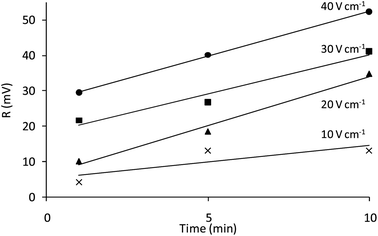
The luminescence emission of the films in the absence of oxygen (given by the magnitude of the modulated emission signal, R) can be related to the amount of luminescent particles deposited. Following the equation proposed by Hamaker39 for electrophoretic cells with planar geometry, a theoretical deposited mass per unit area (m, mg cm−2) was calculated (see Fig. 4, ESI†). ESI† also shows the relationship between R and its theoretical value of deposited mass for each condition of potential and time, confirming their relationship. Thus, R was used as a guide to study the influence of deposition potential and time on the amount of particles deposited by EPD, which is increased when increasing either the time or the applied potential (Fig. 4). The deposition rate is similar for all potentials. These results are in good agreement with the micrographs shown in Fig. 3. As expected, the higher value of R was found at 40 V cm−1 and 10 min.
3.3. Spectroscopic properties and oxygen sensitivity
The luminescence spectra were recorded in order to evaluate the possible changes in the spectroscopic behavior of the oxygen-sensitive films once the nanoparticles had undergone an applied potential. ESI-3† shows the excitation and emission spectra of the chip obtained at the highest potential and time (40 V cm−1 and 10 min), showing no change in the spectroscopic properties compared to the dye in solution or in a classical polystyrene (PS) membrane.25,40 It shows three excitation peaks, at ∼390, 508 and 540 nm, corresponding to the Soret and Q bands of platinum porphyrins. In addition, the emission peak at 650 nm was completely quenched in the presence of oxygen.In order to evaluate the oxygen sensitive properties of the films, the phase shift was recorded using the phase-modulation method (see ESI†) and the setup is described in Fig. ESI-1.† Assuming that the luminescence decay is monoexponential, the relationship between the emission lifetime τ (in seconds) and the phase shift Φ (in radians) is given by expression (1), where f is the modulation frequency (in Hz).9,25
 | (1) |
Fig. ESI-2† describes the procedure for the selection of the optimal f necessary for the phase-shift measurements. The modulation frequency was set at 5145 Hz as a compromise between the maximum phase-shift for each range of O2 concentrations and the signal-to-noise ratio (SNR) for the signal reaching the photodetector, which decreases with frequency.
Table 2 shows the lifetime of all the sensing films in the absence and in the presence of 20% of oxygen, confirming that the lifetime is not influenced by the amount of particles. In addition, no change in the lifetime was observed when comparing the lifetime of the chips with a classical liquid membrane based on the same polymer deposited in a glass support (in both cases τ0 is around 65 μs). Although gold is known to quench the luminescence of some molecules,41 this effect was not observed in this case, probably due to the protection that the polymer provides to the oxygen-sensitive dye.
| E (V cm−1) | t (min) | τ 0 a , b (μs) | τ 20 a , c (μs) | Demas modela | ||||
|---|---|---|---|---|---|---|---|---|
| f 1 | k SV1 (bar−1) | f 2 | k SV2 (bar−1) | r | ||||
a The experimental results have been expressed as the average of 3 replicas  (n = 3, t = 4.30 (2P = 0.05)).
b Lifetime in the absence of oxygen.
c Lifetime in the presence of 20% of oxygen.
d Reference membrane prepared as in ref. 42. (n = 3, t = 4.30 (2P = 0.05)).
b Lifetime in the absence of oxygen.
c Lifetime in the presence of 20% of oxygen.
d Reference membrane prepared as in ref. 42.
|
||||||||
| 10 | 1 | 63.03 ± 2.24 | 12.91 ± 3.28 | 0.82 ± 0.00 | 45.53 ± 0.52 | 0.19 ± 0.00 | 2.03 ± 0.21 | 0.9999 |
| 5 | 63.53 ± 2.35 | 13.48 ± 0.54 | 0.82 ± 0.00 | 46.37 ± 0.55 | 0.19 ± 0.00 | 2.12 ± 0.13 | 0.9999 | |
| 10 | 61.83 ± 2.03 | 13.44 ± 0.58 | 0.82 ± 0.00 | 46.28 ± 1.17 | 0.19 ± 0.01 | 1.96 ± 0.36 | 0.9999 | |
| 20 | 1 | 64.55 ± 4.25 | 13.38 ± 1.21 | 0.82 ± 0.00 | 51.68 ± 2.38 | 0.19 ± 0.00 | 2.09 ± 0.22 | 0.9999 |
| 5 | 64.35 ± 5.71 | 13.33 ± 1.42 | 0.83 ± 0.00 | 48.06 ± 0.42 | 0.18 ± 0.00 | 2.11 ± 0.28 | 0.9999 | |
| 10 | 59.71 ± 3.31 | 12.77 ± 1.89 | 0.82 ± 0.01 | 49.53 ± 5.38 | 0.19 ± 0.01 | 2.17 ± 0.06 | 0.9999 | |
| 30 | 1 | 65.28 ± 1.50 | 13.53 ± 0.97 | 0.82 ± 0.00 | 50.51 ± 0.31 | 0.18 ± 0.00 | 2.17 ± 0.07 | 0.9999 |
| 5 | 62.66 ± 3.02 | 13.60 ± 0.80 | 0.81 ± 0.00 | 50.66 ± 4.01 | 0.20 ± 0.01 | 1.93 ± 0.06 | 0.9999 | |
| 10 | 60.53 ± 1.09 | 13.37 ± 2.12 | 0.80 ± 0.01 | 51.70 ± 2.75 | 0.22 ± 0.01 | 1.79 ± 0.26 | 0.9999 | |
| 40 | 1 | 64.46 ± 3.18 | 13.66 ± 0.54 | 0.82 ± 0.02 | 48.72 ± 7.06 | 0.18 ± 0.03 | 1.67 ± 0.09 | 0.9999 |
| 5 | 61.61 ± 2.72 | 13.55 ± 0.34 | 0.82 ± 0.01 | 47.32 ± 2.05 | 0.19 ± 0.02 | 1.56 ± 0.05 | 0.9999 | |
| 10 | 60.09 ± 4.97 | 13.57 ± 0.62 | 0.86 ± 0.02 | 37.11 ± 1.75 | 0.12 ± 0.03 | 0.00 ± 0.00 | 0.9994 | |
| PSMA membraned | 65.03 ± 3.57 | 13.27 ± 0.22 | 0.85 ± 0.22 | 49.25 ± 1.55 | 0.17 ± 0.02 | 2.10 ± 0.03 | 0.9999 | |
The oxygen sensing properties were evaluated by the reduction in the lifetime of emission (obtained with eqn (1)) when different oxygen concentrations are present. ESI-5† shows the phase shift measurement and decay plot obtained for the chip undergoing 40 V cm−1/1 min. Similar behaviors were found for the rest of the sensing phases obtained by EPD. In all of them the phase shift was practically quenched by 30% oxygen, showing no differences in the lifetime between 30% and 100% O2.
The response to oxygen is usually explained according to the Stern–Volmer equation.9 However, in this case the response between 0 and 30% does not follow the lineal behavior and the results have to be explained using a multi-site model, in which different types of oxygen quenching sites are present in the matrix. This behavior is typical in polymeric films due to the heterogeneity of the matrix where the dye is dispersed.32,43 The most simple is the two-site model (with each site having a linear behavior), proposed by Demas and co-workers.44 (see eqn (2))
 | (2) |
Fig. 5a shows the calibration curve obtained using the Demas equation for the chip produced at 30 V cm−1 for 10 min. Similar behaviors were found for the rest of the chip obtained by EPD (see Fig. ESI-6 and 7†). For each sensing film the value of the Stern–Volmer constants was determined, and it was used to evaluate the oxygen sensitivity of the films. Table 2 shows the parameters obtained for the Demas model, which are practically the same for all the range of selected potentials and deposition times, except for the sensing film deposited at 40 V cm−1 for 10 min. Its kSV1 decreases compared to the rest (37 bar−1vs. ∼50 bar−1) probably due to the high conditions of potential and deposition time, both in the upper border of the studied range. The correlation coefficients of the fittings (r) shown in Table 2 confirm that eqn (2) is appropriate to adjust the data. According to the Demas model, the response to oxygen for all the chips suggests the existence of two sites within the matrix: a first fraction of sites (f1) possessing a high kSV1, and a second fraction of sites (f2), whose contribution is very small compared to f1, presenting less sensitivity. The values for kSV1 found for the sensing films are in agreement with the results found for a classical PS membrane (kSV1 = 40.31 ± 3.90 bar−1)25 and a PSMA membrane deposited over a glass support (kSV1 = 49.25 ± 1.55 bar−1; see Table 2), which were also the same than those obtained for a gold chip drop-coated with PSMA particles and dried under vacuum. The same oxygen behavior, regardless of the amount of particles deposited, hints that even at 250 nm thickness the sensitivity to oxygen is still restricted by the polymer permeability to oxygen as well as the distribution of the dye inside the polymeric material.
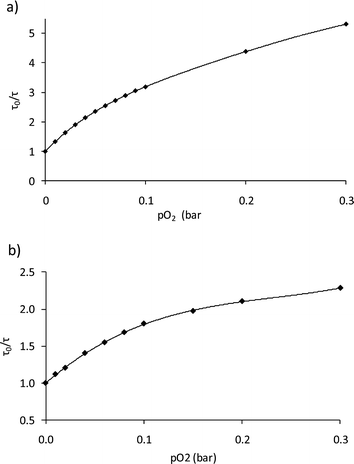 | ||
| Fig. 5 Stern–Volmer plot for the sensing film obtained with 30 V cm−1/10 min: (a) gas calibration; and (b) dissolved oxygen calibration. | ||
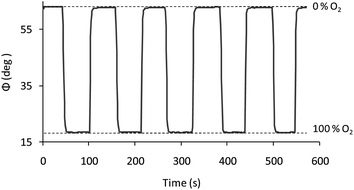
Since the physicochemical quenching reaction is a reversible process, the complete reversibility of the luminescence emission of the films allows us to continuously monitor the increasing and decreasing amounts of O2. Fig. 6 shows the operational stability for one of the replicas at 30 V cm−1/10 min, which was conducted by measuring the phase shift under alternating nitrogen and oxygen saturated atmospheres.
The response (t95) of optical sensors can be defined as the time at which the signal reaches the 95% of the total response and it is an important feature in all chemical sensors, especially in medical monitoring where fast responses are desired. The t95 was measured using a luminescence spectrophotometer by exposing the sensing films to alternating N2 and O2 atmospheres. All t95 were shorter than 0.4 s when changing either from 0% O2 to 100% O2 or from 100% O2 to 0% O2. The response times are shorter than those reported in the literature for the same types of material.26,40 The nanoparticulated nature of the sensing layer and its thickness seem to be responsible for the improvement in t95, which are in good agreement with other sensing layers of similar thickness.45,46
The limit of detection (LOD), calculated as the concentration of oxygen which produced an analytical signal three times the standard deviation of ten injections of a blank (0% oxygen), was 0.02 mbar.
3.4. Dissolved oxygen measurements
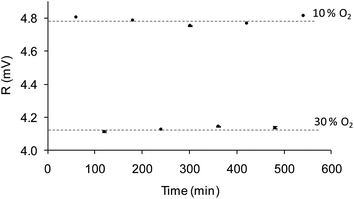
The sensitivity to oxygen in the aqueous phase was also analyzed between 0 and 30% of oxygen bubbled into the water (a commercial Clark electrode was used to monitor the actual oxygen concentration in the water, which ranged from 0 and 11.28 ppm). Fig. 5b shows the Stern–Volmer plot which shows the following adjustment according to eqn (2): f1 = 0.66; kSV1 = 20.72 bar−1, f2 = 0.34, kSV2 = 0.00 bar−1; this decrease in sensitivity compared to the gas measurements is common in aqueous systems and it can be explained by the smaller number density of oxygen molecules in water and the relative hydrophilicity of the polymer.47 The lifetime of the nanoparticle dispersion in the absence of oxygen (62 μs) did not agree well with the lifetime of the film produced by EPD in water (∼50 μs), suggesting that the small layer produced by EPD is more affected by the aqueous environment than the bulk suspension. Nevertheless, the sensitivity of 20.72 bar−1 and a LOD of 0.3 mbar confirm the suitability of the films to measure O2 in the physiological range.Furthermore, in order to evaluate the attachment of the nanoparticles over the gold surface, the chips underwent a continuous water flow of 1 mL min−1 for 10 hours. The O2 concentration in the water flow was changed from 10% to 30% O2 consecutively, and the R value of the modulated emission signal was recorded for 100 seconds every 60 minutes. If the sensing nanoparticles leach out of the chip, the intensity emission (i.e. R value of the emission signal) will decrease for any of the oxygen concentration. Fig. 7 shows the average value of the measurements at each oxygen concentration for chip 30 V cm−1/5 min with its error (calculated using Student's t-test with n = 100 and α = 0.025). The same level of R with a small error is reached for each concentration, confirming that the measurement is stable and there is no removal of the nanoparticles from the gold surface.
The same procedure was followed to analyze the stability of the chip towards buffer solutions at the physiological range and different ionic strengths. The results showed no lixiviation of the particles from the surface. It would be interesting to know how the ionic strength and pH could affect the sensitivity of the EPD sensing chips for specific applications and should be taken into account for future research.
4. Conclusions
Optical oxygen sensing films have been developed by electrophoretic deposition of polymeric nanoparticles based on the poly(styrene-co-maleic anhydride) polymer and the luminescent oxygen sensitive dye PtTFPP. The carboxylic groups present in the particles surface are responsible for their high stability in water and allowed anodic EPD to be performed at different potential and deposition times.The amount and morphology of the particles deposited were evaluated according to the SEM photographs and by analyzing the magnitude R of the emission collected for the different times and potentials. The results show that the amount of polymer deposited is increased when increasing both the deposition time and potential. SEM confirms a homogeneous distribution of the particles over the surface, with a single layer of particles.
Furthermore, full characterization of the chips covered with the oxygen sensing films was carried out both in gas and aqueous phases. All the chips showed similar behavior, regardless of applied potential or time, with kSV1 from 45 to 51.70 bar−1. Due to the small thicknesses of the films (about hundreds of nanometers), short response times (less than 0.4 s) were obtained. In addition, the ability of the sensing films to measure dissolved oxygen was also evaluated showing a kSV1 of 20.72 bar−1. The nanoparticles were well attached to the gold surface as they did not leach when undergoing a continuous water flow for 10 hours.
We can conclude that EPD of polymeric oxygen-sensitive nanoparticles is a suitable method for the development of optical sensing films. This technique can be applied to different kinds of conductive substrates. Advantageously, these films could be integrated in complex microdevice geometries such as microrobots and MEMS. The use of polymers with carboxylic groups allows further covalent crosslinking of biomolecules. In addition, multi-deposition of different optical indicators could be also feasible in order to develop multiparametric sensing phases for a variety of applications.
Acknowledgements
We acknowledge financial support for this work by the Regional Government of Andalusia (Excellence projects P07-FQM-2625 and P07-FQM-2738) and the Spanish Ministry of Economy and Competitiveness (CTQ2011-25316).References
- N. Galloway, W. Amoaku, P. Galloway and A. Browning, Common Diseases of the Conjunctiva and Cornea, in Common Eye Diseases and their Management, Springer, London, 2006, pp. 45–60 Search PubMed.
- C. A. K. Lange, P. Stavrakas, U. F. O. Luhmann, D. J. de Silva, R. R. Ali, Z. J. Gregor and J. W. B. Bainbridge, Am. J. Ophthalmol., 2011, 152, 406–412 CAS.
- W. Abdallah, H. Ameri, E. Barron, G. J. Chader, E. Greenbaum, D. R. Hinton and M. S. Humayun, Invest. Ophthalmol. Visual Sci., 2011, 52, 1035–1042 Search PubMed.
- I. A. Barbazetto, J. Liang, S. Chang, L. Zheng, A. Spector and J. P. Dillon, Exp. Eye Res., 2004, 78, 917–924 CrossRef CAS PubMed.
- S. E. Lyshevski, MEMS and NEMS: Systems, Devices, and Structures, CRC PressINC, 2002 Search PubMed.
- W. H. Ko, Sens. Actuators, A, 2007, 136, 62–67 CrossRef CAS PubMed.
- S. Saliterman, Fundamentals of bioMEMS and medical microdevices, Wiley-Interscience, 2006 Search PubMed.
- O. S. Wolfbeis, J. Mater. Chem., 2005, 15, 2657–2669 RSC.
- J. R. Lakowicz, Principles of fluorescence spectroscopy, Springer, 2006 Search PubMed.
- F. Baldini, Anal. Bioanal. Chem., 2009, 393, 1089–1090 CrossRef CAS PubMed.
- O. Ergeneman, G. Chatzipirpiridis, J. Pokki, M. Marín-Suárez, G. A. Sotiriou, S. Medina-Rodríguez, J. F. Fernández-Sanchez, G. Fernández, A. S. Pane and B. J. Nelson, IEEE Trans. Biomed. Eng., 2012, 59, 3104–3109 CrossRef PubMed.
- B. J. Nelson, I. K. Kaliakatsos and J. J. Abbott, Annu. Rev. Biomed. Eng., 2010, 12, 55–85 CrossRef CAS PubMed.
- O. Ergeneman, J. J. Abbott, G. Dogangil and B. J. Nelson, Functionalizing intraocular microrobots with surface coatings, 2008 Search PubMed.
- O. Ergeneman, G. Dogangil, M. P. Kummer, J. J. Abbott, M. K. Nazeeruddin and B. J. Nelson, IEEE Sens. J., 2008, 8, 29–37 CrossRef CAS.
- J. Pokki, O. Ergeneman, K. M. Sivaraman, B. Ozkale, M. A. Zeeshan, T. Luhmann, B. J. Nelson and S. Pane, Nanoscale, 2012, 4, 3083–3088 RSC.
- A. L. Rogach, N. A. Kotov, D. S. Koktysh, J. W. Ostrander and G. A. Ragoisha, Chem. Mater., 2000, 12, 2721–2726 CrossRef CAS.
- L. Besra and M. Liu, Prog. Mater. Sci., 2007, 52, 1–61 CrossRef CAS PubMed.
- A. R. Boccaccini, S. Keim, R. Ma, Y. Li and I. Zhitomirsky, J. R. Soc., Interface, 2010, 7, S581–S613 CrossRef CAS PubMed.
- O. Yarimaga, B. Yoon, D.-Y. Ham, J. Lee, M. Hara, Y.-K. Choi and J.-M. Kim, J. Mater. Chem., 2011, 21, 18605–18612 RSC.
- Z. Sun, L. Jin, S. Zhang, W. Shi, M. Pu, M. Wei, D. G. Evans and X. Duan, Anal. Chim. Acta, 2011, 702, 95–101 CrossRef CAS PubMed.
- W. Shi, S. He, M. Wei, D. G. Evans and X. Duan, Adv. Funct. Mater., 2010, 20, 3856–3863 CrossRef CAS.
- J. R. Lakowicz, Principles of Fluorescence Spectroscopy, Kluwer Academic, New York, 1999 Search PubMed.
- D. B. Papkovsky, Sens. Actuators, B, 1993, 11, 293–300 CrossRef CAS.
- S. M. Borisov, T. Mayr, G. Mistlberger, K. Waich, K. Koren, P. Chojnacki and I. Klimant, Talanta, 2009, 79, 1322–1330 CrossRef CAS PubMed.
- S. Medina-Rodríguez, A. de la Torre-Vega, J. F. Fernández-Sánchez and A. Fernández-Gutiérrez, Sens. Actuators, B, 2013, 176, 1110–1120 CrossRef PubMed.
- Y. Amao, T. Miyashita and I. Okura, J. Fluorine Chem., 2001, 107, 101–106 CrossRef CAS.
- W. Trettnak, C. Kolle, F. Reininger, C. Dolezal and P. O'Leary, Sens. Actuators, B, 1996, 36, 506–512 CrossRef CAS.
- G. Mistlberger, K. Koren, E. Scheucher, D. Aigner, S. M. Borisov, A. Zankel, P. Pölt and I. Klimant, Adv. Funct. Mater., 2010, 20, 1842–1851 CrossRef CAS.
- M. Marín-Suárez, A. L. Medina-Castillo, J. F. Fernández-Sánchez and A. Fernández-Gutiérrez, Isr. J. Chem., 2012, 52, 264–275 CrossRef.
- G. Mistlberger, A. Medina-Castillo, S. Borisov, T. Mayr, A. Fernández-Gutiérrez, J. Fernández-Sánchez and I. Klimant, Microchim. Acta, 2011, 172, 299–308 CrossRef CAS.
- G. n. Mistlberger, S. M. Borisov and I. Klimant, Sens. Actuators, B, 2009, 139, 174–180 CrossRef CAS PubMed.
- S. Borisov and I. Klimant, Microchim. Acta, 2009, 164, 7–15 CrossRef CAS.
- B. Ferrari and R. Moreno, J. Eur. Ceram. Soc., 2009, 30, 1069–1078 CrossRef PubMed.
- C. Freitas and R. H. Müller, Int. J. Pharm., 1998, 168, 221–229 CrossRef CAS.
- G. Garnier, M. Duskova-Smrckova, R. Vyhnalkova, T. G. M. van de Ven and J.-F. Revol, Langmuir, 2000, 16, 3757–3763 CrossRef CAS.
- J. D. Ferry, D. C. Udy, F. C. Wu, G. E. Heckler and D. B. Fordyce, J. Colloid Sci., 1951, 6, 429–442 CrossRef CAS.
- E. R. Garrett and R. L. Guile, J. Am. Chem. Soc., 1951, 73, 4533–4535 CrossRef CAS.
- S. Banerjee, K. Sen, T. K. Pal and S. K. Guha, Int. J. Pharm., 2012, 436, 786–797 CrossRef CAS PubMed.
- H. C. Hamaker, Trans. Faraday Soc., 1940, 35, 279–287 RSC.
- S.-K. Lee and I. Okura, Anal. Commun., 1997, 34, 185–188 RSC.
- E. Dulkeith, A. C. Morteani, T. Niedereichholz, T. A. Klar, J. Feldmann, S. A. Levi, F. C. J. M. van Veggel, D. N. Reinhoudt, M. Müller and D. I. Gittins, Phys. Rev. Lett., 2002, 89, 203002 CrossRef CAS.
- M. Marín-Suárez, B. F. E. Curchod, I. Tavernelli, U. Rothlisberger, R. Scopelliti, I. Jung, D. Di Censo, M. Grätzel, J. F. Fernández-Sánchez, A. Fernández-Gutiérrez, M. K. Nazeeruddin and E. Baranoff, Chem. Mater., 2012, 24, 2330–2338 CrossRef.
- M. Marin-Suarezdel Toro, J. F. Fernandez-Sanchez, E. Baranoff, M. K. Nazeeruddin, M. Graetzel and A. Fernandez-Gutierrez, Talanta, 2010, 82, 620–626 CrossRef CAS PubMed.
- J. N. Demas and B. A. DeGraff, Sens. Actuators, B, 1993, 11, 35–41 CrossRef CAS.
- S. M. Borisov, D. L. Herrod and I. Klimant, Sens. Actuators, B, 2009, 139, 52–58 CrossRef CAS PubMed.
- T. Mayr, S. M. Borisov, T. Abel, B. Enko, K. Waich, G. n. Mistlberger and I. Klimant, Anal. Chem., 2009, 81, 6541–6545 CrossRef CAS.
- C. McDonagh, B. D. MacCraith and A. K. McEvoy, Anal. Chem., 1998, 70, 45–50 CrossRef CAS PubMed.
Footnote |
| † Electronic supplementary information (ESI) available. See DOI: 10.1039/c3nr03336h |
| This journal is © The Royal Society of Chemistry 2014 |

