Size effect of lithium peroxide on charging performance of Li–O2 batteries†
Yuxiang
Hu
ab,
Xiaopeng
Han
ab,
Fangyi
Cheng
*ab,
Qing
Zhao
ab,
Zhe
Hu
ab and
Jun
Chen
*ab
aKey Laboratory of Advanced Energy Materials Chemistry (Ministry of Education), College of Chemistry, Nankai University, Tianjin 300071, China. E-mail: fycheng@nankai.edu.cn
bSynergetic Innovation Center of Chemical Science and Engineering (Tianjin), Tianjin 300071, China. E-mail: chenabc@nankai.edu.cn; Fax: +86-22-23509571; Tel: +86-22-23504482
First published on 12th November 2013
Abstract
We report herein that the particle size of Li2O2, which is the discharged product of a Li–O2 battery, remarkably influences the charging performance. As the particle size decreases, the average voltage of charge plateaus is lowered due to reduced electrode polarization and enhanced kinetics of the oxidation reaction of Li2O2.
Rechargeable lithium–oxygen batteries are considered as promising next-generation devices for energy storage and conversion because of their high theoretical specific energy (>3500 W h kg−1), which is 2–4 times larger than that of current lithium-ion batteries.1,2 However, they suffer from several issues such as poor cyclability, limited rate capability and high overpotential (0.4–1.5 V).3 In particular, the polarization during the oxygen evolution reaction (OER) process is severe, leading to low round-trip efficiencies (the ratio of discharge to charge voltages) of the batteries. The OER process is reported to be affected by complex factors such the catalyst, binder, electrolyte and the discharge product (i.e., Li2O2).4–22 Recent studies have correlated the high charging terrace of lithium–oxygen batteries with Li2O2 in different aspects including electric/ionic transport,23 vacancies,24 temperature,25 and morphology.26 However, to the best of our knowledge, there have been few attempts to specifically elucidate the relationship between the particle size of Li2O2 and its charging characteristics. The striking size effect on the electrochemical properties of electrode materials has been widely demonstrated in the context of lithium batteries.27 Since the reversible formation/decomposition of Li2O2 (2Li + O2 ↔ Li2O2) holds the key to the operation of a rechargeable Li–O2 cell, in this study we investigate how the particle size of lithium peroxide affects the charging performances of the cathode.
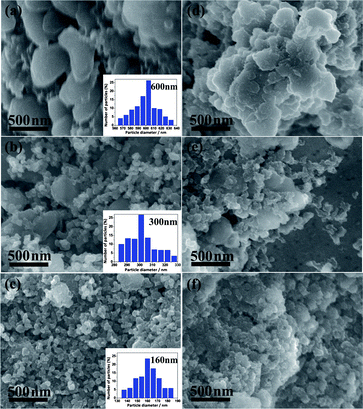
Lithium peroxide samples with different particle sizes were prepared by ball-milling Li2O2 with carbon (Super P) under an argon atmosphere (SL-160), mechanical grinding Li2O2 with Super P (SL-300), and in situ discharging the Super P electrode (SL-600). Super P is a widely employed material in the air electrode of a Li–O2 battery.6,16,28 Characterization was performed on the sample homogeneously mixed with Super P (typical particle size of ∼50 nm), which acted as the cathode catalyst of the Li–O2 cells in our study. Fig. 1a–c show the morphology of the three peroxide–carbon hybrids and the corresponding particle size analysis (insets). The size of SL-600 was located between 560 and 640 nm (Fig. 1a), which is comparable to the reported typical size of Li2O2.15,28,29 Size distribution analysis indicated that the average particle diameters of SL-300 (Fig. 1b) and SL-160 (Fig. 1c) were ∼300 and 160 nm, respectively. Super P remained at a similar dimensional scale in all samples. As the three samples exhibited a similar particulate shape, we could thus clearly evaluate the size effect by excluding the possible influential factor of material morphology.20,30
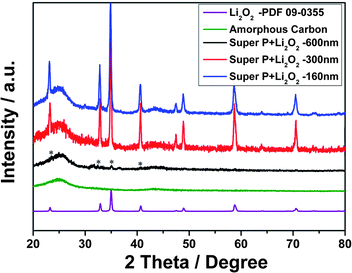
Fig. 2 shows the powder X-ray diffraction (XRD) patterns of the obtained Li2O2/C samples and the neat super P. The three mixtures showed typical profiles that could be indexed to amorphous carbon and lithium peroxide (Joint Committee on Powder Diffraction Standards, JCPDS card no. 09-0355). Both samples prepared by mechanical grinding and ball-milling present almost identical profiles and sharp peaks close to the standard Li2O2 reference. The weak intensity of lithium peroxide in the SL-600 sample was ascribed to its low crystallinity, which is common in the discharged product of Li–O2 batteries.14,29,31 The presence of Li2O2 in the discharged product was confirmed by the FTIR analysis of the SL-600 sample (Fig. S1, ESI†). It should be pointed out that SL-600 may contain a trace amount of Li2CO3, although no discernible signal can be observed in its FTIR spectrum. Concomitant formation of Li2CO3 during the charge–discharge cycling has been reported in different Li–air cells.28,32,33 We note that weak peaks assigned to Li2CO3 are detectable for the discharged electrode after 5 cycles, which, however, has little effect on the charging plateaus (Fig. S1†).
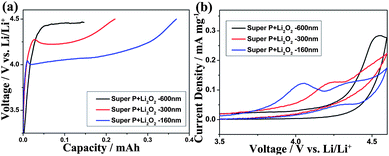
The three Li2O2/C samples were employed as the cathodes to assemble coin-type Li–O2 cells. Fig. 3a shows the charging curves of the cells at a current density and cut-off voltage of 50 mA gcarbon−1 and 4.5 V, respectively. Obviously, the plateau of the charging profile was lowered as the particle size of Li2O2 decreased. The corresponding midpoint plateau voltages were about 4.05, 4.25, and 4.45 V (vs. Li/Li+) for cells fabricated with SL-160, SL-300, and SL-600. In addition, the charge capacity followed the order of SL-600 < SL-300 < SL-160. Furthermore, the terraces of the sequent discharge curves increased and the overpotential (ΔV) reduced with decreasing particle diameter (Fig. S2, ESI†), although the size effect is insignificant on the discharge properties due to the fact that the solid Li2O2 is oxidized to form Li+ and O2 after full charging. The round-trip efficiencies of SL-600, SL-300 and SL-160 were 59%, 64% and 67%. Fig. 3b shows the cyclic voltammograms (CVs) of the three hybrids. The potential of the anodic peaks matched well with the plateau of charging curves, indicating a similar trend of size-dependent oxidation voltages. Therefore, the size of lithium peroxide exerts a significant impact on the charging performance. Smaller particle size results in lower overpotential as well as higher capacity and energy efficiency.
 | ||
| Fig. 3 Comparison of the charging properties of SL-600, SL-300 and SL-160: (a) typical charging curves at 50 mA gcarbon−1 and (b) cyclic voltammograms at a potential scan rate of 0.1 mV s−1. | ||
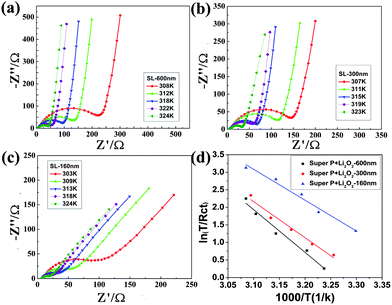
Electrochemical impedance spectroscopy (EIS) was performed to further investigate the electrode kinetics of the three samples with different particle sizes. Fig. 4 shows the EIS curves measured at the midpoint charged state of each electrode. The semicircle in the high-frequency region and the straight line in the low-frequency region indicated that the OER involved a charge transfer and a Li+ diffusion process. Fig. S3 in the ESI† compares the impedance spectra of three samples at a temperature of 298 K, along with an equivalent circuit to fit the data. A comparison of the fitted charge transfer resistance (Rct) clearly indicated better electrode kinetics for smaller size of the lithium peroxide. The apparent activation energy (Ea) for the decomposition of the Li2O2 was calculated by the following equation:27
i0 = RT/nFRct = A![[thin space (1/6-em)]](https://www.rsc.org/images/entities/char_2009.gif) exp(−Ea/RT) exp(−Ea/RT) | (1) |
 | ||
| Fig. 4 EIS recorded at varied temperatures for Li–air cells assembled with different electrodes: (a) SL-600, (b) SL-300, and (c) SL-160. (d) The Arrhenius plots of ln(T/Rct) versus 1/T. | ||
Table 1 summarizes the main electrochemical properties of the Li2O2 samples with different particle sizes. Clearly, smaller particle size results in enhanced reactivity and electrode kinetics. The remarkable size effect of Li2O2 on its electrode performance can be understood from the following points. First, smaller size (and thus larger interface) allows better contact between Li2O2 and electrolyte/catalyst/conducting agent. As Li2O2 is a typical electrically insulating material,23 facile electron conduction is a prerequisite. The lowered charging potential results from reduced polarization. Second, the higher surface area associated with smaller size favors the electrocatalysis of the OER, which is a heterogeneous process, occurring in solution–solid–gas or solution–solid interphase regions. Furthermore, as the OER kinetics is intrinsically slow, reducing particle size helps to increase the reactivity and utilization efficiency of active materials (i.e., Li2O2). We carried out SEM imaging (Fig. 2d–f) and FTIR (Fig. S4, ESI†) to analyze the air electrode after charging. The results revealed that the electrochemical decomposition of Li2O2 was almost complete in SL-160, without the observed FTIR peaks being indexed to Li2O2. In comparison, remaining peroxide could be detected for SL-300 and SL-600. This suggests insufficient oxidation of the discharged species, similar to the case of previously reported results.30 Thus, the particle size exerts a significant impact on the chargeability of Li2O2, which plays an important role in determining the electrochemical performance of Li–O2 cells. Along this line, how to control the particle size of the discharged product in Li–air batteries is attractive. It can be expected that downsizing Li2O2 below 100 nm would result in more prominent improvement in charging performance. Besides the size effect, synthetic methods and defects of Li2O2 are also possible factors affecting the electrochemical properties, which require further investigation.
| Sample | Average diameter (nm) | Potential at midpoint charge plateau (V vs. Li) | Round-trip efficiency | R ct (298 K) (Ω) | E a (kJ mol−1) |
|---|---|---|---|---|---|
| SL-600 | 600 | 4.45 | 59% | 250.3 | 63.7 |
| SL-300 | 300 | 4.25 | 64% | 170.8 | 52.3 |
| SL-160 | 160 | 4.05 | 67% | 100.5 | 42.5 |
In conclusion, we demonstrated that downsizing lithium peroxide results in a lower charging plateau and higher charge capacity due to enhanced electrode kinetics and reduced polarization. The results indicate that tuning the particle size of peroxide is of great importance in improving the electrode performance of a Li–O2 battery. In this regard, confining the discharge product in a conductive, nanostructured matrix will be an effective strategy to develop an efficient air electrode.
Acknowledgements
This work was supported by the National 973 (2011CB935902), 863 (2011AA050704), NSFC (21231005 and 21322101), 111 Project (B12015), and Tianjin High-Tech (12ZCZDJC35300).Notes and references
- P. G. Bruce, S. A. Freunberger, L. J. Hardwick and J. M. Tarascon, Nat. Mater., 2012, 11, 19 CrossRef CAS PubMed.
- Y. C. Lu, B. M. Gallant, D. G. Kwabi, J. R. Harding, R. R. Mitchell, M. S. Whittingham and Y. Shao-Horn, Energy Environ. Sci., 2013, 6, 750 CAS.
- G. Girishkumar, B. McCloskey, A. C. Luntz, S. Swanson and W. Wilcke, J. Phys. Chem. Lett., 2010, 1, 2193 CrossRef CAS.
- J. Lu, Y. Qin, P. Du, X. Y. Luo, T. P. Wu, Y. Ren, J. G. Wen, D. J. Miller, J. T. Miller and K. Amine, RSC Adv., 2013, 3, 8276 RSC.
- J. Gomez, E. E. Kalu, R. Nelson, M. H. Weatherspoon and J. P. Zheng, J. Mater. Chem. A, 2013, 1, 3287 CAS.
- Z. Y. Guo, G. N. Zhu, Z. J. Qiu, Y. G. Wang and Y. Y. Xia, Electrochem. Commun., 2012, 25, 26 CrossRef CAS PubMed.
- H. L. Wang, Y. Yang, Y. Y. Liang, G. Y. Zheng, Y. G. Li, Y. Cui and H. J. Dai, Energy Environ. Sci., 2012, 5, 7931 CAS.
- Y. Chen, S. A. Freunberger, Z. Peng, O. Fontaine and P. G. Bruce, Nat. Chem., 2013, 5, 489 CrossRef CAS PubMed.
- J. Li, H. M. Zhang, Y. N. Zhang, M. R. Wang, F. X. Zhang and H. J. Nie, Nanoscale, 2013, 5, 4647 RSC.
- W. Yang, J. Salim, S. Li, C. W. Sun, L. Q. Chen, J. B. Goodenough and Y. Kim, J. Mater. Chem., 2012, 22, 18902 RSC.
- R. Younesi, M. Hahlin, M. Treskow, J. Scheers, P. Johansson and K. Edström, J. Phys. Chem. C, 2012, 116, 18597 CAS.
- R. Black, S. H. Oh, J. H. Lee, T. Yim, B. Adams and L. F. Nazar, J. Am. Chem. Soc., 2012, 134, 2902 CrossRef CAS PubMed.
- Y. Cao, Z. K. Wei, J. He, J. Zang, Q. Zhang, M. S. Zheng and Q. F. Dong, Energy Environ. Sci., 2012, 5, 9765 CAS.
- D. Xu, Z. L. Wang, J. J. Xu, L. L. Zhang, L. M. Wang and X. B. Zhang, Chem. Commun., 2012, 48, 11674 RSC.
- F. Y. Cheng and J. Chen, Chem. Soc. Rev., 2012, 41, 2172 RSC.
- F. Y. Cheng and J. Chen, Acta Chim. Sinica, 2013, 71, 473 CrossRef CAS.
- W. Y. Zhang, J. X. Zhu, H. X. Ang, Y. Zeng, N. Xiao, Y. B. Gao, W. L. Liu, H. H. Hng and Q. Y. Yan, Nanoscale, 2013, 5, 9651 RSC.
- F. J. Li, T. Zhang, Y. Yamada, A. Yamada and H. S. Zhou, Adv. Energy Mater., 2013, 3, 532 CrossRef CAS.
- F. Y. Cheng, T. R. Zhang, Y. Zhang, J. Du, X. P. Han and J. Chen, Angew. Chem., Int. Ed., 2013, 52, 2474 CrossRef CAS PubMed.
- B. D. Adams, C. Radtke, R. Black, M. L. Trudeau, K. Zaghib and L. F. Nazar, Energy Environ. Sci., 2013, 6, 1772 CAS.
- F. Y. Cheng, J. Shen, B. Peng, Y. D. Pan, Z. L. Tao and J. Chen, Nat. Chem., 2011, 3, 79 CrossRef CAS PubMed.
- S. M. Dong, X. Chen, K. J. Zhang, L. Gu, L. X. Zhang, X. H. Zhou, L. F. Li, Z. H. Liu, P. X. Han, H. X. Xu, J. H. Yao, C. J. Zhang, X. Y. Zhang, C. Q. Shang, G. L. Cui and L. Q. Chen, Chem. Commun., 2011, 47, 11291 RSC.
- O. Gerbig, R. Merkle and J. Maier, Adv. Mater., 2013, 25, 3129 CrossRef CAS PubMed.
- J. S. Hummelshoj, J. Blomqvist, S. Datta, T. Vegge, J. Rossmeisl, K. S. Thygesen, A. C. Luntz, K. W. Jacobsen and J. K. Norskov, J. Chem. Phys., 2010, 132, 071101 CrossRef CAS PubMed.
- J. B. Park, J. Hassoun, H. G. Jung, H. S. Kim, C. S. Yoon, I. H. Oh, B. Scrosati and Y. K. Sun, Nano Lett., 2013, 13, 2971 CrossRef CAS PubMed.
- B. M. Gallant, D. G. Kwabi, R. R. Mitchell, J. Zhou, C. Thompson and Y. Shao-Horn, Energy Environ. Sci., 2013, 6, 2518 CAS.
- J. Chen and F. Y. Cheng, Acc. Chem. Res., 2009, 42, 713 CrossRef CAS PubMed.
- H. G. Jung, J. Hassoun, J. B. Park, Y. K. Sun and B. Scrosati, Nat. Chem., 2012, 4, 579 CrossRef CAS PubMed.
- X. Lin, L. Zhou, T. Huang and A. Yu, J. Mater. Chem. A, 2013, 1, 1239 CAS.
- L. Zhong, R. R. Mitchell, Y. Liu, B. M. Gallant, C. V. Thompson, J. Y. Huang, S. X. Mao and Y. Shao-Horn, Nano Lett., 2013, 13, 2209 CrossRef PubMed.
- J. J. Xu, D. Xu, Z. L. Wang, H. G. Wang, L. L. Zhang and X. B. Zhang, Angew. Chem., Int. Ed., 2013, 52, 3887 CrossRef CAS PubMed.
- T. Zhang and H. S. Zhou, Nat. Commun., 2013, 4, 1817 CrossRef PubMed.
- J. J. Xu, Z. L. Wang, D. Xu, L. L. Zhang and X. B. Zhang, Nat. Commun., 2013, 4, 2438 Search PubMed.
Footnote |
| † Electronic supplementary information (ESI) available: Detailed synthesis procedures and material characterizations, and additional FTIR, SEM, EIS, and charge–discharge results. See DOI: 10.1039/c3nr04728h |
| This journal is © The Royal Society of Chemistry 2014 |


