Magnetoresistive polyaniline/multi-walled carbon nanotube nanocomposites with negative permittivity†
Hongbo
Gu
ab,
Jiang
Guo
bc,
Qingliang
He
bc,
Yuan
Jiang
b,
Yudong
Huang
*a,
Neel
Haldolaarachige
e,
Zhiping
Luo
d,
David P.
Young
e,
Suying
Wei
*bc and
Zhanhu
Guo
*b
aSchool of Chemical Engineering and Technology, Harbin Institute of Technology, Harbin, Heilongjiang 150001, China. E-mail: huangyd@hit.edu.cn
bIntegrated Composites Lab (ICL), Dan F. Smith Department of Chemical Engineering, Lamar University, Beaumont, TX 77710, USA. E-mail: zhanhu.guo@lamar.edu; suying.wei@lamar.edu; Tel: +1 409 880-7654 Tel: +1 409 880 7976
cDepartment of Chemistry and Biochemistry, Lamar University, Beaumont, TX 77710, USA
dDepartment of Chemistry and Physics and Southeastern North Carolina Regional Microanalytical and Imaging Consortium, Fayetteville State University, Fayetteville, NC 28301, USA
eDepartment of Physics and Astronomy, Louisiana State University, Baton Rouge, LA 70803, USA
First published on 25th September 2013
Abstract
Contrary to the observed positive giant magnetoresistance (GMR) in as-received multi-walled carbon nanotubes (MWNTs), pure polyaniline (PANI) synthesized with Cr(VI) as oxidant and MWNTs/PANI nanocomposites with ammonium persulfate (APS) as oxidant, a room temperature negative GMR of around −2% was reported in MWNTs/PANI nanocomposites with Cr(VI) as oxidant. Different from a frequency switch of permittivity from negative to positive in MWNTs/PANI nanocomposites with APS as oxidant, unique negative permittivity was observed in MWNTs/PANI nanocomposites with Cr(VI) as oxidant within the measured frequency range from 20 to 2 × 10⁶ Hz. The obtained unique negative permittivity was explained by the plasma frequency from the Drude model, at which the permittivity changes from negative to positive and the material changes from a metamaterial to an ordinary dielectric medium. The observed positive and negative GMR behaviors in these disordered systems as verified by the temperature dependent resistivity exploration were well explained through a wave-function shrinkage model and orbital magnetoconductivity theory by calculating the changed localization length (a0).
The traditional giant magnetoresistance (GMR) effect was observed in multilayer metallic materials consisting of a pair of ferromagnetic layers separated by a non-magnetic metal layer.1 Recently, GMR effects have been reported in carbon based materials including carbon nanotubes (CNTs) and graphene, and organic semiconductors (OSCs).2–4 Especially, the GMR effects in CNT systems, conducting polymers and their nanocomposites have gained much attention. For example, 20% GMR at 8 K is reported in a hybrid system containing stacked Co-SWNT (single-walled carbon nanotube)-Fe;5 up to 300% GMR is observed in a non-magnetic supramolecular spin valve consisting of a SWNT contacted with non-magnetic electrodes and coupled through supramolecular interactions to bis-phthalocyaninatoterbium(III) complex (TbPc2) single molecule magnets by reversing the magnetic field at temperatures lower than 1 K; 53 and 65.6% room temperature GMR is observed in pure polyaniline (PANI) doped with p-toluenesulfonic acid (PTSA)6 and phosphoric acid (H3PO4),7 respectively; around 95 and 20% room temperature GMR are observed in 30 wt% Fe3O4/PANI6 and 20 wt% BaTiO3/PANI8 nanocomposites synthesized by the surface initiated polymerization (SIP) method; and a room temperature GMR of around 35% is observed in 20 wt% BaTiO3/PANI nanocomposites prepared from simple physical mixtures of PANI and BaTiO3 powders.8 CNTs/PANI nanocomposites have also been investigated for their GMR behavior,9 electrochemical energy storage,10 specific DNA sequence detection11 and hydrogen storage.12 For example, a positive room temperature GMR of around 15% is reported in 5 wt% MWNTs/PANI nanocomposites synthesized with ammonium persulfate (APS) as oxidant.9 Recently, Gu et al.13 have reported hexavalent chromium (Cr(VI)) as a strong oxidant to prepare MWNTs/PANI nanocomposites, which served as nanofillers to enhance the tensile strength (about 80%) of the epoxy matrix through strong chemical bonds formed between MWNTs and epoxy via the bridging effect of the coated PANI on the MWNT surface.
Metamaterials, historically known as artificially constructed materials with unusual electromagnetic properties,14 have gained recent attention due to their unique negative refractive index, i.e. negative permittivity and/or negative permeability at a given frequency of radiation for cloaking and invisibility applications.15,16 Recently, the term “metacomposites” has been introduced to describe nanocomposites with negative permittivity, which have potential applications for cloaking, superlens, wave filters, subwavelength imaging, remote aerospace and superconductors.6,9,17
It will be academically interesting and technically important to understand the GMR behaviors and dielectric properties of MWNTs/PANI nanocomposites formed from different oxidants. Meanwhile, negative MR, which means a reduced resistance after applying a magnetic field to the materials, is beneficial for the design of electronic devices with a reduced resistivity after applying an external magnetic field. However, the dielectric permittivity and GMR behaviors of Cr(VI) oxidized MWNTs/PANI nanocomposites have not been reported so far.
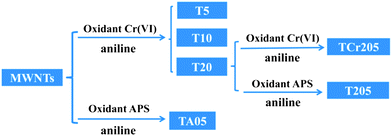
Here, unique negative permittivity and negative magnetoresistance (MR) are first reported in disordered conductive MWNTs/PANI nanocomposites with Cr(VI) as oxidant. Meanwhile, a positive MR is observed in as-received MWNTs, pure PANI synthesized using Cr(VI), and MWNTs/PANI nanocomposites prepared with ammonium persulfate (APS) as oxidant. All these are in contrast to the reported results from literature, in which only positive MR (around 15%) is reported.9 The MR behavior of these nanocomposites is theoretically analyzed based on the wave-function shrinkage model and orbital magnetoconductivity theory. The MWNTs/PANI nanocomposites were synthesized by a surface initiated polymerization (SIP) method. Briefly, MWNTs/PANI nanocomposites with MWNT loadings of 5.0, 10.0 and 20.0 wt% synthesized using Cr(VI) as oxidant are named as T5, T10 and T20, respectively. Aniline was further polymerized on T20 with APS as oxidant and the loading of T20 in the final nanocomposites was controlled at 5.0 wt%, which was named as T205. The aniline was further polymerized on T20 by Cr(VI) and the loading of T20 in the final nanocomposites was 5.0 wt% (the product was named as TCr205). Meanwhile, nanocomposites containing 5.0 wt% MWNTs were also prepared by oxidizing aniline with APS (the product was named as TA05) for comparison. The MWNTs loading in these nanocomposites was calculated based on the weight of aniline monomers. The synthesized nanocomposites in this work are shown in Scheme 1. The details for the nanocomposites synthesis are reported in the ESI.†
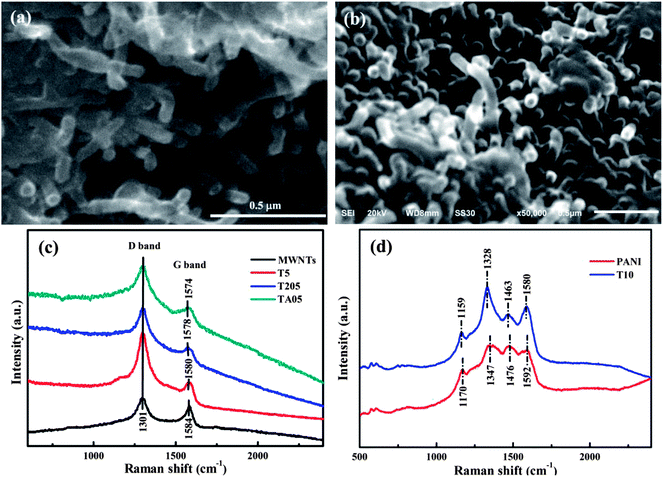
The nanocomposites exhibit very different morphology, Fig. 1, from the as-received MWNTs with randomly entangled network, Fig. S1a.† However, the network structure of the MWNTs is still observed in the T5 sample with an average diameter of about 43.4 nm with a deviation of 9%, Fig. 1a, which is thicker than that of the as-received MWNTs. The average diameter of the T20 sample is about 18.5 nm with a deviation of 11%, Fig. S1b.† The wire rather than tube structure is observed in the T205 and TCr205 samples, Fig. S1c and d,† and the average diameter of the nanotubes increases dramatically (around 100 nm) compared with that of the T20 sample, indicating the further polymerization of aniline on the surface of MWNTs. The average diameter of the TA05 sample, Fig. 1b, is also around 100 nm, which is much thicker than that of the as-received MWNTs. The Cr(VI) oxidized pure PANI shows a ball-like morphology, Fig. S1e,† similar to APS oxidized PANI.6 The TEM images of the MWNTs/PANI nanocomposites show a multilayer morphology and the surface is relatively rough, Fig. S2.† The PANI coating can be obviously observed outside the multi-walls of the MWNTs. The observed PANI coating in the T20 sample, Fig. S2c,† is thinner than that in the T5 sample, Fig. S2b.†
The characteristic peaks of PANI observed at 1560, 1470, 1285, 1234, 1114 and 782 cm−1 in pure PANI synthesized by Cr(VI), T205, and TA05 samples; 1556, 1471, 1289, 1221, 1110, and 779 cm−1 in the T5, T10 and T20 samples, Fig. S3A and B† FT-IR spectra, indicate that the synthesized PANI is in the half-oxidized form, i.e. “emeraldine” (EB) salt form.18 However, for the TCr205 sample, Fig. S3A-e,† a different peak at around 1119 cm−1 corresponds to the “pernigraniline” (PB) form of PANI.18 The absorption peaks at 1560 and 1470 cm−1 for pure PANI, Fig. S3A-b,† correspond to the C![[double bond, length as m-dash]](https://www.rsc.org/images/entities/char_e001.gif) C stretching vibrations of the quinoid and benzenoid rings in PANI, respectively.19 Normally, the protonated nitrogen is favorably originated from the imine groups in the PANI chains because the pKa of the imine group is 5.5 compared to 2.5 for the amine group.18 Thus, the lower intensity ratio of the quinoid band relative to the benzenoid band in PANI indicates the relatively higher doping level is obtained.20 The high resolution XPS spectra of pure PANI synthesized with Cr(VI) as oxidant, Fig. S3C,† indicate that the Cr(VI) has been reduced to Cr(III) after oxidation of aniline to form PANI. Fig. 1c shows the Raman spectra of the as-received MWNTs, T5, T205 and TA05 nanocomposites with 785 nm laser excitation. In the typical Raman spectrum of the MWNTs, the G-band (E2g symmetry, graphite mode) appearing at around 1580 cm−1 is due to the sp2 carbon networks,21 and the characteristic defect induced D band at around 1300 cm−1 arises from the sp3 carbon networks.22 The integrated intensity ratio of ID/IG for the D band and G band has been used to characterize the defect quantity in graphitic materials.21 The shifts of the G-band from 1584 cm−1 of the as-received MWNTs to 1580, 1578 and 1574 cm−1 for T5, T205 and TA05 indicate a strong interaction between the MWNTs and the hosting PANI.23,24 Due to the limited available information about pure PANI synthesized by Cr(VI) from the Raman spectra with 785 nm laser excitation, Fig. S3D,† the Raman spectra of pure PANI synthesized by Cr(VI) and T10 samples with 633 nm laser excitation were recorded, Fig. 1d. The observed four characteristic bands at 1170, 1347, 1476 and 1592 cm−1 for pure PANI synthesized by Cr(VI) correspond to the C–H in-plane bending deformation, C
C stretching vibrations of the quinoid and benzenoid rings in PANI, respectively.19 Normally, the protonated nitrogen is favorably originated from the imine groups in the PANI chains because the pKa of the imine group is 5.5 compared to 2.5 for the amine group.18 Thus, the lower intensity ratio of the quinoid band relative to the benzenoid band in PANI indicates the relatively higher doping level is obtained.20 The high resolution XPS spectra of pure PANI synthesized with Cr(VI) as oxidant, Fig. S3C,† indicate that the Cr(VI) has been reduced to Cr(III) after oxidation of aniline to form PANI. Fig. 1c shows the Raman spectra of the as-received MWNTs, T5, T205 and TA05 nanocomposites with 785 nm laser excitation. In the typical Raman spectrum of the MWNTs, the G-band (E2g symmetry, graphite mode) appearing at around 1580 cm−1 is due to the sp2 carbon networks,21 and the characteristic defect induced D band at around 1300 cm−1 arises from the sp3 carbon networks.22 The integrated intensity ratio of ID/IG for the D band and G band has been used to characterize the defect quantity in graphitic materials.21 The shifts of the G-band from 1584 cm−1 of the as-received MWNTs to 1580, 1578 and 1574 cm−1 for T5, T205 and TA05 indicate a strong interaction between the MWNTs and the hosting PANI.23,24 Due to the limited available information about pure PANI synthesized by Cr(VI) from the Raman spectra with 785 nm laser excitation, Fig. S3D,† the Raman spectra of pure PANI synthesized by Cr(VI) and T10 samples with 633 nm laser excitation were recorded, Fig. 1d. The observed four characteristic bands at 1170, 1347, 1476 and 1592 cm−1 for pure PANI synthesized by Cr(VI) correspond to the C–H in-plane bending deformation, C![[double bond, length as m-dash]](https://www.rsc.org/images/entities/char_e001.gif) N stretching deformation, C–C and C
N stretching deformation, C–C and C![[double bond, length as m-dash]](https://www.rsc.org/images/entities/char_e001.gif) C stretching of the benzoid rings of PANI, respectively.25 In the Raman spectrum of the T10 nanocomposites, the observed bands at 1159 and 1463 cm−1 correspond to the characteristic peaks of PANI, and the shift indicates an interaction between the MWNTs and the hosting PANI. The strong bands at 1328 and 1580 cm−1 are attributed to the D band and G band of MWNTs, which are overlapped with the PANI bands of 1347 and 1592 cm−1.
C stretching of the benzoid rings of PANI, respectively.25 In the Raman spectrum of the T10 nanocomposites, the observed bands at 1159 and 1463 cm−1 correspond to the characteristic peaks of PANI, and the shift indicates an interaction between the MWNTs and the hosting PANI. The strong bands at 1328 and 1580 cm−1 are attributed to the D band and G band of MWNTs, which are overlapped with the PANI bands of 1347 and 1592 cm−1.
Fig. 2 depicts the real permittivity (ε′), imaginary permittivity (ε′′) and dielectric loss (tan![[thin space (1/6-em)]](https://www.rsc.org/images/entities/char_2009.gif) δ, where tan
δ, where tan![[thin space (1/6-em)]](https://www.rsc.org/images/entities/char_2009.gif) δ = ε′′/ε′) as a function of the frequency for pure PANI synthesized by Cr(VI) and its MWNTs nanocomposites at room temperature. All the samples show a frequency dependent permittivity. Pure PANI synthesized by Cr(VI) shows a positive ε′ value (from 4875 to 78) within the measured frequency range (20–2 × 10⁶ Hz) and the ε′ decreases with increasing frequency, Fig. 2a. The high positive ε′ indicates that the mobile charges are no longer free and localized in each metallic island (the metallic island is a well-ordered polymer chain region caused by the oxidation or protonation. Generally, the emeraldine salt form of PANI is inherently inhomogeneous and phase segregates into oxidized or protonated metallic islands embedded in a sea of insulating material26).27 The charges could not hop to the vicinity of metallic regions, but rather remain confined to the domain of metallic islands.27 For the T205 and TA05 samples, the ε′ shows large negative values on the order of −105 starting from 20 to 2 × 10³ Hz and it becomes positive at frequencies higher than 2 × 10³ Hz. The inset of Fig. 2a shows the relatively stable positive ε′ value within the frequency range from 7 × 10⁴ to 2 × 10⁶ Hz. The frequency switch from negative to positive at around 2 × 10³ Hz for T205 and 1 × 10³ Hz for TA05 is observed. This switching permittivity from negative to positive is also reported in WO3/PANI nanocomposites and is tuned by controlling the loading and morphology of the WO3 nanostructures.17 The ε′′ values of pure PANI synthesized by Cr(VI), T205 and TA05 samples, Fig. 2c, exhibit a similar trend as ε′. Pure PANI synthesized by Cr(VI) exhibits a positive ε′′ values (from 6.39 × 10⁶ to 85.87), which decreases with increasing frequency. A switching frequency of ε′′ from negative to positive is also observed in the T205 and TA05 samples. Fig. 2e shows a frequency dependent tan
δ = ε′′/ε′) as a function of the frequency for pure PANI synthesized by Cr(VI) and its MWNTs nanocomposites at room temperature. All the samples show a frequency dependent permittivity. Pure PANI synthesized by Cr(VI) shows a positive ε′ value (from 4875 to 78) within the measured frequency range (20–2 × 10⁶ Hz) and the ε′ decreases with increasing frequency, Fig. 2a. The high positive ε′ indicates that the mobile charges are no longer free and localized in each metallic island (the metallic island is a well-ordered polymer chain region caused by the oxidation or protonation. Generally, the emeraldine salt form of PANI is inherently inhomogeneous and phase segregates into oxidized or protonated metallic islands embedded in a sea of insulating material26).27 The charges could not hop to the vicinity of metallic regions, but rather remain confined to the domain of metallic islands.27 For the T205 and TA05 samples, the ε′ shows large negative values on the order of −105 starting from 20 to 2 × 10³ Hz and it becomes positive at frequencies higher than 2 × 10³ Hz. The inset of Fig. 2a shows the relatively stable positive ε′ value within the frequency range from 7 × 10⁴ to 2 × 10⁶ Hz. The frequency switch from negative to positive at around 2 × 10³ Hz for T205 and 1 × 10³ Hz for TA05 is observed. This switching permittivity from negative to positive is also reported in WO3/PANI nanocomposites and is tuned by controlling the loading and morphology of the WO3 nanostructures.17 The ε′′ values of pure PANI synthesized by Cr(VI), T205 and TA05 samples, Fig. 2c, exhibit a similar trend as ε′. Pure PANI synthesized by Cr(VI) exhibits a positive ε′′ values (from 6.39 × 10⁶ to 85.87), which decreases with increasing frequency. A switching frequency of ε′′ from negative to positive is also observed in the T205 and TA05 samples. Fig. 2e shows a frequency dependent tan![[thin space (1/6-em)]](https://www.rsc.org/images/entities/char_2009.gif) δ for pure PANI synthesized by Cr(VI), T205 and TA05 samples. The tan
δ for pure PANI synthesized by Cr(VI), T205 and TA05 samples. The tan![[thin space (1/6-em)]](https://www.rsc.org/images/entities/char_2009.gif) δ is observed to decrease with increasing frequency for pure PANI synthesized by Cr(VI). However, for the T205 and TA05 samples, the tan
δ is observed to decrease with increasing frequency for pure PANI synthesized by Cr(VI). However, for the T205 and TA05 samples, the tan![[thin space (1/6-em)]](https://www.rsc.org/images/entities/char_2009.gif) δ increases with increasing frequency from 20 to 2 × 10³ and 1 × 10³ Hz, respectively, and then decreases with increasing frequency further. The appearance of the peak in the tan
δ increases with increasing frequency from 20 to 2 × 10³ and 1 × 10³ Hz, respectively, and then decreases with increasing frequency further. The appearance of the peak in the tan![[thin space (1/6-em)]](https://www.rsc.org/images/entities/char_2009.gif) δ curve of T205 and TA05 samples is related to the switching of permittivity from negative to positive, which is also observed in polypyrrole/graphene nanocomposites.13
δ curve of T205 and TA05 samples is related to the switching of permittivity from negative to positive, which is also observed in polypyrrole/graphene nanocomposites.13
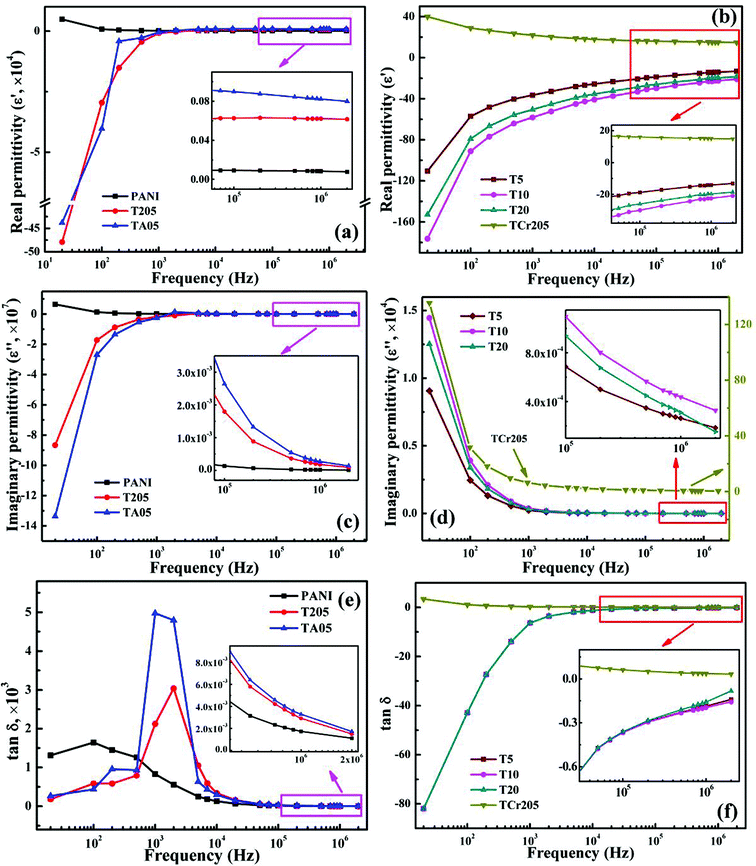 | ||
Fig. 2 (a and b) Real permittivity (ε′), (c and d) imaginary permittivity (ε′′) and (e and f) dielectric loss tangent (tan![[thin space (1/6-em)]](https://www.rsc.org/images/entities/char_2009.gif) δ) as a function of frequency for PANI and MWNTs/PANI nanocomposites. δ) as a function of frequency for PANI and MWNTs/PANI nanocomposites. | ||
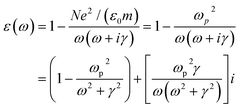
Compared with T205 and TA05 samples, T5, T10 and T20 exhibit a negative ε′ value, which increases with increasing frequency and the TCr205 shows a very small positive ε′ value (<50), which decreases with increasing frequency from 20 to 2 × 10⁶ Hz at room temperature, Fig. 2b. A negative ε′ indicates the intrinsic metallic state and disordered motion of the charge carriers along the conjugated polymer backbone,28 representing the charge delocalization in a macroscopic scale.6 It is worth noting that the T10 sample has the lowest negative ε′ value compared with T5 and T20, providing the highest level of charge delocalization for PANI,29 which is also observed in the PANI/Fe3O4 nanocomposite system with a Fe3O4 loading of 16.67 wt%.6 The difference of the observed negative permittivity in the MWNTs/PANI at different ratios of MWNTs is also observed in WO3/PANI,19 BaTiO3/PANI,8 and Fe3O4/PANI nanocomposites.6 However, the effect of the nanofiller loading on the negative permittivity is still not clear yet. The ε′ values for T5, T10 and T20 increase with increasing frequency, which is due to the increased charge carrier polarization.30 The ε′′ significantly decreases with increasing frequency from 20 to 2 × 10⁶ Hz, Fig. 2d. The TCr205 sample shows a small positive ε′′ value from 135 to 0.5, whereas the ε′′ values of the samples T5, T10 and T20 show a large positive value with a magnitude ranging from 105 to 101 within the frequency range from 20 to 2 × 10⁶ Hz, Fig. 2d. Generally, the negative permittivity is often explained by the introduced Drude model, which describes the existence and properties of surface plasmons illustrates the frequency dependent permittivity between the external dielectric medium and the surface.31 In this Drude model, the permittivity is dominated by plasma-like resonance of the free electrons in a metal, as shown in eqn (1):16,32
 | (1) |
Fig. 2f depicts the frequency dependent tan![[thin space (1/6-em)]](https://www.rsc.org/images/entities/char_2009.gif) δ for the T5, T10, T20 and TCr205 samples. The negative tan
δ for the T5, T10, T20 and TCr205 samples. The negative tan![[thin space (1/6-em)]](https://www.rsc.org/images/entities/char_2009.gif) δ of the T5, T10 and T20 samples increases with increasing frequency and the magnitude is ranging from −102 to −10−2 within the frequency range from 20 to 2 × 10⁶ Hz. Interestingly, the T5, T10 and T20 samples are observed to show similar tan
δ of the T5, T10 and T20 samples increases with increasing frequency and the magnitude is ranging from −102 to −10−2 within the frequency range from 20 to 2 × 10⁶ Hz. Interestingly, the T5, T10 and T20 samples are observed to show similar tan![[thin space (1/6-em)]](https://www.rsc.org/images/entities/char_2009.gif) δ values, indicating that these three samples have similar energy loss behavior. However, the tan
δ values, indicating that these three samples have similar energy loss behavior. However, the tan![[thin space (1/6-em)]](https://www.rsc.org/images/entities/char_2009.gif) δ of the TCr205 sample decreases with increasing frequency and shows a very small positive value with a magnitude ranging from 101 to 10−2 within the frequency range from 20 to 2 × 10⁶ Hz. Pure PANI synthesized by Cr(VI), T205 and TA05 samples also show a low positive tan
δ of the TCr205 sample decreases with increasing frequency and shows a very small positive value with a magnitude ranging from 101 to 10−2 within the frequency range from 20 to 2 × 10⁶ Hz. Pure PANI synthesized by Cr(VI), T205 and TA05 samples also show a low positive tan![[thin space (1/6-em)]](https://www.rsc.org/images/entities/char_2009.gif) δ value with a magnitude ranging from 100 to 103 within the measured frequency range, Fig. 2e. The low dielectric loss materials can be applied in radio-frequency and microwave communications.35
δ value with a magnitude ranging from 100 to 103 within the measured frequency range, Fig. 2e. The low dielectric loss materials can be applied in radio-frequency and microwave communications.35
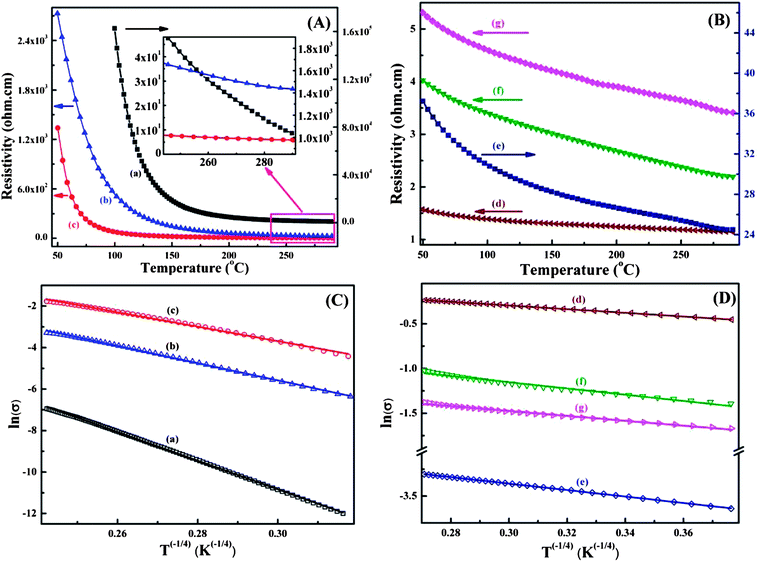
Fig. 3A and B shows the resistivity as a function of temperature for the as-received MWNTs, pure PANI synthesized by Cr(VI) and MWNTs/PANI nanocomposites. Due to the insulating nature of TCr205, its resistivity is beyond the scope of the used instrument. Typically, the resistivity decreases with increasing temperature for all the synthesized nanocomposites, indicating semiconducting behavior within the measured temperature scale (50–290 K).36 In this study, the as-received MWNTs show semiconducting behavior, Fig. 3B-d, and the resistivity is decreased from 1.57 Ω cm at 50 K to 1.14 Ω cm at 290 K. The resistivities of TA05 and T205 are lower than that of pure PANI at temperatures from 50 to 290 K and the value varies from 101 to 103 Ω cm, Fig. 3A-b and c. The resistivities of TA05 and T205 at room temperature are about 26.7 and 5.8 Ω cm. Compared with TA05 and T205 oxidized by APS, very high electrical conductivity (i.e. low resistivity) is observed in the T5, T10 and T20 nanocomposites oxidized by Cr(VI), Fig. 3B-e, g and f, respectively. For T5, the resistivity is 37.2 Ω cm at 50 K and 24.5 Ω cm at room temperature; and for T10 and T20, the resistivity is changed from 5.3 (50 K) to 3.4 Ω cm (room temperature) and from 4.0 (50 K) to 2.2 Ω cm (room temperature), respectively, Fig. 3B-e, g and f. Generally, the conductive PANI possesses electrical conductivity (σ) ranging from 10−2 to 102 S cm−1 at room temperature.37 In this work, pure PANI synthesized by Cr(VI) has very high resistivity from 103 to 105 Ω cm within the measured temperature scale. The room temperature resistivity is about 1.04 × 10³ Ω cm, Fig. 3A-a, which is one order of magnitude higher than that of PANI synthesized by APS (2.06 × 10² Ω cm).6 Particularly, previous research has shown that CNTs could be well dispersed in aniline via the formation of a donor–acceptor complex.38 The MWNTs are very good electron acceptors and aniline is a very good electron donor. The interaction between amine groups of aniline and MWNTs renders the MWNTs as conducting bridges, which connect the PANI conducting domains for charge transport causing the observed increased conductivity in the nanocomposites.39
The electrical conduction mechanism of the synthesized MWNTs/PANI nanocomposites was investigated by a Mott variable range hopping (VRH) approach, which is presented in eqn (2):6
 | (2) |
| T0 = 24/[πkBN(EF)a03] | (3) |
| Sample | T 0 (K) | σ 0 (S cm−1) |
|---|---|---|
| As-received MWNTs | 17.75 | 1.378 |
| PANI | 2.20 × 10⁷ | 17![[thin space (1/6-em)]](https://www.rsc.org/images/entities/char_2009.gif) 331 331 |
| T5 | 78.20 | 0.083 |
| T10 | 68.12 | 0.729 |
| T20 | 41.10 | 0.485 |
| T205 | 1.61 × 10⁶ | 1121 |
| TA05 | 3.10 × 10⁶ | 1112 |
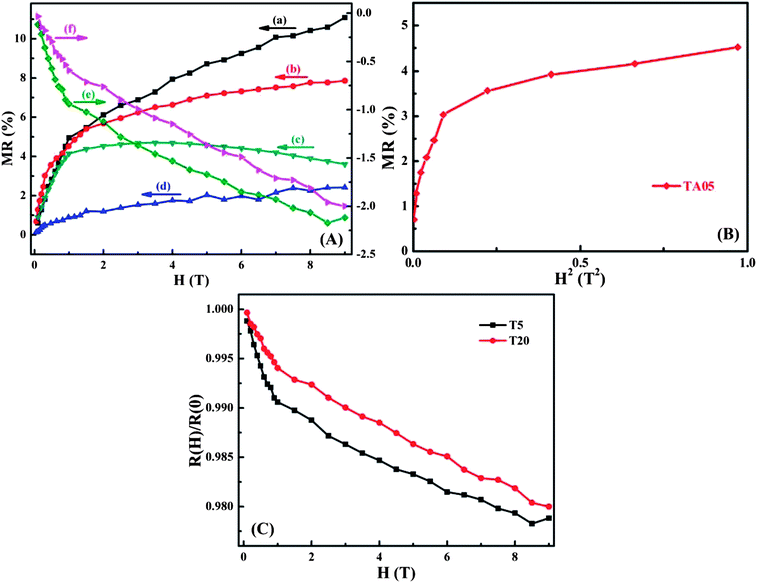
Fig. 4A displays the magnetic field (H) dependent magnetoresistance (MR) for the as-received MWNTs, pure PANI synthesized by Cr(VI) and MWNTs/PANI nanocomposites at room temperature. The MR is defined as the ratio in eqn (4):
| MR = ΔR/R = [R(H) − R(0)]/R(0) | (4) |
Generally, the MR of highly disordered localized systems in the VRH regime can be described using the orbital magnetoconductivity theory (also called forward interference model) and wave-function shrinkage model.43 In the temperature dependent resistivity section, pure PANI synthesized by Cr(VI) and its MWNTs nanocomposites are confirmed to be disordered systems in the 3-dimensional VRH regime. Therefore, these two numerical models can be applied to pure PANI synthesized by Cr(VI) and its MWNT nanocomposites. In the wave-function shrinkage model, the contraction of the electronic wave-function at impurity centers in a magnetic field was considered and the R(H,T)/R(0,T) can be expressed according to eqn (5):44
| R(H,T)/R(0,T) = exp{ξC(0)[ξC(H)/ξC(0) − 1]} | (5) |
| PC = 6ℏ/[ea02(T0/T)1/4] | (6) |
 | (7) |
 | (8) |
 . For example, the representative curve MR ∼ H2 for the TA05 sample is shown in Fig. 4B. The slope of curve MR ∼ H2 for the TA05 sample becomes lower and lower with increasing H2, which means that the localization length a0 will be reduced as H increases. Meanwhile, the localization length a0 can be calculated by using eqn (9) from T0, positive MR value and H:
 | (9) |
| N(EF) = 24/[πkBT0a03] | (10) |
| Sample | Parameter | Magnetic field H (T) | ||
|---|---|---|---|---|
| 0.1 | 0.5 | 1.0 | ||
| PANI synthesized by Cr(VI) | a 0 (nm) | 62.1 | 25.2 | 15.7 |
| N(EF) (J cm3)−1 | 1.1 × 1032 | 1.6 × 1033 | 6.5 × 1033 | |
| R hop (μm) | 0.387 | 0.157 | 0.098 | |
| T205 | a 0 (nm) | 102.6 | 46.9 | 34.0 |
| N(EF) (J cm3)−1 | 3.2 × 1032 | 3.3 × 1033 | 8.7 × 1033 | |
| R hop (nm) | 0.332 | 0.152 | 0.110 | |
| TA05 | a 0 (nm) | 96.1 | 39.7 | 27.6 |
| N(EF) (J cm3)−1 | 2.0 × 1032 | 2.9 × 1033 | 8.5 × 1033 | |
| R hop (μm) | 0.366 | 0.151 | 0.105 | |
The calculated N(EF) values are also listed in Table 2. Normally, the hopping probability between the localized states increases with increasing N(EF),46 which means that the higher the N(EF), the larger the hopping probability of the charge carriers will be.7 The average hopping length Rhop can be obtained by using eqn (11):
| Rhop = (3/8)(T0/T)1/4a0 | (11) |
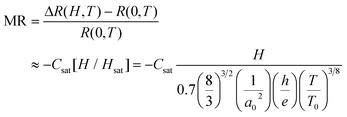
The orbital magnetoconductivity theory is normally used to predict the negative MR values. The effect of interference among various hopping paths was considered in this theory. These hopping paths include sequence of scattering of tunneling charge carriers by the impurities located within a cigar-shaped domain of length Rhop (hopping length) and width (Rhopa0)1/2.44 The ratio R(H,T)/R(0,T) caused by the interference effects is described by empirical eqn (12), which neglects the quadratic term in H:47–49
| R(H,T)/R(0,T) ≈ 1/{1 + Csat[H/Hsat]/[1 + H/Hsat]} | (12) |
For the Mott VRH electrical conduction mechanism is given by eqn (13):7
 | (13) |
| R(H,T)/R(0,T) ≈ 1 − Csat[H/Hsat] | (14) |
 | (15) |
In conclusion, MWNTs/PANI nanocomposites have been synthesized by using the SIP method with Cr(VI) as the oxidant and compared with MWNTs/PANI nanocomposites prepared with APS as oxidant. The obtained as-received MWNTs, pure PANI synthesized by Cr(VI) and MWNTs/PANI nanocomposites are observed to follow a quasi-3-d VRH electrical conduction mechanism. Negative permittivity is observed in the MWNTs/PANI nanocomposites synthesized by Cr(VI), however, a switching frequency, in which the permittivity changes from negative to positive, is observed in the MWNTs/PANI nanocomposites synthesized by APS. A negative GMR around −2% is observed in the MWNTs/PANI nanocomposites synthesized by Cr(VI), a positive GMR about 2.4% is observed in the as-received MWNTs, around 4% for pure PANI synthesized by Cr(VI), 7.9 and 11% in the TA05 and T205 nanocomposites synthesized by APS. The observed positive and negative GMR effects have been well explained by the calculated localization length (a0) based on the wave-function shrinkage model and orbital magnetoconductivity theory, respectively. The obtained a0 for the negative MR value in the MWNT/PANI nanocomposites with Cr(VI) as oxidant is larger than that of the positive MR value in the nanocomposites T205 formed with further APS as oxidant and nanocomposites TA05 formed with APS as oxidant at the same magnetic field.
Acknowledgements
This project is financially supported by the National Science Foundation Nanoscale Interdisciplinary Research Team, and Materials Processing and Manufacturing (CMMI 10-30755). D. P. Young acknowledges support from the NSF under grant no. DMR 13–06392. The Raman spectra were collected at the Materials Characterization Facility at Texas A&M University by Dr Amanda Young. H. Gu acknowledges the support from China Scholarship Council (CSC) program.Notes and references
- M. N. Baibich, J. M. Broto, A. Fert, F. N. Van Dau, F. Petroff, P. Etienne, G. Creuzet, A. Friederich and J. Chazelas, Phys. Rev. Lett., 1988, 61, 2472–2475 CrossRef CAS
.
- L. Bogani and W. Wernsdorfer, Nat. Mater., 2008, 7, 179–186 CrossRef CAS PubMed
.
- P. Gao, D. Beckmann, H. N. Tsao, X. Feng, V. Enkelmann, M. Baumgarten, W. Pisula and K. Müllen, Adv. Mater., 2009, 21, 213–216 CrossRef CAS
.
- V. Y. Aristov, O. V. Molodtsova, Y. A. Ossipyan, B. P. Doyle, S. Nannarone and M. Knupfer, Org. Electron., 2009, 10, 8–11 CrossRef CAS PubMed
.
- Y. Ohno, K. Narumi, K. Maehashi, K. Inoue and K. Matsumoto, J. Phys. Conf. Ser., 2006, 38, 57–60 CrossRef CAS
.
- H. Gu, Y. Huang, X. Zhang, Q. Wang, J. Zhu, L. Shao, N. Haldolaarachchige, D. P. Young, S. Wei and Z. Guo, Polymer, 2012, 53, 801–809 CrossRef CAS PubMed
.
- H. Gu, J. Guo, X. Zhang, Q. He, Y. Huang, H. A. Colorado, N. S. Haldolaarachchige, H. L. Xin, D. P. Young, S. Wei and Z. Guo, J. Phys. Chem. C, 2013, 117, 6426–6436 CAS
.
- X. Zhang, S. Wei, N. Haldolaarachchige, H. A. Colorado, Z. Luo, D. P. Young and Z. Guo, J. Phys. Chem. C, 2012, 116, 15731–15740 CAS
.
- J. Zhu, H. Gu, Z. Luo, N. Haldolaarachige, D. P. Young, S. Wei and Z. Guo, Langmuir, 2012, 28, 10246–10255 CrossRef CAS PubMed
.
- S.-B. Yoon, E.-H. Yoon and K.-B. Kim, J. Power Sources, 2011, 196, 10791–10797 CrossRef CAS PubMed
.
- T. Yang, N. Zhou, Y. Zhang, W. Zhang, K. Jiao and G. Li, Biosens. Bioelectron., 2009, 24, 2165–2170 CrossRef CAS PubMed
.
- M. U. Jurczyk, A. Kumar, S. Srinivasan and E. Stefanakos, Int. J. Hydrogen Energy, 2007, 32, 1010–1015 CrossRef CAS PubMed
.
- H. Gu, S. Tadakamalla, X. Zhang, Y.-D. Huang, Y. Jiang, H. A. Colorado, Z. Luo, S. Wei and Z. Guo, J. Mater. Chem. C, 2013, 1, 729–743 RSC
.
- R. W. Ziolkowski and E. Heyman, Phys. Rev. E: Stat., Nonlinear, Soft Matter Phys., 2001, 64, 056625 CrossRef CAS
.
- D. R. Smith, J. B. Pendry and M. C. K. Wiltshire, Science, 2004, 305, 788–792 CrossRef CAS PubMed
.
- H. Gu, J. Guo, S. Wei and Z. Guo, J. Appl. Polym. Sci., 2013, 130(4), 2238–2244 CrossRef CAS
.
- J. Zhu, S. Wei, L. Zhang, Y. Mao, J. Ryu, P. Mavinakuli, A. B. Karki, D. P. Young and Z. Guo, J. Phys. Chem. C, 2010, 114, 16335–16342 CAS
.
- H. Gu, S. Rapole, J. Sharma, Y. Huang, D. Cao, H. A. Colorado, Z. Luo, N. Haldolaarachchige, D. P. Young, S. Wei and Z. Guo, RSC Adv., 2012, 2, 11007–11018 RSC
.
- J. Zhu, S. Wei, L. Zhang, Y. Mao, J. Ryu, A. B. Karki, D. P. Young and Z. Guo, J. Mater. Chem., 2011, 21, 342–348 RSC
.
- M. G. Han, S. K. Cho, S. G. Oh and S. S. Im, Synth. Met., 2002, 126, 53–60 CrossRef CAS
.
- Y. C. Jung, H. H. Kim, Y. A. Kim, J. H. Kim, J. W. Cho, M. Endo and M. S. Dresselhaus, Macromolecules, 2010, 43, 6106–6112 CrossRef CAS
.
- D. McIntosh, V. N. Khabashesku and E. V. Barrera, J. Phys. Chem. C, 2007, 111, 1592–1600 CAS
.
- M. L. Shofner, V. N. Khabashesku and E. V. Barrera, Chem. Mater., 2006, 18, 906–913 CrossRef CAS
.
- D. McIntosh, V. N. Khabashesku and E. V. Barrera, Chem. Mater., 2006, 18, 4561–4569 CrossRef CAS
.
- J. Zhu, M. Chen, H. Qu, X. Zhang, H. Wei, Z. Luo, H. A. Colorado, S. Wei and Z. Guo, Polymer, 2012, 53, 5953–5964 CrossRef CAS PubMed
.
- H. L. Wu and P. Phillips, Phys. Rev. Lett., 1991, 66, 1366–1369 CrossRef CAS
.
- J. Joo, E. J. Oh, G. Min, A. G. MacDiarmid and A. J. Epstein, Synth. Met., 1995, 69, 251–254 CrossRef CAS
; J. Zhu, X. Zhang, N. Haldolaarachchige, Q. Wang, Z. Luo, J. Ryu, D. P. Young, S. Wei and Z. Guo, J. Mater. Chem., 2012, 22, 4996–5005 RSC
; X. Zhang, J. Zhu, N. Haldolaarachchige, J. Ryu, D. P. Young, S. Wei and Z. Guo, Polymer, 2012, 53, 2109–2120 CrossRef PubMed
.
- C. D. Liu, S. N. Lee, C. H. Ho, J. L. Han and K. Hsieh, J. Phys. Chem. C, 2008, 112, 15956–15960 CAS
.
- A. K. Singh, T. C. Goel, R. G. Mendiratta, O. P. Thakur and C. Prakash, J. Appl. Phys., 2002, 91, 6626–6629 CrossRef CAS
.
- J. Homola, Chem. Rev., 2008, 108, 462–493 CrossRef CAS PubMed
.
- J. B. Pendry, A. J. Holden, W. J. Stewart and I. Youngs, Phys. Rev. Lett., 1996, 76, 4773–4776 CrossRef CAS
.
- M. Rashidi-Huyeh and B. Palpant, Phys. Rev. B: Condens. Matter Mater. Phys., 2006, 74, 075405 CrossRef
.
-
F. Capolino, Theory and Phenomena of Metamaterials, CRC Press, 2009 Search PubMed
.
- N. M. Alford and S. J. Penn, J. Appl. Phys., 1996, 80, 5895–5898 CrossRef CAS
.
- S. Chakrabarti, D. Banerjee and R. Bhattacharyya, J. Phys. Chem. B, 2002, 106, 3061–3064 CrossRef CAS
.
- J. Stejskal, I. Sapurina, M. Trchová, J. Prokeš, I. Křivka and E. Tobolková, Macromolecules, 1998, 31, 2218–2222 CrossRef CAS
.
- Y. Sun, S. R. Wilson and D. I. Schuster, J. Am. Chem. Soc., 2001, 123, 5348–5349 CrossRef CAS
.
- X.-h. Li, B. Wu, J.-e. Huang, J. Zhang, Z.-f. Liu and H.-l. Li, Carbon, 2003, 41, 1670–1673 CrossRef CAS
.
- L. Zhang and Z.-J. Tang, Phys. Rev. B: Condens. Matter Mater. Phys., 2004, 70, 174306 CrossRef
.
- J. Zhu, S. Wei, L. Zhang, Y. Mao, J. Ryu, A. B. Karki, D. P. Young and Z. Guo, J. Mater. Chem., 2011, 21, 342–348 RSC
.
- M. Aggarwal, S. Khan, M. Husain, T. Ming, M. Tsai, T. Perng and Z. Khan, Eur. Phys. J. B, 2007, 60, 319–324 CrossRef CAS
.
- A. Ozbay, E. R. Nowak, Z. G. Yu, W. Chu, S. Yijian, S. Krishnamurthy, Z. Tang and N. Newman, Appl. Phys. Lett., 2009, 95, 232507 CrossRef
.
- H. Gu, X. Zhang, H. Wei, Y. Huang, S. Wei and Z. Guo, Chem. Soc. Rev., 2013, 42, 5907–5943 RSC
.
- T.-I. Su, C.-R. Wang, S.-T. Lin and R. Rosenbaum, Phys. Rev. B: Condens. Matter Mater. Phys., 2002, 66, 054438 CrossRef
.
- H. Gu, J. Guo, H. We, Y. Huang, C. Zhao, Y. Li, Q. Wu, N. Haldolaarachchige, D. P. Young, S. Wei and Z. Guo, Phys. Chem. Chem. Phys., 2013, 15, 10866–10875 RSC
.
- K. Dutta and S. K. De, Phys. Lett. A, 2007, 361, 141–145 CrossRef CAS PubMed
.
- U. Sivan, O. Entin-Wohlman and Y. Imry, Phys. Rev. Lett., 1988, 60, 1566–1569 CrossRef CAS
.
- R. Rosenbaum, A. Milner, S. Hannahs, T. Murphy, E. Palm and B. Brandt, Phys. B, 2001, 294–295, 340–342 CrossRef
.
- O. Entin-Wohlman, Y. Imry and U. Sivan, Phys. Rev. B: Condens. Matter Mater. Phys., 1989, 40, 8342–8348 CrossRef
.
- J. Guo, H. Gu, H. Wei, Q. Zhang, N. S. Haldolaarachchige, Y. Li, D. P. Young, S. Wei and Z. Guo, J. Phys. Chem. C, 2013, 117, 10191–10202 CAS
.
Footnote |
| † Electronic supplementary information (ESI) available. See DOI: 10.1039/c3nr04152b |
| This journal is © The Royal Society of Chemistry 2014 |

