Effect of chemically modified graphene oxide on the phase separation behaviour and properties of an epoxy/polyetherimide binary system
Guijun
Yu
and
Peiyi
Wu
*
State Key Laboratory of Molecular Engineering of Polymer, Department of Macromolecular Science and Laboratory of Advanced Materials, Fudan University, Shanghai 200433, People's Republic of China. E-mail: peiyiwu@fudan.edu.cn
First published on 31st July 2013
Abstract
In this study, methylenedianiline-modified graphene oxide (GO-MDA) was incorporated into the diglycidyl ether of a bisphenol A/polyetherimide (DGEBA/PEI) binary system to regulate the Cure-Reaction Induced Phase Separation (CRIPS) behaviour. After the cure-reaction was completed, the fractured surfaces of DGEBA/PEI/GO-MDA composites were etched and observed by SEM measurement to determine the final morphology. Rheological and DSC measurements were used to analyze the effect of GO-MDA on the CRIPS behaviour of the composites. It was found that the CRIPS behaviour of the DGEBA/PEI system, with or without GO-MDA, all followed a spinodal decomposition mechanism. The introduction of GO-MDA increased the complex viscosity and cure-reaction rate of the DGEBA/PEI/GO-MDA composites, which significantly suppressed the development of phase separation and helped freeze the final morphology of the composites at an earlier stage of co-continuous structure. The toughness and modulus of the composites were improved by adding GO-MDA according to DMA measurement and tensile tests, while TGA results showed little decrease in the thermal stability of the composites.
Introduction
Epoxy resin is a kind of thermosetting polymer with excellent chemical and corrosion resistance, outstanding adhesion properties, good dimensional stability and low cost. It's used in many industrial fields, such as aerospace, and automotive electron devices etc. However, epoxy is usually brittle and its low impact resistance greatly limits its application. In order to overcome this weakness, many studies have been conducted to toughen epoxy resins by introducing rubbers1–3 or thermoplastic polymers, such as polysulfone,4 polyethersulfone,5,6 polyetherimide,7,8 polyphenylene oxide,9 polyetheretherketone,10,11 polyamic acid12etc. into the epoxy matrices. However, incorporation of rubber usually leads to a decrease of the glass transition temperature (Tg) of the cured epoxy resins, which is bad for the mechanical and thermal properties of composites. In contrast, modifying epoxy resins with thermoplastic polymers with a high Tg and high modulus, like polyetherimide, can increase the toughness without any significant loss of Tg or other properties.Usually, the epoxy/thermoplastic polymer (EP/TP) binary system is homogeneous before curing. Due to the cure-reaction, the molar mass of epoxy increases and thermoplastic polymer is no longer miscible with the cross-liked epoxy, then phase separation appears and will continuously develop until the gel point is reached. This kind of phase separation is defined as Cure-Reaction Induced Phase Separation (CRIPS).13,14 It is well-known that the mechanical properties of the EP/TP binary system are determined by its final phase separation morphology. The toughness of the epoxy resin is significantly improved only when the co-continuous or even the inverted structure are generated.15,16 Thus, many studies of the mechanism and kinetics of the CRIPS of EP/TP binary systems have been conducted in order to understand theoretically and then try to obtain the preferred morphology practically.4,5,9,17–21 Among this research, two possible mechanisms were proposed to describe the process of CRIPS, one is the Spinodal Decomposition (SD) mechanism and another is the Nucleus Growth (NG) mechanism. Which mechanism CRIPS will proceed by depends on many factors, such as curing temperature,4,22 the concentration of thermoplastic polymer7,9,19,22 and the curing agent.20,22 The SD mechanism is more prevalent and preferred.
Recently, many different organic or inorganic fillers have been introduced into EP/TP binary systems to control the CRIPS, such as silica particles,23,24aluminum nitridenanoparticles,25 organoclay,26,27 titanium dioxide,28 and mesoscopic fillers.29 The regulating effect is remarkable, especially when the fillers interact well with both the epoxy resin and the thermoplastic polymer.29 What's more, the properties of the composites are usually enhanced at the same time. To the best of our knowledge, graphene or its derivatives haven't been applied to an EP/TP binary system.
Graphene sheets (GS), a two-dimensional single layer of sp2-bonded carbons, is a kind of carbon material that has a large theoretical specific surface area, in addition to extraordinary mechanical, electronic and thermal properties. Graphene oxide (GO) is the oxidised state of GS, with hydroxyl and epoxide functional groups on the basal plane, and carbonyl and carboxyl groups located at the sheet edges30,31 GO can disperse well in many different kinds of solvents, like water, DMF, NMP, THF etc., and especially well in water.32 Due to the characteristics presented above, GO is often used as a precursor in the chemical modification of GS, through which GS can have good dispersion and compatibility with the polymer matrix and then transform its excellent properties to the matrix when preparing GS based composites.31,33
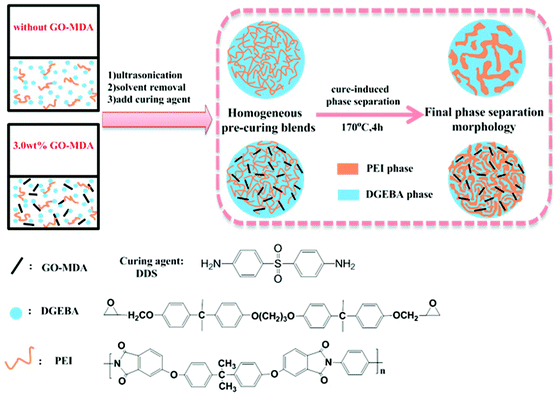
In this paper, polyetherimide (PEI) was chosen as the thermoplastic polymer, diglycidyl ether of bisphenol A (DGEBA) as the epoxy monomer, while 4,4′-diaminodiphenylsulfone (DDS) acted as the curing agent. Methylenedianiline-modified graphene oxide (GO-MDA) was incorporated into a DGEBA/PEI binary system as the filler. The final morphology of the DGEBA/PEI/GO-MDA composites and the effect of GO-MDA on CRIPS behaviour were discussed. In addition, the mechanical and thermal properties of the composites were also investigated.
Experimental
Materials
Graphite powders were purchased from Qingdao HuaTai Co. Ltd. Sulfuric acid (H2SO4, 98%), fuming nitric acid (HNO3, >90%), potassium permanganate (KMnO4), sodium nitrate (NaNO3) and hydrogen peroxide (H2O2, 30%) were purchased from Sinopharm Chemical Reagent Co. Ltd. Methylenedianiline (MDA, 99%), N-hydroxysuccinimide (NHS) and N-(3-dimethylamino-propyl)-N′-ethylcarbodiimide hydrochloride (EDC·HCl) were purchased from Aladdin Chemistry Co. Ltd.Diglycidyl ether of bisphenol A (DGEBA, DER 331) was provided by Dow Chemical Co. (USA). 4,4′-Diaminodiphenylsulfone (DDS, 99.5%), supplied by J&K chemical Co. was used as a curing agent. Polyetherimide (Grade-Ultem1010, Tg ≈ 216 °C) was purchased from Sabic Basic Co. (USA). N,N-Dimethylformamide (DMF) and methylene dichloride (CH2Cl2) were purchased from Chinasun Specialty Products Co., Ltd. Ethanol (EtOH) was purchased from Shanghai Zhengxing chemical Co. DMF was distilled in a vacuum over calcium hydride prior to use while all the other reagents and chemicals were used as received.
Synthesis of MDA-modified graphene oxide (GO-MDA)
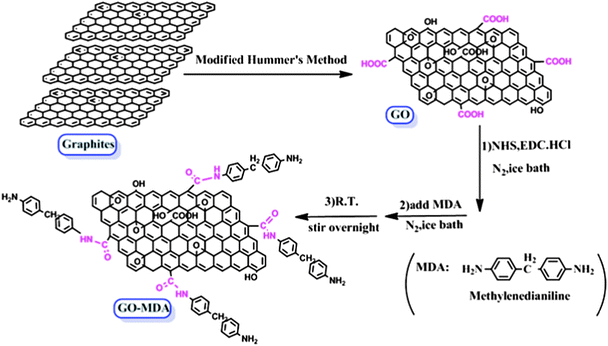
GO was synthesized from graphite powders by the modified Hummer’s method.34,35 GO-MDA was prepared according to the method that Yang et al. have reported,36 with some small changes added in this paper. The procedure can be described as follows: 0.5 g GO was added into 125 ml dry DMF and then ultrasonicated for 4 hours to get exfoliated GO sheets. Then the solution was transferred to an ice-water bath and stirred for 15 min, to which 2.875 g EDC·HCl and 1.71 g NHS were added. After stirring for 2 hours under a nitrogen atmosphere in the ice-water bath, 5.0 g MDA powders were gradually added and followed by another 2 hours of stirring. Subsequently, the mixture was brought to room temperature and vigorously stirred overnight in N2. The product was filtered, washed sequentially with ionized water and ethanol several times, and then the resulting powders were vacuum dried in an oven at 40 °C for 12 hours, and GO-MDA was obtained.Preparation of DGEBA/PEI/GO-MDA composites
Composites with and without GO-MDA were prepared via the process shown in Scheme 2. DEGBA, PEI and GO-MDA were weighed according to the formulation in Table 1 and dissolved in methylene dichloride. After stirring and ultrasonicating for a certain time, a uniform mixture was obtained. Then, the mixture was placed under 70 °C in the fume hood to remove most of the solvent and then under vacuum at 70 °C to remove the residual solvent completely. Subsequently, a stoichiometric amount of curing agent DDS (DGEBA![[thin space (1/6-em)]](https://www.rsc.org/images/entities/char_2009.gif) :
:![[thin space (1/6-em)]](https://www.rsc.org/images/entities/char_2009.gif) DDS = 100
DDS = 100![[thin space (1/6-em)]](https://www.rsc.org/images/entities/char_2009.gif) :
:![[thin space (1/6-em)]](https://www.rsc.org/images/entities/char_2009.gif) 33, by weight ratio) was added to the mixture and stirred for 5–6 min at 140 °C until DDS was fully dissolved. The resulting pre-curing composite was immediately cooled down to room temperature to avoid further curing. The cured samples were prepared as follows: the pre-curing samples were poured into the moulds and then cured at 170 °C isothermally for 4 hours.
33, by weight ratio) was added to the mixture and stirred for 5–6 min at 140 °C until DDS was fully dissolved. The resulting pre-curing composite was immediately cooled down to room temperature to avoid further curing. The cured samples were prepared as follows: the pre-curing samples were poured into the moulds and then cured at 170 °C isothermally for 4 hours.
| Samples | DGEBA (g) | PEI (g) | GO-MDA (g) | DDS (g) |
|---|---|---|---|---|
| G-0 | 5.0 | 1.0 | — | 1.65 |
| G-1 | 5.0 | 1.0 | 0.05 | 1.65 |
| G-2 | 5.0 | 1.0 | 0.10 | 1.65 |
| G-3 | 5.0 | 1.0 | 0.15 | 1.65 |
Characterization
Fourier transform infrared spectra (FTIR) were recorded on a Nicolet Nexus 470 spectrometer in KBr pellets with the resolution of 4 cm−1. X-ray diffraction (XRD) patterns were acquired by a Panalytical X'pert diffractometer with Cu Kα radiation (λ = 0.154 nm). Thermo-gravimetric analyses (TGA) measurement was carried out with a Perkin-Elmer thermal analyzer under nitrogen purging (40 ml min−1) at a heating rate of 20 °C min−1. The fractured surfaces of the composites were observed at 20 kV with a scanning electron microscope (SEM, TESCAN 5136 MM). The differential scanning calorimetric (Mettler-Toledo DSC1) analysis was carried out with a heating rate of 10 °C min−1 from 100 °C to 350 °C under nitrogen purging (50 ml min−1). The rheological measurement was recorded on an Ares-9A rheometer under a parallel plate form using dynamic time sweep mode (temperature: 170 °C, controlled strain: 1%, test frequency: 1 Hz). Dynamic mechanical analysis (DMA, Netzsch DMA 242) was performed using a single cantilever clamp at 1 Hz frequency and the temperature was raised from 50 °C to 280 °C at a heating rate of 5 °C min−1. The tensile properties were measured by means of a universal testing machine (CMT-4102, SANS Group, China) for rectangular specimens. The dimensions of the specimens were 25 mm (length) × 2 mm (width) × 0.7 mm (thickness). A load cell of 10 KN was employed and the tensile rate imposed was 2 mm min−1. At least four tests were conducted for each sample.Results and discussion
Characterization of GO-MDA
The schematic procedure for GO-MDA is shown in Scheme 1. This process includes two steps: (1) preparation of GO according to the modified Hummer’s method, (2) grafting MDA onto GO through the amidation reaction between the carboxylic acid groups of GO and the amine groups of MDA. In the amidation step, excess MDA (ten times the GO) was added to reach a high grafting conversion and at the same time to avoid possible tethers between GO sheets. The reaction was carried out under N2 to protect MDA from being oxygenated. Since MDA belongs to the benzene diamine family, which is one of monomers for the poly-condensation of PEI, grafting MDA to GO can improve its interaction with PEI through non-covalent bonds. In addition, after reacting with the carboxyl acid groups of GO, MDA still has a free amide group left which can further react with DGEBA, providing covalent bonds between GO and DGEBA. As a result, GO-MDA can interact well with both PEI and DGEBA. Therefore, GO-MDA as a medium may improve the compatibility of DGEBA and PEI and then hinder the development of phase separation.The successful synthesis of GO-MDA was proven by FTIR measurement of GO and GO-MDA, as shown in Fig. 1. There are two characteristic bands at 1720 cm−1 and 1623 cm−1 for GO, corresponding to C![[double bond, length as m-dash]](https://www.rsc.org/images/entities/char_e001.gif) O and C
O and C![[double bond, length as m-dash]](https://www.rsc.org/images/entities/char_e001.gif) C stretching vibrations of the carboxyl and skeleton, respectively.37 By modifying GO with MDA, some changes and new absorption bands appeared. For GO-MDA, the new absorption band at 1512 cm−1 is assigned to the phenyl groups of MDA. The band near 1720 cm−1 becomes weaker and is attributed to the amidation reaction between GO and MDA, through which carboxylic acid groups of GO are consumed while new amide carbonyl groups appear. Absorption bands at 1539 cm−1 and 1642 cm−1 are assigned to C–NH (amide II) and HNC
C stretching vibrations of the carboxyl and skeleton, respectively.37 By modifying GO with MDA, some changes and new absorption bands appeared. For GO-MDA, the new absorption band at 1512 cm−1 is assigned to the phenyl groups of MDA. The band near 1720 cm−1 becomes weaker and is attributed to the amidation reaction between GO and MDA, through which carboxylic acid groups of GO are consumed while new amide carbonyl groups appear. Absorption bands at 1539 cm−1 and 1642 cm−1 are assigned to C–NH (amide II) and HNC![[double bond, length as m-dash]](https://www.rsc.org/images/entities/char_e001.gif) O (amide I) stretching vibrations.38,39 The band near 1642 cm−1 of GO-MDA is broad and strong. This is because of the absorption of NH2 groups (1660 cm−1 corresponding to the asymmetric stretching vibrations and 1577 cm−1 to the deformation vibrations) overlapping with C–NH (1642 cm−1) and C
O (amide I) stretching vibrations.38,39 The band near 1642 cm−1 of GO-MDA is broad and strong. This is because of the absorption of NH2 groups (1660 cm−1 corresponding to the asymmetric stretching vibrations and 1577 cm−1 to the deformation vibrations) overlapping with C–NH (1642 cm−1) and C![[double bond, length as m-dash]](https://www.rsc.org/images/entities/char_e001.gif) C (1623 cm−1)).40
C (1623 cm−1)).40
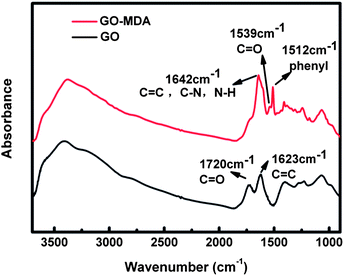 | ||
| Fig. 1 FTIR spectrum of GO and GO-MDA. | ||
The TGA results presented in Fig. 2 not only prove that MDA had been successfully grafted onto GO, but also can be used to quantitatively determine the extent of MDA grafting. For the DTG (derivative TG) curve of GO, the main weight loss peak around 230 °C is assigned to the pyrolysis of the labile oxygen functional groups, yielding CO, CO2, and steam. The small weight loss peak at about 100 °C is due to the loss of residual water in GO.41 For GO-MDA, two major weight loss peaks can be observed from the DTG curve. The peak near 201 °C should be ascribed to the loss of the remaining oxygen functional groups on GO, while the peak around 310 °C corresponds to the decomposition of MDA, from which the load of MDA in GO-MDA is calculated to be about 15 wt%.
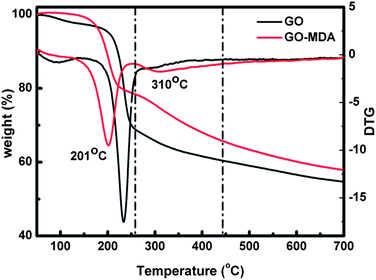 | ||
| Fig. 2 The TGA results of GO and GO-MDA (in N2). | ||
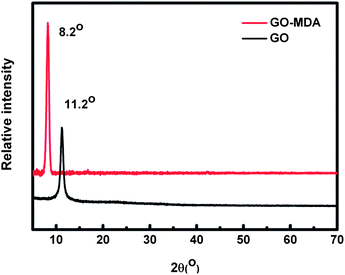
Graphite is a kind of carbon material with a lamella structure. In XRD measurements, it exhibits a strong diffraction peak at about 2θ = 26° (corresponding to an interlayer space of about 0.34 nm) while the diffraction peak of GO appears near 11° (corresponding to an interlayer space of about 0.82 nm). This is because after graphite is oxygenated to GO, a serials of oxygen functional groups (hydroxyl, epoxy, carboxyl groups) are introduced to the surfaces and edges of graphene sheets, leading an increase in the layer space between the two graphene sheets .41,42
Fig. 3 shows the XRD patterns of GO and GO-MDA. Compared to 11.2° for GO, the diffraction peak of GO-MDA appears at about 8.2° (corresponding to an interlayer space of about 1.10 nm). This is due to the grafting of MDA on GO which further increases the layer space between two graphene sheets.
Morphology of DGEBA/PEI/GO-MDA composites
As reported elsewhere,9,18,19 there are two possible mechanisms for CRIPS of the EP/TP binary system, one is the SD mechanism and another is the NG mechanism. Scheme 3 shows the simulated process of the SD and NG mechanisms of the EP/TP binary system. In the SD mechanism, the mixture is a single phase at first, as the cure-reaction proceeds, TP begins to separate out, and a co-continuous structure appears as shown in Scheme 3(A-2). Then, the EP phases grow larger and connect with each other (coarsening), leading to the destruction of the continuous TP-net, as shown in Scheme 3(A-3). Finally, the EP phase becomes the only continuous phase while TP particles, irregular or regular in shape, distribute in it like islands in the sea, as shown in Scheme 3(A-4). Sometimes, when the content of TP is high enough (usually ≥30 wt%), an inverted structure (EP particles distributed in the continuous TP phase) may occur. In the NG mechanism, the mixture is also homogeneous at first. As the molar mass of EP increases, TP will separate out in the shape of small round particles with the EP phase as the continuous phase (Scheme 3(B-2)), and then the small TP particles aggregate into bigger ones, as shown in Scheme 3(B-3). Finally, the binary system also exhibits an island in the sea structure, in which the round TP particles are regularly distributed in the EP continuous phase (Scheme 3(B-4)). The EP/TP binary system shows quite different morphology in the SD and NG mechanisms, therefore by observing the morphology we can preliminarily decide which mechanism the CRIPS of the system follows.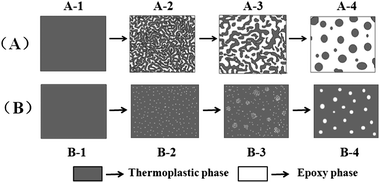 | ||
| Scheme 3 The simulated process of (A) SD and (B) NG mechanism in an epoxy/thermoplastic polymer binary system. | ||
The morphology of the DGEBA/PEI/GO-MDA composites was observed by SEM measurement. After curing at 170 °C for 4 hours, the cured samples were cooled to room temperature, fractured in liquid nitrogen, and etched in CH2Cl2 with vigorous stirring for 48 h to ensure that all the PEI parts had been removed. Subsequently, the etched samples were washed with clean CH2Cl2 several times and then placed under 70 °C to remove CH2Cl2 completely. Finally, the etched fractured surfaces were coated with gold and then observed with SEM as shown in Fig. 4 (the remaining parts are assigned to the cross-linked DGEBA while the missing parts are assigned to the PEI).
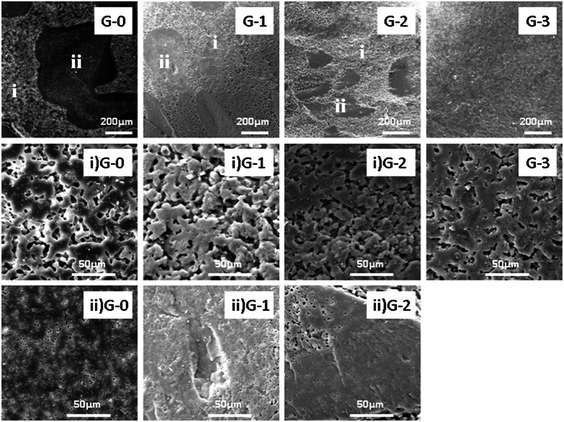 | ||
| Fig. 4 SEM images of fractured surfaces of G-0, G-1, G-2 and G-3 (i: PEI-rich phase, ii: epoxy-rich phase). | ||
In Fig. 4 from the morphology of G-0, G-1, G-2 and G-3, it can be found that the CRIPS behaviour of the four samples all follow the SD mechanism because both the PEI-rich phase (i) and the epoxy-rich phase (ii) are irregular in shape, which is characteristic of the SD mechanism. A co-continuous structure is observed in Fig. 4 G-0, G-1, G-2, G-3, and as the content of GO-MDA is increased, the extent of coarsening is suppressed (the size of the epoxy-rich phase becomes smaller) and the final phase separation morphology is stopped at an earlier stage of co-continuous structure. When the content of GO-MDA reaches 3.0 wt%, the suppression effect is most obvious and no large epoxy coarsening particles (≥100 μm) can be seen in the composites as shown in Fig. 4 G-3.
In addition, secondary phase separation occurred in G-0, G-1 and G-2. For PEI-rich phases (i), as shown in Fig. 4 (i) G-0–G-2, a co-continuous structure is observed. For epoxy-rich phases (ii), as presented in Fig. 4 (ii) G-0–G-2, small PEI particles are distributed in the continuous epoxy phase like islands in the sea. This is because the content of PEI is higher in the PEI-rich phase (i) than in the epoxy-rich phase (ii). For composite G-3, no secondary phase separation is observed. This can be attributed to its low degree of CRIPS, which proves again that adding GO-MDA can help hinder the development of phase separation.
Effect of GO-MDA on phase separation behaviour
The final phase separation morphology of an EP/TP binary system is determined by the competition between cure-reaction rate and phase separation rate.17 As mentioned above, the phase separation behaviour of an EP/TP binary system is induced by cure-reaction. The faster the cure-reaction rate is, the earlier the gel point can be reached. Thus, the phase separation can be stopped at a much earlier stage. Phase separation is a physical process and the phase separation rate is largely determined by the viscosity of the system. The phase separation rate will be fast when the viscosity is low as the chain is more movable, instead it will be slow when the viscosity is high. Here, in order to study the effect of GO-MDA on the phase separation behaviour of the DGEBA/PEI binary system, rheological and DSC measurements were used.Rheological measurement was carried out under a constant temperature (170 °C). About 1 g of pre-curing sample was put between two 25 mm parallel plates, and the dynamic time sweep measurement was processed to determine the change of complex viscosity (η*) of the sample along with curing time. The result is shown in Fig. 5.
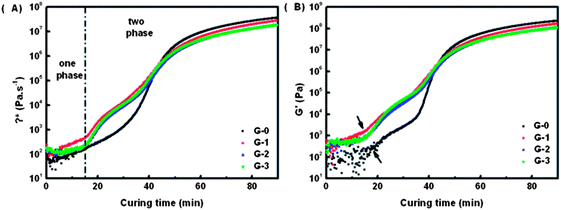 | ||
| Fig. 5 (A) Variation of complex viscosity η* versus curing time of G-0, G-1, G-2 and G-3; (B) variation of storage modulus G′ versus curing time of G-0, G-1, G-2 and G-3. | ||
In Fig. 5(A), two abrupt increase stages of η* can be observed in all the three curves of G-1, G-2 and G-3. The first stage beginning near 15 min is due to the formation of a PEI-net (PEI's viscosity is higher than epoxy oligomers or monomers), while the second stage starts at about 40 min is assigned to the gelation of epoxy phase (an infinite cross-linking net of epoxy is formed). The characteristic shape of the η* curves prove again that the CRIPS behaviour of G-1, G-2, and G-3 all follow the SD mechanism.43–45 For G-0, although the first stage is not obvious in Fig. 5(A), two abrupt increase stages can be observed in its G′ curve in Fig. 5(B), which also coincides with the characteristics of the SD mechanism.
From Fig. 5(A) we can also conclude that by adding GO-MDA the complex viscosity of composites increases. η* of G-1, G-2 and G-3 is higher than G-0, but η* doesn't change much among G-1, G-2 and G-3 as shown in Fig. 5(A). This indicates that the phase separation rate of the composites can indeed be suppressed through the addition of GO-MDA, but the suppression effect won't be enhanced much by increasing the content of GO-MDA from 1.0 wt% to 3.0 wt%.
Fig. 6 shows the result of the onset time and gelation time of each sample. Onset time is the time when the phase separation begins, and is defined as the time point at which the storage modulus G′ first increases abruptly (as shown by the arrows in Fig. 5(B)). Gelation time is the critical time point when an infinite cross-linking net is formed. The cross over time point of G′ and G′′ curves is often used to represent the gelation time, which can also be regarded as the offset time of phase separation.7,46 In Fig. 6, both the onset time and gelation time decrease as the content of GO-MDA increases. This indicates that GO-MDA can accelerate the curing-reaction and help make the curing-reaction of the composites stop earlier. The effect is most obvious when the content of GO-MDA is 3.0 wt% as the gelation time decrease most significantly, from 41.0 min (G-0) to 30.5 min (G-3).
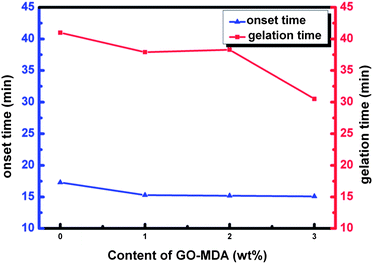 | ||
| Fig. 6 Onset time and gelation time of samples with different content of GO-MDA. | ||
Fig. 7 presents the dynamic temperature sweep DSC curves of G-0, G-1, G-2 and G-3. The results from the DSC measurement are summarized in Table 2, including the initial temperature (Tinitial, where the curing-reaction begins), peak temperature (Tpeak, where the curing-reaction rate is maximal) and the total reaction enthalpy of DGEBA (ΔH, the integral area) of the exothermic curves. Tpeak decreases a little by adding GO-MDA, this may be due to the increase in viscosity of the composites, which decreases the collision probability between DGEBA monomers and curing agent. It can be found that Tpeak, of G-1, G-2 and G-3 is higher than G-0, while the Tpeak, of G-1, G-2, and G-3 are almost the same, which corresponds well with the variation tendency of η* for composites in Fig. 5(A). Tinitial decreases with the increase of the concentration of GO-MDA, showing that GO-MDA may have some acceleration effect on the curing-reaction of the composites. ΔH, representing the integrated result of all the factors, increases with increasing concentration of GO-MDA. This demonstrates that GO-MDA can indeed accelerate the curing-reaction of the composites, and the effect is most obvious when the content of GO-MDA reaches 3.0 wt%, which is consistent with the results of the rheological measurement in Fig. 6. This can be explained by the inset in Fig. 7. When using MDA as the curing agent of DGEBA, both the Tinitial and Tpeak substantially move to a much lower temperature compared to DDS, confirming that MDA is a much more active curing agent of DGEBA than DDS. Since GO-MDA contains 15 wt% MDA, the curing-reaction rate can be increased when introducing GO-MDA into the composites. Therefore, although the increase of viscosity may decrease the curing-reaction rate of the DGEBA/PEI–GO-MDA composites a little, the acceleration effect of GO-MDA is more dominant.
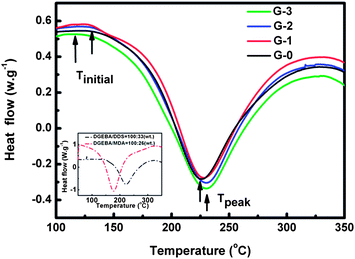 | ||
| Fig. 7 Dynamic temperature sweep DSC curves of G-0, G-1, G-2 and G-3; inset: dynamic temperature sweep DSC curves of DGEBA/DDS and DGEBA/MDA blends. | ||
| Samples | T initial (°C) | T peak (°C) | ΔH (J gepoxy−1) |
|---|---|---|---|
| G-0 | 129.1 | 225.8 | 481.8 |
| G-1 | 127.5 | 230.7 | 516.4 |
| G-2 | 127.1 | 230.7 | 527.3 |
| G-3 | 118.4 | 230.2 | 529.0 |
From the rheological and DSC measurement results, we can conclude that incorporation of GO-MDA can decrease the phase separation rate and increase the curing-reaction rate of the composites at the same time, and the increase in the curing-reaction rate is more remarkable with the increase of the content of GO-MDA. As a result, the phase separation behaviour of the composites are effectively hindered and stopped at a much earlier stage, which is good for the mechanical properties of composites.
Mechanical and thermal properties of the DGEBA/PEI/GO-MDA composites
The DMA measurement results are displayed in Fig. 8. Fig. 8(A) shows the variation of storage modulus E′ along with temperature for G-0, G-1, G-2 and G-3. It can be found that adding GO-MDA into DGEBA/PEI systems leads to a remarkable increase in storage modulus of the composites, especially when the concentration of GO-MDA is 3.0 wt%, about 58.5% increase in E′ is observed. The enhancement of storage modulus may result from GO-MDA's good dispersion and its strong interaction with DGEBA and PEI. Using the chemical modification process, GO-MDA is more compatible with the DGEBA/PEI binary system. MDA is one of the monomers for the poly-condensation of PEI, thus GO-MDA may interact well with PEI via non-covalent bonds. In addition, the remaining amino groups on the surface of GO-MDA (coming from MDA) can react with DGEBA, forming covalent bonds between GO-MDA and DGEBA. Through covalent and non-covalent bonds, the high modulus of GO is transferred to the polymer matrix and then strengthens it. The glass transition temperature Tg of composites G-0, G-1 and G-2 doesn't change much, while the Tg of G-3 presents a 3 °C decrease as shown in Fig. 8(B). This may be due to the morphology differences between the composites. In conclusion, although the Tg of the composites changed slightly, even with a decrease of 3 °C for G-3 compared to G-0, the increase of storage modulus of the composites is noticeable.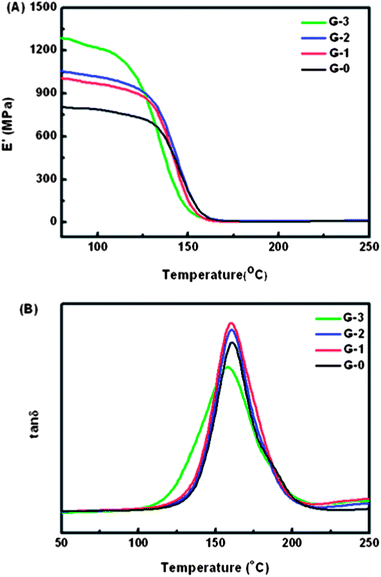 | ||
| Fig. 8 (A) Storage modulus and (B) Glass transition temperature of G-0, G-1, G-2 and G-3 in DMA measurement. | ||
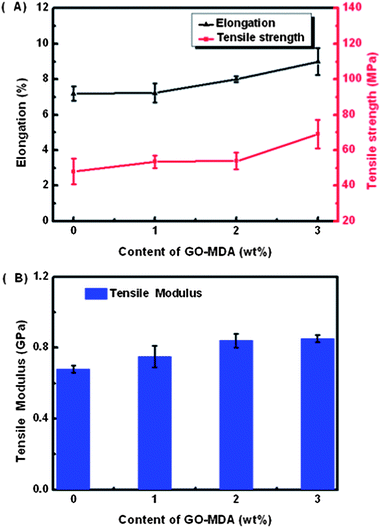
Fig. 9 displays the tensile test results of G-0, G-1, G-2 and G-3. Fig. 9(A) indicates that both the elongation at break and the tensile strength of the composites rise as the content of GO-MDA is increased. Namely, DGEBA/PEI systems are toughened by introducing GO-MDA into the matrix, which is consistent with the final morphology of the composites observed in Fig. 4. Adding GO-MDA helps decrease the degree of phase separation and leads to the final morphology of the composites being frozen at a more perfect co-continuous structure. Therefore, the composites are tough. The tensile modulus is also improved by adding GO-MDA according to Fig. 9(B), the same as proved by DMA measurement in Fig. 8(A). From the tensile test, it can be found that the tensile properties of the composites (toughness and strength) are also the optimum when the concentration of GO-MDA is 3.0 wt%.
Fig. 10 shows the TGA results of G-0, G-1, G-2 and G-3. The inset is the enlarged view of the temperature corresponding to 5% weight loss (T95 wt%). It illustrates that T95 wt% of composites decreases (about 404 °C at 0.0 wt% and about 399 °C at 3.0 wt%) while the main weight loss peak temperature remains almost unchanged as the concentration of GO-MDA is increased. This indicates that introduction of GO-MDA decreases the thermal stability of the DGEBA/PEI systems a little, which may be attributed to the residual oxygen functional groups on the surface of GO-MDA.
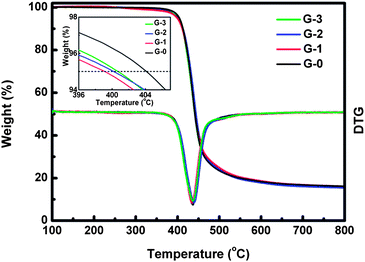 | ||
| Fig. 10 TGA results of G-0, G-1, G-2 and G-3 (in N2), the inset is the enlarged view of T95 wt%. | ||
Conclusions
In this paper, GO-MDA was successfully synthesized. The CRIPS behaviour of the composites with or without GO-MDA all followed the SD mechanism, which was proven by SEM and rheological measurements.By adding GO-MDA into DGEBA/PEI binary systems, the curing-reaction rate and complex viscosity increased. As a result, the CRIPS behaviour of the composites was suppressed and the final morphology was frozen at an earlier stage of co-continuous structure (the large size (≥100 μm) of coarsening epoxy-rich parts became smaller and finally disappeared as the content of GO-MDA increased from 0.0 wt% to 3.0 wt%), which is beneficial to the mechanical properties of the composites.
As for the properties of the composites, the thermal stability of the DGEBA/PEI systems decreased a little in the presence of GO-MDA, but both the toughness and modulus increased with the introduction of GO-MDA.
Acknowledgements
We gratefully acknowledge the financial support of the National Science Foundation of China (NSFC) (no. 20934002, 51073043, 21274030) and the National Basic Research Program of China (no. 2009CB930000).Notes and references
- D. Verchere, J. P. Pascault, H. Sautereau, S. M. Moschiar, C. C. Riccardi and R. J. J. Williams, J. Appl. Polym. Sci., 1991, 42, 701–716 CrossRef CAS.
- K. Yamanaka and T. Inoue, J. Mater. Sci., 1990, 25, 241–245 CrossRef CAS.
- P. P. Vijayan, D. Puglia, J. M. Kenny and S. Thomas, Soft Matter, 2013, 9, 2899–2911 RSC.
- J. W. Hwang, K. Cho, C. E. Park and W. Huh, J. Appl. Polym. Sci., 1999, 74, 33–45 CrossRef CAS.
- B. S. Kim, T. Chiba and T. Inoue, Polymer, 1995, 36, 43–47 CrossRef CAS.
- K. Mimura, H. Ito and H. Fujioka, Polymer, 2000, 41, 4451–4459 CrossRef CAS.
- J. W. Park and S. C. Kim, Polym. Adv. Technol., 1996, 7, 209–220 CrossRef CAS.
- W. J. Gan, W. Xiong, Y. F. Yu and S. J. Li, J. Appl. Polym. Sci., 2009, 114, 3158–3167 CrossRef CAS.
- S. J. Wu, J. Appl. Polym. Sci., 2006, 102, 1139–1145 CrossRef CAS.
- B. Francis, G. V. Poel, F. Posada, G. Groeninckx, V. L. Rao, R. Ramaswamy and S. Thomas, Polymer, 2003, 44, 3687–3699 CrossRef CAS.
- B. Francis, V. L. Rao, S. Jose, B. K. Catherine, R. Ramaswamy, J. Jose and S. Thomas, J. Mater. Sci., 2006, 41, 5467–5479 CrossRef CAS.
- Y. Liu, W. Wu, Y. Chen, P. Shi, M. Liu and X. Wu, J. Appl. Polym. Sci., 2013, 127, 3213–3220 CrossRef.
- A. Bonnet, J. P. Pascault, H. Sautereau, M. Taha and Y. Camberlin, Macromolecules, 1999, 32, 8517–8523 CrossRef CAS.
- B. S. Kim, T. Chiba and T. Inoue, Polymer, 1993, 34, 2809–2815 CrossRef CAS.
- E. Girard-Reydet, V. Vicard, J. P. Pascault and H. Sautereau, J. Appl. Polym. Sci., 1997, 65, 2433–2445 CrossRef CAS.
- S. J. Wu, T. K. Lin and S. S. Shyu, J. Appl. Polym. Sci., 2000, 75, 26–34 CrossRef CAS.
- W. H. Jo and M. B. Ko, Macromolecules, 1994, 27, 7815–7824 CrossRef CAS.
- E. Girard-Reydet, H. Sautereau, J. P. Pascault, P. Keates, P. Navard, G. Thollet and G. Vigier, Polymer, 1998, 39, 2269–2279 CrossRef CAS.
- J. L. Chen and F. C. Chang, Macromolecules, 1999, 32, 5348–5356 CrossRef CAS.
- S. K. Siddhamalli, Polym.-Plast. Technol. Eng., 2000, 39, 699–710 CrossRef CAS PubMed.
- P. Jyotishkumar, P. Moldenaers, S. M. George and S. Thomas, Soft Matter, 2012, 8, 7452–7462 RSC.
- M. Rico, J. Lopez, B. Montero and R. Bellas, Eur. Polym. J., 2012, 48, 1660–1673 CrossRef CAS PubMed.
- J. Zhang and X. M. Xie, Composites, Part B, 2011, 42, 2163–2169 CrossRef PubMed.
- S. A. Xu, G. T. Wang and Y. W. Mai, J. Mater. Sci., 2013, 48, 3546–3556 CrossRef CAS PubMed.
- J. K. Duan, C. N. Kim, P. K. Jiang and G. L. Wang, J. Appl. Polym. Sci., 2010, 115, 2734–2746 CrossRef CAS.
- M. Peng, D. S. Li, Y. Chen and Q. Zheng, J. Appl. Polym. Sci., 2007, 104, 1205–1214 CrossRef CAS.
- M. Peng, H. B. Li, L. J. Wu, Y. Chen, Q. Zheng and W. F. Gu, Polymer, 2005, 46, 7612–7623 CrossRef CAS PubMed.
- P. Jyotishkumar, J. Pionteck, P. Moldenaers and S. Thomas, J. Appl. Polym. Sci., 2013, 127, 3159–3168 CrossRef CAS.
- Y. Liu, X. H. Zhong, G. Z. Zhan, Y. F. Yu and J. Y. Jin, J. Phys. Chem. B, 2012, 116, 3671–3682 CrossRef CAS PubMed.
- A. K. Geim and K. S. Novoselov, Nat. Mater., 2007, 6, 183–191 CrossRef CAS PubMed.
- S. Stankovich, D. A. Dikin, G. H. B. Dommett, K. M. Kohlhaas, E. J. Zimney, E. A. Stach, R. D. Piner, S. T. Nguyen and R. S. Ruoff, Nature, 2006, 442, 282–286 CrossRef CAS PubMed.
- J. I. Paredes, S. Villar-Rodil, A. Martinez-Alonso and J. M. D. Tascon, Langmuir, 2008, 24, 10560–10564 CrossRef CAS PubMed.
- J. R. Potts, D. R. Dreyer, C. W. Bielawski and R. S. Ruoff, Polymer, 2011, 52, 5–25 CrossRef CAS PubMed.
- W. S. Hummers and R. E. Offeman, J. Am. Chem. Soc., 1958, 80, 1339 CrossRef CAS.
- Y. Z. Hu, J. F. Shen, N. Li, M. Shi, H. W. Ma, B. Yan, W. B. Wang, W. S. Huang and M. X. Ye, Polym. Compos., 2010, 31, 1987–1994 CrossRef CAS.
- Y. F. Yang, J. Wang, J. Zhang, J. C. Liu, X. L. Yang and H. Y. Zhao, Langmuir, 2009, 25, 11808–11814 CrossRef CAS PubMed.
- D. C. Marcano, D. V. Kosynkin, J. M. Berlin, A. Sinitskii, Z. Z. Sun, A. Slesarev, L. B. Alemany, W. Lu and J. M. Tour, ACS Nano, 2010, 4, 4806–4814 CrossRef CAS PubMed.
- T. Huang, R. G. Lu, C. Su, H. N. Wang, Z. Guo, P. Liu, Z. Y. Huang, H. M. Chen and T. S. Li, ACS Appl. Mater. Interfaces, 2012, 4, 2699–2708 CAS.
- N. D. Luong, U. Hippi, J. T. Korhonen, A. J. Soininen, J. Ruokolainen, L. S. Johansson, J. D. Nam, L. H. Sinh and J. Seppala, Polymer, 2011, 52, 5237–5242 CrossRef PubMed.
- M. Baikousi, K. Dimos, A. B. Bourlinos, R. Zboril, I. Papadas, Y. Deligiannakis and M. A. Karakassides, Appl. Surf. Sci., 2012, 258, 3703–3709 CrossRef CAS PubMed.
- S. Stankovich, D. A. Dikin, R. D. Piner, K. A. Kohlhaas, A. Kleinhammes, Y. Jia, Y. Wu, S. T. Nguyen and R. S. Ruoff, Carbon, 2007, 45, 1558–1565 CrossRef CAS PubMed.
- E. Treossi, M. Melucci, A. Liscio, M. Gazzano, P. Samori and V. Palermo, J. Am. Chem. Soc., 2009, 131, 15576–15577 CrossRef CAS PubMed.
- Y. F. Yu, Z. C. Zhang, W. J. Gan, M. H. Wang and S. J. Li, Ind. Eng. Chem. Res., 2003, 42, 3250–3256 CrossRef CAS.
- R. J. Varley, Macromol. Mater. Eng., 2007, 292, 46–61 CrossRef CAS.
- A. Bonnet, J. P. Pascault, H. Sautereau and Y. Camberlin, Macromolecules, 1999, 32, 8524–8530 CrossRef CAS.
- Y. Ishii and A. J. Ryan, Macromolecules, 2000, 33, 167–176 CrossRef CAS.
| This journal is © The Royal Society of Chemistry 2014 |

