On-line preconcentration and determination of ultra trace amounts of mercury using surfactant coated alumina modified by dithizone with cold vapor atomic absorption spectrometry
Zaheer Ahmed Chandioa,
Farah Naz Talpur*b,
Humaira Khana,
Hassan Imran Afridib,
Ghulam Quadir Khaskhelia and
Moina Akhtar Mughala
aDr. M. A. Kazi Institute of Chemistry, University of Sindh, Jamshoro, 76080, Pakistan
bNational Center of Excellence in Analytical Chemistry, University of Sindh, Jamshoro, 76080, Pakistan. E-mail: farahtalpur@hotmail.com; Tel: +92-3322602302
First published on 23rd October 2013
Abstract
The potential of an inexpensive dithizone immobilized on ammonium lauryl sulfate alumina adsorbent to separate and preconcentrate traces of mercury from vegetables and ground water has been evaluated. A cartridge filled with 100 mg of adsorbent was incorporated to an on-line vapor generation accessory system. Traces of mercury in sample solutions were pumped through the cartridges for 2 min (flow rate of 5 mL min−1) and then eluted from the cartridges with 1 M hydrochloric acid for 1 min at a flow rate of 1 mL min−1. At the same time that mercury is eluted from the cartridges, the eluate is mixed with a 0.02% (m/v) sodium borohydride solution and the mercury cold vapor is swept through the atomization cell with a nitrogen flow of 50 mL min−1. The overall procedure (mercury separation–preconcentration and mercury cold vapor generation–atomization) is completed in around 3 min. The developed method achieves an enrichment factor of 125 with a limit of detection of 0.12 ng mL−1. The repeatability and the accuracy of the overall procedure were successfully assessed.
Introduction
The environmental polluting nature of heavy metals has recently received considerable attention. Due to its high volatility and high toxicity (especially its neurological health impact), mercury has become a major concern among the hazardous heavy metals.1 The analysis and monitoring of mercury in environmental, biological, industrial and food samples is extremely important because of the high toxicity of this metal both in inorganic and organic compounds.2Several analytical techniques such as spectrophotometry,3 inductively coupled plasma mass spectrometry (ICP-MS),4 inductively coupled plasma atomic emission spectrometry (ICP-AES),5 voltammetric techniques;6 atomic fluorescence spectrometry (AFS)7 and neutron activation analysis8 have been developed for the determination of mercury. However, cold vapor atomic absorption spectrometry (CV-AAS) is a widely accepted technique for the determination of mercury due to its simplicity, high sensitivity and relative lack of interferences.9 CV-AAS is not straightforwardly applicable to some environmental, clinical, or biological samples when a low amount of analyte is available or the sample matrix is complex. To meet these requirements, a reliable preconcentration step is essential for the quantitative separation and enrichment of mercury ions from a real sample.
In the last few years, solid phase extraction (SPE) has become the most often used preconcentration technique for trace analysis.10 The basic principle of SPE is the transfer of analytes from the aqueous phase to the active sites of the adjacent solid phase. This technique is attractive as it reduces the use of and exposure to solvents, their disposing costs and extraction times. It also allows the achievement of high recoveries, along with the possibility of elevated enrichment factors. In addition, SPE can be interfaced on-line with analytical detection techniques.11
Ionic surfactants adsorb on metal oxides, such as alumina and iron(III) oxide, and form aggregates known as hemimicelles and admicelles. Hydrophobic chelating agents could easily be immobilized on the micelles and can be used for the separation and preconcentration of trace metals.12 Moreover, alumina is cheaper compared to other supports like cellulose, activated carbon, iron oxide and C18 (45 € vs. 62–1160 € per 250 g).
In this paper, an on-line preconcentration procedure is described for the determination of mercury in vegetables and ground water samples using a flow-injection approach with CV-AAS as a detection method. In this approach, a cartridge of ammonium lauryl sulphate coated immobilized alumina with dithizone was used as the solid phase. For a comparative study, the analytical data from some reported SPE methods for the determination of mercury are given in Table 1. To the best of our knowledge, this is the first report on the application of ammonium lauryl sulphate coated alumina with dithizone in the separation and preconcentration of mercury in an on-line procedure.
| Support | Modifier | Sample volume (mL) | Eluent | Sample throughput (h−1) | PF | DL (μg L−1) | Ref. |
|---|---|---|---|---|---|---|---|
| Cellulose | Dithizone | 100 | Polyethylene glycol | 1 | 33 | 2 | 3 |
| Activated carbon | — | 25 | Nitric acid | 22 | 13 | 0.01 | 9 |
| Fe3O4 | Dithizone | 50 | 5 mL of 0.5 mol L−1 HNO3 | — | 100 | 0.16 | 13 |
| C18 | Dithiophosphoric acid diacyl ester | 25 | — | 12 | — | 0.01 | 14 |
| SiO2 | 4-(2-Pyridylazo) resorcinol | — | 4 mL of 6 mol L−1 HCl | — | 50 | 0.43 | 15 |
| Alumina | Dithizone | 10 | 1 mL of 1 M HCl | 20 | 125 | 0.12 | This work |
Experimental work
Instrumentation
A vapor generation accessory (VGA) continuous flow device which uses a peristaltic pump to mix the reagent and the sample streams with a supply of inert gas was used. The inert gas and mercury volatiles were separated from the liquid in a gas–liquid separator. The separated gas flowed into a flow-through cell aligned on the light path of a Varian AA 20 spectra atomic absorption spectrometer (Mulgrave, Victoria, Australia). The spectrometer was operated at the 253.7 nm line with a hollow cathode current of 5 mA and a slit width of 1.0 nm.Reagents and standards
All reagents were of the highest purity available and all solutions were prepared in ultra pure water. A 100 mg L−1 Hg stock solution was prepared with HgCl2, the calibration solutions were daily prepared by sequential dilution of the stock solution. The ionic mercury in the test solutions was reduced to metallic mercury by sodium borohydride in a hydrochloric acid matrix. The reductant solution used was 0.02% sodium borohydride in 0.005% sodium hydroxide. The acid solution was 10% w/w hydrochloric acid. Hydrochloric acid, sodium borohydride, sodium hydroxide, dithizone, HgCl2 and aluminum oxide 90 standardised (70–230 mesh ASTM) were purchased from Merck (Darmstadt, Germany). The surfactant ammonium lauryl sulphate (ALS) was purchased from Fluka (St. Louis, US).Preparation of sorbent
A dithizone–ALS solution was prepared by adding 5 mL of (30%) ALS and 5 mg of dithizone to 10 mL of 0.1 mol L−1 aqueous ammonia and diluting the resulting mixture to 25 mL with deionized water. 3 g of alumina was added and the suspension was acidified to pH 2 with HCl (4 mol L−1) and shaken for 15 min. The solid phase was filtered and washed with deionized water. The adsorbent was stored in a dry sampling bottle.General procedure
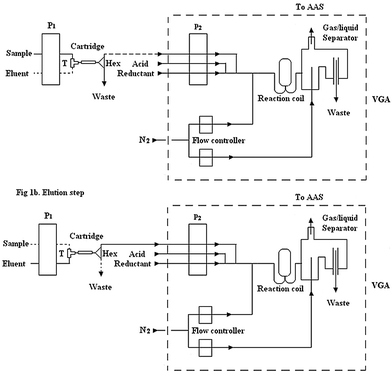
The FIA system is shown in Fig. 1. The manifold was connected by PTFE tubes (i.d. 0.5 mm). The analytical procedure is described as follows. The first step was the on-line preconcentration of mercury carried out by the cartridge. For this purpose, the peristaltic pump 1 (P1) was open while the pump 2 (P2) of VGA was closed, at the same time the T was open for the sample and Hex was switched towards the waste, as shown in Fig. 1a. Mercury was enriched by passing through the cartridge for 2 min at a flow rate of 5 mL min−1. The second step was the elution of the enriched target metal from the cartridge at a flow rate of 1 mL min−1. In doing so, both pumps were open, T was open towards the eluent and Hex was switched to the VGA Fig. 1b. The VGA system consists of a three channel peristaltic pump equipped with Tygon and polyethylene tubes that carried the eluent through a reaction coil, where it was acidified and mixed with sodium borohydride as a reductant. The mercury vapor formed was transferred to a flow through cell aligned on the light path of the AAS with a nitrogen flow of 50 mL min−1. | ||
| Fig. 1 Schematic diagram for on-line manifold, (a) preconcentration step and (b) elution steps. P1 and P2: peristaltic pumps; T: single key T; Hex: 3 way valve; VGA: vapor generation accessory. | ||
Sample preparation
All vegetable samples were washed thoroughly and separately. Running tap water was used to remove dust and adhered particles. The samples were later rinsed thrice with deionised water and subsequently dried in an oven at 60–80 °C. After drying and cooling, about 2 g of each dried sample was weighed accurately in a cleaned and dried 50 mL beaker and digested in 10 mL of a 1![[thin space (1/6-em)]](https://www.rsc.org/images/entities/char_2009.gif) :
:![[thin space (1/6-em)]](https://www.rsc.org/images/entities/char_2009.gif) 3 mixture of concentrated 65% HClO4 and HNO3 by using a hotplate until a clear solution was obtained. Digested samples were cooled at room temperature. The pH was adjusted to 8 with NaOH (4 M), the solution was filtered through a 0.45 mm filter paper and the volume was made up to 50 mL with doubled distilled deionised water.16
3 mixture of concentrated 65% HClO4 and HNO3 by using a hotplate until a clear solution was obtained. Digested samples were cooled at room temperature. The pH was adjusted to 8 with NaOH (4 M), the solution was filtered through a 0.45 mm filter paper and the volume was made up to 50 mL with doubled distilled deionised water.16
Results and discussion
FTIR characterization
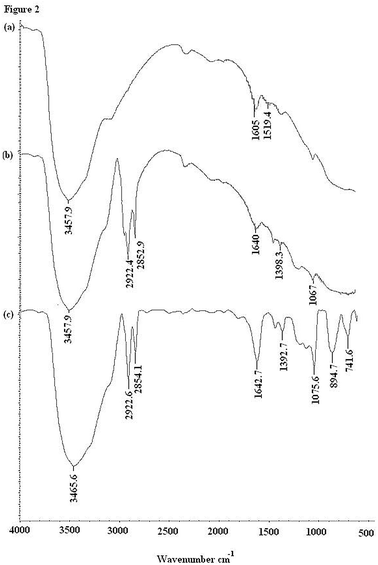
In this experiment, the synthesized solid phase support was characterized using FT-IR spectroscopy. Fig. 2 shows the FT-IR spectra of the solid support at different stages of the modification and complexation processes compared to the FT-IR spectrum of alumina. The broad absorption band in the region of 3457 cm−1 and the weak band at 1605 cm−1 can be attributed to the stretching of the Al–O group (a). After modification of the ALS on alumina with dithizone, new peaks are observed at 2922.4 cm−1 and 2852.9 cm−1 which are assigned to the C–H stretchings showing the coating of alumina with the surfactant, while there is a shift in the peak from 1605 cm−1 to 1640 cm−1 showing the involvement of the Al–O bond linkage in the modification with dithizone. The absorption spectrum shows that the absorption bands at 1398.3 cm−1 and 1067 cm−1 correspond to the bending vibration of the N–H and C–N groups (b). After adsorption (c), the shifted peak from 1398.3 cm−1 to 1692.7 cm−1, attributed to –NH, also takes part in the adsorption interactions. The C–N band at 1067 cm−1 is shifted and sharpened to 1075.6 cm−1 which shows the interaction with the mercury ions. | ||
| Fig. 2 IR spectra of ALS coated alumina modified with dithizone before and after the adsorption of mercury. | ||
In order to get the best performance for the flow system, the effect of various chemicals and instrumental variables on the preconcentration and determination of Hg were studied and optimized using a one-at-a-time optimization method. The absorbance of Hg was used as the analytical signal in the optimization procedure.
The pH value of the sample solution is one of the most important variables controlling the mercury ion sorption limit as the sorption process of mercury ions is the formation reaction of a complex and hydrogen ions affect this complexation reaction. The effect of the pH was investigated in the range of 3–9. In this study, pH values for sample solutions containing 0.125 μg mL−1 Hg(II) were adjusted to the desired pH value using appropriate buffers. Then, 10 mL of a sample solution was passed through the cartridge packed with ALS coated immobilized alumina with dithizone at a flow rate of 5 mL min−1. The adsorbed mercury was eluted by a stream of HCl (1 M) with a flow rate of 1 mL min−1. Fig. 3 shows that the absorbance signal has a maximum value for the sample at pH 8.
The effect of amount of adsorbent in the column was investigated in the range of 50–125 mg by increments of 25 mg. About 75 mg of adsorbent was enough to retain the above standards of the analyte. However, 100 mg was used throughout in order to ensure the total retention of mercury.
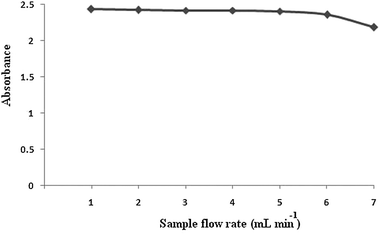
Efficiency of the on-line time based preconcentration is influenced by the flow rate of the sample as it regulates the analyte transfer from the liquid to the solid phase and the analytical throughput. The effect of the sample flow rate on the preconcentration of 10 mL of 0.125 μg mL−1 mercury solutions was investigated in the range of 1–7 mL min−1. As a result, flow rate of 5 mL min−1 was optimized as shown in Fig. 4.
 | ||
| Fig. 4 Effect of the sample flow on the sensitivity. Conditions: preconcentration of 10 mL of 0.125 μg mL−1 mercury solutions at pH 8 and elution with 1 M HCl with a flow rate of 1 mL min−1. | ||
Preliminary investigations showed that the desorption of the adsorbed mercury ions could occur only in acidic media, and thus, some efforts were made to choose the best type of eluent. Nitric acid, hydrochloric acid and sulfuric acid of the same concentration (1 M) were tested. The results obtained showed that hydrochloric acid has a higher elution ability and sensitivity than nitric acid and sulfuric acid (Table 2). Subsequently hydrochloric acid was selected as the best eluent for the elution of mercury. The effect of the hydrochloric acid volume was studied in the range of 5–1 mL, the recovery was not affected even with the decrease of the hydrochloric acid volume down to 1 mL. Therefore, 1 mL HCl was chosen as the optimized volume. Since the VGA continuous flow system requires a minimum volume of 1 mL, volumes less than 1 mL cannot be used for optimization. The elution time was fixed at 60 s in order to ensure the complete elution of the adsorbed mercury ions even at high concentrations.
| Eluent type | Recovery % |
|---|---|
| Nitric acid | 88 ± 0.02 |
| Hydrochloric acid | 99 ± 0.10 |
| Sulfuric acid | 62 ± 0.04 |
Preconcentration factor
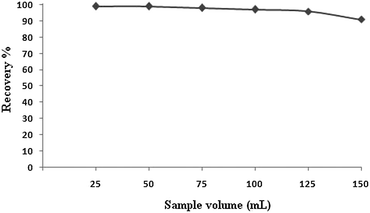
The sample volume is one of the most important parameters to obtain high preconcentration factors for the analysis of real samples. The effect of the sample volume on the retention behavior of mercury on ALS coated alumina modified with dithizone was studied by varying the sample volume from 25 to 150 mL containing 1.25 μg of Hg. The recovery values for the mercury ions as a function of the sample volume are shown in Fig. 5. The sample volume does not affect the quantitative recovery of the investigated metal ions in the range of 25–125 mL of sample volume. At volumes higher than 125 mL, the recovery of the analyte ions decrease. Hence, the preconcentration factor and the enrichment factor obtained were 125-fold. The enrichment factor is defined as EF = [QT/QS]/[QTo/QSo] where QTo and QT are the quantities of analyte before and after preconcentration, respectively, and QSo and QS are the amount of sorbent before and after enrichment.17 Since the amount of sorbent was the same before and after enrichment, the obtained enrichment factor is the same as the preconcentration factor.Analytical performance
Some analytical parameters were studied for the proposed on-line preconcentration and determination of mercury under optimum conditions (pH 8, sample flow rate 5 mL min−1 and elution with 1 M HCl solution at flow rate of 1 mL min−1).Using the on-line manifold presented in Fig. 1 under optimum conditions, a linear calibration graph in the range of 0.025–0.5 (0.025, 0.05, 0.1, 0.2 and 0.5) μg mL−1 Hg was found. The linear regression equation for the calibration graph is A = 9.699C + 0.007 (r = 0.999) where A is absorbance and C is concentration of mercury in μg mL−1.
The limit of detection is given by LOD = KSb/m where K is a numerical factor chosen according to the desired confidence level, Sb is the standard deviation of the blank measurements, and m is the slope of the calibration curve. From ten replicate measurements of the blank and a value K = 3, a 0.12 ng mL−1 detection limit was calculated. In order to determine the precision of the proposed method, it was used for the analysis of the standard model solution containing various amounts of Hg under optimum conditions. The relative standard deviation for five replicate determinations of Hg at the 0.025 and 0.2 μg mL−1 levels was 3.9% and 1.4%, respectively.
Interfering ion
In the interference experiments, 0.125 μg mL−1 solutions of Hg(II) containing the added interfering ions, were treated according to the recommended procedure. The results obtained for several foreign species are presented in Table 3. It can be seen that the major metallic species which could be present in natural water and real samples have no obvious influence on the sorption of Hg(II) under the selected conditions.| Interfering ion | Salt | Fold | % Recovery |
|---|---|---|---|
| Na+ | NaCl | 200 | 95 |
| K+ | KCl | 200 | 95 |
| Cl− | NaCl | 200 | 97 |
| SO42− | (NH4)2SO4 | 200 | 94 |
| NO3− | KNO3 | 200 | 95 |
| Mg2+ | MgCl2 | 100 | 98 |
| Ca2+ | CaCl2 | 100 | 97 |
| Zn2+ | Zn(NO3)2 | 50 | 98 |
| Ni2+ | NiSO4 | 50 | 95 |
| Co2+ | Co(NO3)2 | 50 | 96 |
| Fe2+ | FeCl2 | 50 | 97 |
| Cd2+ | Cd(NO3)2 | 50 | 94 |
| Pb2+ | Pb(NO3)2 | 50 | 98 |
| Cu2+ | CuCl2 | 50 | 95 |
Reusability of the column
The mentioned metal ion was sorbed and desorbed on 100 mg of the adsorbent several times. It was found that the sorption capacity of the adsorbent after 15 cycles of equilibration with the metal ion displays no significant changes. Therefore, the repeated use of the adsorbent is feasible as shown in Fig. 6.Applications
In order to evaluate the applicability of the proposed method for the analysis of real samples, it was applied to determine mercury in cabbage, mint, okra and ground water of two villages of the Badin district in Pakistan. Cabbage, mint, okra and ground water samples were subjected to the recommended procedure of the on-line preconcentration and determination of mercury directly and after standard addition. The amount of mercury in all vegetables is within the permissible limits of the WHO (0.03 μg g−1)18 while in both ground water samples it was in excess.19 Table 4 shows the determination of mercury in vegetables and water samples using the proposed method. The accuracy of the procedure was validated by the analysis of certified spinach leaves (NIST 1570A) as shown in Table 5, the values are the average of 5 replicates with a low mean value of RSD (3.4%). This result indicates a good recovery of mercury without significant sample matrix effects, which supports the efficiency of this method for the evaluation of mercury pollution.| Samples | Amount added (ng g−1) | Found | Recovery % |
|---|---|---|---|
| Cabbage | — | 14.0 ± 0.06 ng g−1 | 98.9 |
| 20 | 33.63 ± 0.04 ng g−1 | ||
| Mint | — | 18.6 ± 0.04 ng g−1 | 97.9 |
| 20 | 37.8 ± 0.01 ng g−1 | ||
| Okra | — | 18.7 ± 0.02 ng g−1 | 98.9 |
| 20 | 38.3 ± 0.02 ng g−1 | ||
| Water sample (Village Kadhan) | — | 12.70 ± 0.03 ng mL−1 | 96.6 |
| 20 | 31.6 ± 0.01 ng mL−1 | ||
| Water sample (Village Behedmi) | — | 8.61 ± 0.04 ng mL−1 | 99 |
| 20 | 28.31 ± 0.01 ng mL−1 |
| Certified conc. (μg mL−1) | Conc. found (μg mL−1) | RSD% | Recovery % |
|---|---|---|---|
| 0.03 ± 0.003 | 0.029 ± 0.001 | 3.4 | 96.6 |
Conclusions
A flow injection method for the determination of mercury using on-line solid phase extraction and CV-AAS at the ng level has been developed. This enrichment method is based on the complexation of mercury with dithizone immobilized on alumina coated with ALS. After the optimization studies, mercury was preconcentrated 125 times with recoveries of up to 96%. The developed method is simple, rapid, accurate and economical and can be applied for the determination of mercury in environmental samples. The on-line manifold displays a good reproducibility and reliability of the analytical data, with an RSD value of 3.9% and 1.4% for 0.025 and 0.2 μg mL−1 of mercury, respectively.Notes and references
- G. Leng, L. Feng, S. Li, S. Qian and D. Z. Dan, Environ. Forensics, 2013, 14, 9–15 CrossRef CAS.
- J. Risher and R. DeWoskin, Toxicology Profile for Mercury, ATSDR, Public Health Service, Atlanta, 1999 Search PubMed.
- N. Rajesh and M. S. Hari, Spectrochim. Acta, Part A, 2008, 70, 1104–1108 CrossRef CAS PubMed.
- D. Karunasagar, J. Arunachalam and S. Gangadharan, J. Anal. At. Spectrom., 1998, 13, 679–682 RSC.
- X. Zhu and S. D. Alexandratos, Microchem. J., 2007, 86, 37–41 CrossRef CAS PubMed.
- N. L. D. Filho and D. R. do Carmo, Talanta, 2006, 68, 919–927 CrossRef PubMed.
- X. Li and Z. Wang, Anal. Chim. Acta, 2007, 588, 179–183 CrossRef CAS PubMed.
- P. R. Devi, T. Gangaiah and G. R. K. Naidu, Anal. Chim. Acta, 1991, 249, 533–537 CrossRef CAS.
- N. Ferrua, S. Cerutti, J. A. Salonia, R. A. Olsina and L. D. Martinez, J. Hazard. Mater., 2007, 141, 693–699 CrossRef CAS PubMed.
- M. G. A. Korn, J. B. Andrade, D. J. Jesus, V. A. Lemos, M. L. S. F. Bandeira, W. N. L. Santos, M. A. Bezerra, F. A. C. Amorim, A. S. Souzaand and S. L. C. Ferreira, Talanta, 2006, 69, 16–24 CrossRef CAS PubMed.
- Z. A. Chandio, F. N. Talpur, H. I. Afridi, H. Khan, G. Q. Khaskheli and M. I. Khaskheli, Anal. Methods, 2013, 5, 4425–4429 RSC.
- S. H. Ahmadi, A. M. H. Shabani, S. Dadfarnia and M. Taei, Turk. J. Chem., 2007, 31, 191–199 CAS.
- Y. Zhai, S. Duan, Q. He, X. Yang and Q. Han, Microchim. Acta, 2010, 169, 353–360 CrossRef CAS.
- A. C. Monteiro, L. S. Andrade and R. C. Campos, Fresenius' J. Anal. Chem., 2001, 371(3), 353–357 CrossRef CAS.
- Y. Zhai, X. Chang, Y. Cui, N. Lian, S. Lai, H. Zhen and Q. He, Microchim. Acta, 2006, 154, 253–259 CrossRef CAS.
- Z. A. Chandio, F. N. Talpur, H. Khan, H. I. Afridi and G. Q. Khaskheli, Food Addit. Contam., Part A, 2013, 30, 110–115 CrossRef CAS PubMed.
- P. R. Aranda, S. Moyano, L. D. Martinez and I. E. D. Vito, Anal. Bioanal. Chem., 2010, 398, 1043–1048 CrossRef CAS PubMed.
- P. M. Kuznesof, Summary and conclusions of 53rd Joint FAO/WHO Expert Committee on Food Additives meeting, Rome, 1999 Search PubMed.
- J. K. Fawell, Mercury in Drinking-water, 3rd WHO Guidelines for Drinking-water Quality, Geneva, 2005 Search PubMed.
| This journal is © The Royal Society of Chemistry 2014 |


