DOI:
10.1039/C3RA46389C
(Paper)
RSC Adv., 2014,
4, 3332-3339
Enhanced photocatalytic performance of sensitized mesoporous TiO2 nanoparticles by carbon mesostructures
Received
4th November 2013
, Accepted 25th November 2013
First published on 25th November 2013
Abstract
In this article, sensitized TiO2 photocatalysts were prepared by combining a hydrothermal process with a post-thermaltreatment. Results indicate that the post-thermal treatment is an effective and facile method to promote the photocatalytic activity of the sensitized TiO2. The sensitized TiO2 photocatalysts calcined at an optimum temperature of 400 °C exhibit an enhanced photocatalytic activity, which is mainly related to an appropriate sensitization and the dangling bonds. The dangling bonds can absorb methyl orange (MO) molecules via van der Waals' forces and prevent the recombination of the hole–electron pair by releasing unpaired electrons or capturing other electrons. The released electron is delocalized and promoted into the conduction band by thermal energy and further transferred to O2, thus generating a superoxide radical anion (˙O2−) that is responsible for the degradation of MO in the dark.
Introduction
Titanium dioxide (TiO2) has been widely studied for various applications, such as dye-sensitized solar cells (DSSCs), photocatalysts, electrochemical lithium storage and gas sensors, due to its outstanding physical and chemical properties.1–8 But as a leading candidate photocatalyst, it has some intrinsic drawbacks, such as limited light absorption due to wide band gap and charge carrier recombination, which hinders its efficiency and more widespread applications. Therefore, some significant researches have been carried out for the extension of the spectral response, such as modifying, compositing, doping with nonmetal elements (C, N, S, and I), and forming mesoporous structure.7–20 It is known that the mesoporosity can improve light absorption due to an increased surface area and multiple interparticle scattering that increases the surface adsorption capacity of the reactants, thus leading to the enhancement of the photocatalytic activities.20–30 Recently, significant contributions have been devoted to developing effective non-metal-doped TiO2 photocatalysts to extend its absorbing range into visible light region. Especially, it was reported that the carbon-doping not only can improve the adsorption of the organic pollutant molecules on the catalyst surface greatly, but also can enhance the surface area and conductivity of TiO2, which can facilitate the charge transfer from the bulk of the TiO2 to the surface region where the desired oxidation reaction takes place.8,10,14–17
Herein, we reported a successful preparation of the sensitized mesoporous TiO2, where glucose (C6H12O6) was used as the sensitized source in synthetic route. However, for the large-scale application of the photocatalytic materials, the activity of the sensitized TiO2 needs to be further enhanced. Considering that many carbonaceous organic materials created in the hydrothermal process still exist in the products, a post-thermal treatment is expected to remove these carbonaceous organic materials. It was found that the photocatalytic activities of the thermally calcined samples can be further enhanced due to the sensitization, and the recombination of the electron–hole pair can be effectively inhibited due to the reduction of the defects.
Experimental section
Materials synthesis
Chemicals used in the experiment were tetrabutyl titanate (Ti(OBu)4), ethanol, sodium chloride, and glucose (C6H12O6). Distilled water was also used in whole preparation process.
In a typical synthesis, appropriate amounts of Ti(OBu)4 were dropwise added into a mixture of ethanol (50 mL) and sodium chloride solution (0.2 mL 0.1 M) to obtain a turbid solution under a magnetic stirring. Until the mixture solution turned white, appropriate amounts of C6H12O6 were added into the solution. After stirring about 30 min, the solution was mixed with 20 mL H2O in a 100 mL autoclave Teflon vessel and hydrothermally calcined at 180 °C for 48 h. The obtained sample was then filtered, washed with alcohol three times, and dried at 60 °C to get the final sensitized TiO2 without further treatment, and was labeled as ST1. It should be noted here that the molar ratio of Ti(OBu)4 to C6H12O6 was controlled at 10![[thin space (1/6-em)]](https://www.rsc.org/images/entities/char_2009.gif) :
:![[thin space (1/6-em)]](https://www.rsc.org/images/entities/char_2009.gif) 1. To investigate an effect of the post-thermal treatment on the sensitized TiO2, the as-prepared samples were calcined in air for 2 h in a muffle furnace at 200, 300, 400 and 500 °C, respectively, and the corresponding samples were labeled as ST2, ST3, ST4 and ST5. In addition, commercial Degussa P25 TiO2 (anatase
1. To investigate an effect of the post-thermal treatment on the sensitized TiO2, the as-prepared samples were calcined in air for 2 h in a muffle furnace at 200, 300, 400 and 500 °C, respectively, and the corresponding samples were labeled as ST2, ST3, ST4 and ST5. In addition, commercial Degussa P25 TiO2 (anatase![[thin space (1/6-em)]](https://www.rsc.org/images/entities/char_2009.gif) :
:![[thin space (1/6-em)]](https://www.rsc.org/images/entities/char_2009.gif) rutile = 75
rutile = 75![[thin space (1/6-em)]](https://www.rsc.org/images/entities/char_2009.gif) :
:![[thin space (1/6-em)]](https://www.rsc.org/images/entities/char_2009.gif) 25) with a specific surface area of 55 m2 g−1 and primary particle size of 20 nm were also used for comparison purposes.
25) with a specific surface area of 55 m2 g−1 and primary particle size of 20 nm were also used for comparison purposes.
Characterization
Crystalline properties of the as-prepared samples were characterized by powder X-ray diffractometry (D/max-2200, Rigaku, Japan) using Cu Kα as radiation. Morphology, structure, and grain size of the samples were examined by scanning electron microscopy (SEM, S4800, Japan) with an accelerating voltage of 1.0 kV and transmission electron microscopy (TEM, JEM-2010, Japan) with an accelerating voltage of 200 kV. TEM samples were dispersed in ethanol ultrasonically, and then a drop of liquid was dropped on a thin amorphous carbon film supported by the copper grid. Composition of the products was performed using X-ray photoelectron spectroscopy (XPS, Axis Ultra, UK), which employs a monochromatic Al Kα radiation (150 W, 15 kV, 1486.6 eV) under a vacuum pressure of 10−9 Torr, where all the binding energies were referenced to the C1s peak (284.80 eV) from hydrocarbons adsorbed on the surface of the samples. UV-Vis diffuse reflection spectra of the dry-pressed disk samples were obtained by using a scan UV-Vis spectrophotometer (UV/vis/NIR, JASCO Model V-570, Japan) equipped with an integrating sphere assembly, using BaSO4 as the reflectance sample. The spectra were recorded in a range from 200 to 800 nm at room temperature in air. Fourier transform infrared (FTIR) spectra of the samples were obtained with a spectrophotometer (V70, Bruker). The surface areas of the samples were obtained from a nitrogen adsorption apparatus (V-Sorb 2800P, China), and all samples were degassed at 100 °C prior to measurements.
Photocatalytic activity measurements
Degradation of methyl orange (MO) solution with a water cooling system was carried out to study photocatalytic activities of the as-prepared samples. 100 mL MO solution with an initial concentration of 20.0 mg L−1 and 0.02 g TiO2 photocatalysts were mixed under a magnetic stirring for about 30 min in dark to approach an adsorption–desorption equilibrium. Then the reaction system was illuminated by a 300 W Hg lamp at room temperature. Intermediate solutions were collected every 20 min and separated by filtration to test the remaining concentration of MO by using a Lambda 950 spectrophotometer.
Results
Photocatalytic activity of the sensitized TiO2 nanoparticles
Photocatalytic activities of the as-prepared samples are evaluated by degradation of methyl orange (MO). As for comparison, the photocatalystic activities of pure TiO2 samples calcined at different temperatures were also given in Fig. 1A. Fig. 1B shows a change of the relative concentration of MO with irradiation time for the sensitized TiO2 samples calcined at different temperatures. Its kinetics can be expressed by the following formula: C = C0e−kt, where k (min−1) is the degradation rate constant, C is the MO concentration at reaction time t, and C0 is the MO initial concentration.20 According to this formula, degradation rate constants (k) of the samples are calculated and their values are shown in Fig. 1C. It can be seen that the sensitized samples exhibit a decent photocatalytic activity as compared to the un-doped one, and ST4 sample exhibits the highest photocatalytic activity (k, 0.309 min−1) in all measured samples. As shown in our previous study, carbon-doping can reduce the band gap of TiO2 to increase absorption in the visible region and play a role in a formation of the mesoporous structure, which provides the sensitized TiO2 with an efficient photocatalytic activity.7,18 If the reaction constant k is normalized by the surface area, the increase of the activity under light irradiation is more obvious as shown in Fig. 1A. These results indicate that the doping of carbon not only makes TiO2 visible-light-sensitive but also promotes the activity under light irradiation.14–17 For the sensitized TiO2 calcined at 300 or 400 °C, the activity of the sample is markedly enhanced, although the specific surface area and the pore volume of these samples have a slight decrease as presented in Table 1. After an optimized treatment, the sample ST4 exhibits the highest activity (k, 0.309 min−1), which is almost 4 times higher than that of the pristine sensitized TiO2 (ST1) (k, 0.076 min−1). However, it also should be noted that the sample ST5 shows a little decreased activity as compared with the samples ST3 and ST4 (same as that of P25). In addition, the sensitized samples also show some activities for the degradation of the MO in the dark. By the way, the stability of the sensitized photocatalysts was also investigated by a repeating measurement of the photocatalytic degradation of MO. It is found that after seven repeating experiments for the photocatalytic degradation of the MO, the degradation efficiencies of the ST3 and ST4 samples are rather stable and can keep above 60% as shown in Fig. 1D. The photocatalytic activities will be further discussed.
 |
| | Fig. 1 Photocatalytic activities (in the degradation of MO) of the sensitized TiO2 photocatalysts calcined at different temperatures: (A) pure TiO2 photocatalysts; (B) sensitized TiO2 photocatalysts; (C) comparison of the corresponding reaction constants (min−1); (D) reuse of different photocatalysts after irradiated for 100 min. | |
Table 1 Phase structure, TiO2 content, BET surface area and pore volume of the samples
| Sample |
Phase |
TiO2 contenta (%) |
Crystal sizeb (nm) |
Surface areasc (m2 g−1) |
Pore volumec (cm3 g−1) |
| By TG. By XRD. By BET. |
| P25 |
Anatase (75%), rutile (25%) |
95.32 |
21 |
54.43 |
0.221 |
| Pure |
Anatase |
96.44 |
20 |
72.85 |
0.226 |
| ST1 |
Anatase |
61.81 |
12.6 |
85.42 |
0.252 |
| ST2 |
Anatase |
76.73 |
13.0 |
96.54 |
0.284 |
| ST3 |
Anatase |
83.50 |
13.2 |
106.48 |
0.324 |
| ST4 |
Anatase |
93.23 |
13.4 |
111.52 |
0.319 |
| ST5 |
Anatase |
94.84 |
14.5 |
104.11 |
0.306 |
Morphology and crystal structure of the photocatalysts
It is noted during the thermal treatment that the powders are first black, brownish black, then gray, and white at last. To investigate the morphological properties, SEM and TEM analysis was conducted for the sensitized TiO2 photocatalysts (ST4) as shown in Fig. 2 and 3. As seen from the SEM images, the sensitized TiO2 photocatalysts possess a rough surface, just look like as cauliflowers. The characters like cauliflowers are vividly presented in the Fig. 2D. Fig. 3A indicates that the sample consists of large amounts of monodispersed nanoparticles with a size range from 12 to 15 nm. Intra aggregation of the nanoparticles can form a mesoporous structure like cauliflowers. HRTEM image as shown in Fig. 3B shows that the nanoparticles have a sphere shape and are highly crystallized with a well-resolved lattice structure. The observed spacing between the lattice plane of the sample ST4 is obtained and its value is 0.36 nm, which corresponds to the (101) plane of the anatase TiO2 crystal, indicating the monodispersed nanoparticles are single crystal with anatase structure.8
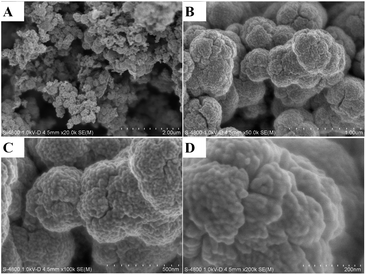 |
| | Fig. 2 SEM images of the sensitized TiO2 photocatalysts calcined at 400 °C for 2 h (ST4 sample). | |
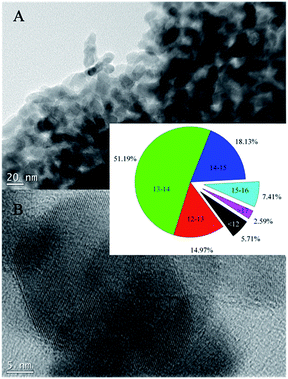 |
| | Fig. 3 TEM images of the sensitized TiO2 photocatalysts calcined at 400 °C for 2 h (ST4 sample). | |
Fig. 4 shows XRD patterns of the samples before and after calcinations at different temperatures. All diffraction peaks of the samples can be indexed as anatase phase (JCPDS no. 21-1272, I41/amd, a = b = 3.785 Å, c = 9.514 Å). For example, those peaks at scattering angles of 25.26, 36.94, 48.05, 53.89, 55.06 and 62.68° correspond to the reflections from the (101), (004), (200), (105), (211) and (204) crystal planes of the anatase TiO2, respectively.22 High-temperature calcination can enhance crystallinity of the TiO2 powders and the highest crystallinity of the products can be achieved after a calcination of 500 °C. Average crystallite sizes of the samples are calculated according to the Scherrer equation by using the full width at half maximum (FWHM) data of their XRD patterns after correcting the instrumental broadening,14,22 and their values are 12.6, 13.0, 13.2, 13.4, 14.5 nm for samples ST1, ST2, ST3, ST4, ST5, respectively. Furthermore, these results are also presented in Table 1, which is consistent with the TEM results. According the low-angle XRD patterns of the samples ST1 and ST4, it presents that there is a peak located around 1.3° in the patterns, thus indicating that the samples ST1 and ST4 also have the mesoporous structural properties.22
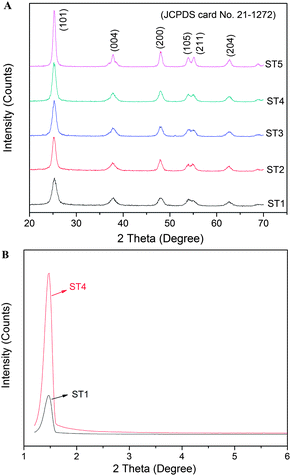 |
| | Fig. 4 XRD patterns of the sensitized TiO2 photocatalysts calcined at different temperatures (A); low-angle XRD patterns of the samples ST1 and ST4 (B). | |
Mesoporous structure analysis of the sensitized photocatalysts
Fig. 5 shows the nitrogen adsorption–desorption isotherm and BJH pore size distribution curve (inset) of the sensitized TiO2 (sample ST4). It exhibits a type IV adsorption isotherm with a H2 hysteresis loop, which is a typical characterization of the mesoporous materials.22,29 The narrow pore size distribution curve implies that the materials have very uniform pore channels in the mesoporous region. The Brunauer–Emmett–Teller (BET) specific surface areas and the pore volumes of the sensitized TiO2 and the undoped TiO2 are summarized in Table 1. The surface areas of the sensitized TiO2 are 85.42, 96.54, 106.48, 111.52, 104.11 m2 g−1, respectively, and they are obtained by a calculation from the linear part of the Brunauer–Emmett–Teller (BET) plots. The specific surface area of the un-doped TiO2 is 72.85 m2 g−1, which is lower than those of the sensitized TiO2 photocatalysts. These results indicate that the incorporation of the carbon can slightly improve the surface areas of the mesoporous TiO2 (Fig. 6).
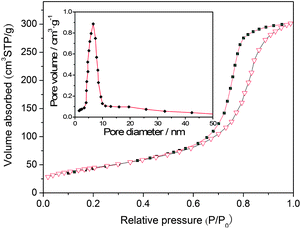 |
| | Fig. 5 Nitrogen adsorption–desorption isotherm and pore size distribution curve (inset) of the sensitized TiO2 photocatalysts (ST4 sample). | |
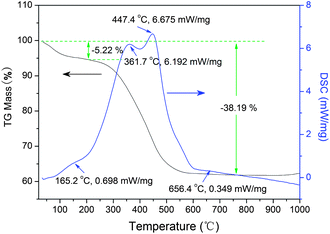 |
| | Fig. 6 TG and DSC curves of the sensitized TiO2 photocatalysts (sample ST1) before calcination. | |
Thermal behavior of the sensitized photocatalysts
The small exothermal peak around 160 °C is due to the decom-position of the physically adsorbed water.31 The broad exothermal peak appeared in the temperature range between 200 and 600 °C is assigned to the decomposition of the carbonaceous organic substances in the powder. The relative broad exothermal peak at 656 °C is related to the phase transformation from anatase to rutile. The TG curve can be divided into three stages. The first stage is a range from room temperature to 200 °C with a mass loss of 5.22%, which represents the dehydration and loss of the residual solvent. In the temperature range from 200 to 750 °C, the mass loss is about 33%, which is attributed to the loss of those organic substances, corresponding to a sharp exothermal process of DSC curve. It can be concluded from TG–DSC results that the phase of the obtained sample is mainly anatase and over 30% of the carbonaceous organic substances exit in the ST1 sample. In addition, the TiO2 content in sensitized powder were also give in Table 1 base on TG measurement results.
Measurement of chemical status and electronic structure
XPS spectra of the as-prepared powders were also fitted with the nonlinear least-squares fit program using Gauss–Lorentzian peak shapes as shown in Fig. 7. Fig. 7a shows the C1s spectra of the sensitized TiO2 samples calcined at different temperatures. A broad energy range from 290 to 282 eV can be clearly observed in the curves of the ST1 sample, and the peaks at 283.2, 284.8 and 285.6 eV can be assigned to adventitious carbon species from the XPS measurement. Accordingly, the C 1s peak at 283.2 eV can be ascribed to the carbon substituting for the oxygen atom in the lattice of TiO2, which forms the O–Ti–C bond.16,17,29 As the electro-negativity of oxygen is larger than that of carbon, the binding energy of titanium in the O–Ti–C bond increases as compared to that in the Ti–C bond in TiC.14,15 The contents of the doped carbon in samples ST1 and ST2 are determined to be 1.46 and 2.40 at %, respectively, which indicates that the post-thermaltreatment of the sensitized TiO2 can increase the content of the doped carbon through surface reconstruction. The carbon on the C–TiO2 surface can be doped into the lattice during the thermal treatment. The peak located at 288.1 eV is close to the –C–C– from the glucose or other carbonaceous organic materials created in the hydrothermal process. The peak around 288 eV disappears when calcined at 300 °C or above for 2 h, that is to say, this peak does not exist in samples ST3, ST4 and ST5, and only one peak located at 284.6 eV, which can be ascribed to adventitious carbon species, is observed. Fig. 7b shows the O 1s spectra of the C–TiO2 samples. The binding energies, which are at 530.6, 532.1, and 533.1 eV, can be ascribed to Ti–O, surface –OH, and adsorbed H2O, respectively.30 The peak at 533.1 eV disappears after being calcined at 200 °C or above for 2 h, indicating that the absorbed H2O is lost during the post-thermal treatment. The atomic content of nitrogen in the samples was also calculated from the XPS and is presented in Table 2, which samples ST1, ST2, ST3, ST4 and ST5 have carbon contents of 1.46, 2.40, 6.00, 4.98, and 3.95 at%, respectively.
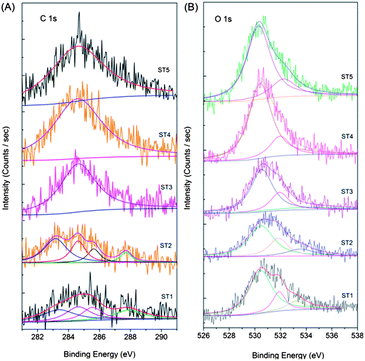 |
| | Fig. 7 Comparison of high-resolution XPS spectra of C 1s (A), O 1s (B) for the sensitized TiO2 photocatalysts calcined at different temperatures. | |
Table 2 Surface chemical composition of the sensitized TiO2 samples obtained by XPS analysis
| |
C |
O |
Ti |
| AT% |
Center |
AT% |
Center |
AT% |
Center |
FWHM |
| ST1 |
1.46 |
284.80 |
61.15 |
530.0 |
36.39 |
459.50 |
3.30 |
| ST2 |
2.40 |
284.80 |
53.15 |
530.15 |
45.45 |
458.75 |
2.95 |
| ST3 |
6.00 |
284.80 |
53.62 |
530.35 |
40.39 |
459.15 |
2.75 |
| ST4 |
4.98 |
284.80 |
55.34 |
530.20 |
39.68 |
459.20 |
2.55 |
| ST5 |
3.95 |
284.80 |
58.30 |
530.55 |
37.75 |
458.85 |
2.85 |
Fourier transform infrared spectra of the samples are shown in Fig. 8. The peaks at about 3400 and 1630 cm−1 with similar intensities are associated with the stretching vibrations of water molecules, including hydroxyl groups and molecular water on the surface of TiO2. Another band located around 1115 cm−1 is reasonably attributed to the C–H bonds from the carbonaceous organic substances created in the hydrothermal process.22,26 The characteristic peaks at 482 and 612 cm−1 of the Ti–O bond stretching vibration can be clearly observed, especially in the ST4 and ST5, which further confirms that the crystallinity of the as-prepared samples can be enhanced by the calcination.14 In addition, a broad and flat absorption band in wavelength range from 700 to 460 cm−1 should be due to a quantum effect of the nanoparticle size, that is, the fine structure of the infrared absorption band disappears.22
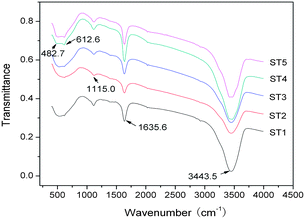 |
| | Fig. 8 FT-IR spectra of the sensitized TiO2 photocatalysts calcined at different temperatures. | |
Measurement of light absorption
Fig. 9 shows the light absorption properties of the sensitized TiO2 samples calcined at different temperatures. It can be seen that the absorption spectra of the sensitized TiO2 are characteristic of the photocatalysts. Due to being sensitized by the carbon mesostructure, the sample ST1 shows a red shift as compared with other samples. Assuming the sensitized TiO2 is a single component semiconductor with a direct band gap, optical band gap of the TiO2 products can be estimated from the UV-Vis absorbance spectra of the samples. The relationship between the absorption coefficient (α) and the photon energy (hv) can be expressed by using equation: (αhv)2 = B(E − Eg), where B is a constant related to the effective mass associated with the valence and conduction band, Eg is band gap energy, and E is the photon energy as defined by E = hv.32–34 Since the absorption spectra of the samples as shown in Fig. 9 are all nearly identical, indicating that their optical band gaps are almost the same. Hence, Eg for the sensitized TiO2 products can be calculated by extrapolating the linear portion of (αhv)2 versus (hv) plot to α = 0. Thus, the optical band gaps of the sensitized and pure TiO2 products are obtained and their values are 2.99, 3.00, 3.01, 3.03, 3.04, 3.16 eV, respectively. These results indicate that the edge of the absorption from the UV-Vis spectra shows the blue shift after the post thermal treatments.
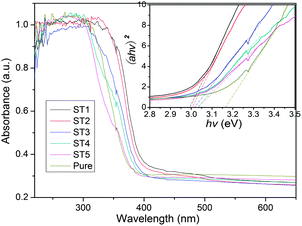 |
| | Fig. 9 UV-Vis absorbance spectra of the sensitized TiO2 photocatalysts calcined at different temperatures. | |
Discussion
Based on above results, new perspective is proposed to explain the different photocatalytic activities of the sensitized photocatalysts. The reactions may occur during the prepareation and photocatalytic process of the photocatalysts as follows:| | |
TiO2⋯C* → TiO2⋯ + C* + CO2 + H2O
| (4-1) |
| | |
TiO2⋯C* → TiO2 + CO2 + H2O
| (4-2) |
| | |
TiO2⋯ + C14H14N3SO3Na → TiO2⋯C14H14N3SO3Na + CO2 + H2O
| (4-3) |
| | |
C* + e− + O2 → ˙O2− + C*
| (4-4) |
| | |
˙O2− + C14H14N3SO3Na → CO2 + H2O
| (4-5) |
Assuming: the photocatalytic degradation of the MO has a relationship with the sensitized surface. Schematic drawing as shown in Fig. 10 clearly presents the assumption for the sensitized surface. At first, there are many carbonaceous organic groups absorbed on the TiO2 nanoparticles' surface, which can be used to explain why the sample ST1 is black. After further thermal treatment, the carbonaceous organic groups will gradually become CO2 or H2O and separate from the surface of the sensitized TiO2. During this process, the colors become dark grey, grey, and white grey, white for the samples ST2, ST3, ST4, ST5, respectively. Also there are many dangling bonds formed on the surface due to loss of the organic groups. The dangling bonds can exist in two charged states: one is positively charged center formed by releasing the unpaired electrons, the other is negatively charged center formed by capturing a second electron. The dangling bonds also can absorb the MO molecules by van der Waals' force and enhance the reaction with the MO molecules.35 In addition, the dangling bonds can prevent the recombination of the hole–electron pair by releasing unpaired electrons or capturing other electrons. Thus, one major reaction pathway can be considered under light irradiation: the dangling bonds act as the photosensitizers, which can reduce the band gap of TiO2 to increase absorption as shown in the UV-Vis spectra (also shown in Formula 4-3).
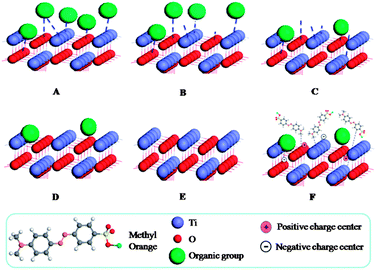 |
| | Fig. 10 Schematic illustration of the sensitized TiO2 photocatalysts during the post-thermal treatment and the photocatalytic oxidation of methyl orange. | |
As shown in Fig. 11, in the presence of light, the excited photosensitizer injects an electron into the conduction band of TiO2. Subsequently, the electron is transferred to oxygen adsorbed on the TiO2 surface to produce ˙O2−, which is capable of the degrading organic compounds.30 After a series of reactions, the MO molecules are finally degraded into CO2 and H2O. Actually, ST1 exhibits a lower activity under light irradiation among all sensitized TiO2 samples since many carbonaceous organic materials exist in the products. For the sensitized TiO2 calcined at 300 and 400 °C (ST3, ST4), their photocatalytic activities are obviously enhanced, which is attributed to the slightly increase of the specific surface area (as presented in Table 1) and the dangling bonds.28 However, ST5 shows a little decrease photoactivity as compared with ST3 and ST4, it is probably due to that its sensitized surface is destroyed, as well as the specific surface area is slightly decreased. Among these measured samples, ST3 and ST4 may have more dangling bonds (as shown in Formula 4-1), while the ST5 will become anatase TiO2 without sensitization effect (as shown in Formula 4-2). This could explain why the ST5 show a lower activity as compared to ST3 or ST4 (almost same as P25). The highest photocatalytic activity of ST4 may be attributed to appropriate sensitization and dangling bonds exist on the surface as shown in Fig. 10F. A free electron, which is captured by the dangling bonds on sensitized surface, is delocalized and promoted into the conduction band by thermal energy and further transferred to O2, generating a superoxide radical anion (˙O2−) that is responsible for degradation of MO in dark (as shown in Formula 4-4 and 4-5). So, the sensitized TiO2 photocatalysts show a good performance on degradation of MO in dark during 40 min to 60 min.
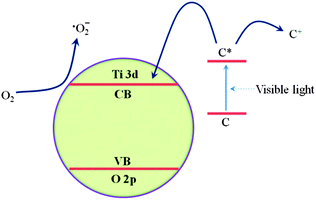 |
| | Fig. 11 Proposed electron transfer pathway to produce superoxide radical anion, ˙O2− on sensitized TiO2 particles under visible light irradiation (C refers to carbonaceous organic materials exist in the sensitized TiO2). | |
Conclusions
Mesoporous sensitized TiO2 photocatalysts have been successfully prepared from the hydrothermal process by using glucose as a carbon-doping source. Post-thermal treatment has been confirmed to be an effective and facile sensitized method to promote the photocatalytic activity of the TiO2 nanoparticles. The dangling bonds act as photosensitizers, which can reduce the band gap of TiO2 to improve light absorption. The dangling bonds not only can absorb MO molecules by van der Waals' force and enhance the reaction with MO molecules, but also can prevent the recombination of the hole–electron pair by releasing unpaired electrons or capturing other electrons. This may be a new perspective to consider the doped photocatalysts.
Acknowledgements
This work was supported by the Research Fund for the Doctoral Program of Higher Education of China under grant 20120201130004, the National Natural Science Foundation of China under Grant no. 61078058, the Science and Technology Developing Project of Shaanxi Province (2012KW-11) and the Fundamental Research Funds for the Central Universities. The SEM work was done at International Center for Dielectric Research, Xi'an Jiaotong University, Xi'an, China. The authors also thank Ms Dai for her help in using SEM.
Notes and references
- K. Zhu, N. R. Neale, A. Miedaner and A. J. Frank, Nano Lett., 2007, 7, 69–74 CrossRef CAS PubMed.
- L. Etgar, P. Gao, Z. S. Xue, Q. Peng, A. K. Chandiran, B. Liu, M. K. Nazeeruddin and M. Gratzel, J. Am. Chem. Soc., 2012, 134, 17396–17399 CrossRef CAS PubMed.
- M. El-Roz, Z. Haidar, L. Lakiss, J. Toufaily and F. Thibault-Starzyk, RSC Adv., 2013, 3, 3438–3445 RSC.
- J. F. Montoya, J. A. Velásquez and P. Salvador, Appl. Catal., B, 2009, 88, 50–58 CrossRef CAS PubMed.
- Q. J. Li, J. W. Zhang, B. B. Liu, M. Li, R. Liu, X. L. Li, H. L. Ma, S. D. Yu, L. Wang, Y. G. Zou, Z. P. Li, B. Zou, T. Cui and G. T. Zou, Inorg. Chem., 2008, 47, 9870–9873 CrossRef CAS PubMed.
- Y. Q. Zhu, S. Chen, X. Quan and Y. B. Zhang, RSC Adv., 2013, 3, 520–525 RSC.
- Z. L. He, W. X. Que, H. X. Xie, J. Chen, Y. Yuan and P. Sun, J. Am. Ceram. Soc., 2012, 95(12), 3732–3946 CrossRef.
- K. Selvam and M. Swaminathan, RSC Adv., 2012, 2, 2848–2855 RSC.
- K. Lv, B. Cheng, J. Yu and G. Liu, Phys. Chem. Chem. Phys., 2012, 14, 5349–5362 RSC.
- X. J. Xu, T. Y. Zhai, M. H. Shao and J. Z. Huang, Phys. Chem. Chem. Phys., 2012, 14, 16371–16376 RSC.
- S. Sajjad, S. A. K. Leghari and J. L. Zhang, RSC Adv., 2013, 3, 12678–12687 RSC.
- S. M. Chang and W. S. Liu, Appl. Catal., B, 2011, 101, 333–342 CrossRef CAS PubMed.
- X. B. Chen and C. Burda, J. Am. Chem. Soc., 2008, 130, 5018–5019 CrossRef CAS PubMed.
- F. Dong, H. Q. Wang and Z. B. Wu, J. Phys. Chem. C, 2009, 113, 16717–16723 CAS.
- F. Dong, S. Guo, H. Q. Wang, X. F. Li and Z. B. Wu, J. Phys. Chem. C, 2011, 115, 13285–13292 CAS.
- W. Wei, C. Yu, Q. F. Zhao, G. S. Li and Y. Wan, Chem.–Eur. J., 2013, 19(2), 566–577 CrossRef CAS PubMed.
- G. N. Wang, X. F. Wang, J. F. Liu and X. M. Sun, Chem.–Eur. J., 2012, 18(17), 5361–5366 CrossRef CAS PubMed.
- Z. He, W. Que, J. Chen, Y. He and G. Wang, J. Phys. Chem. Solids, 2013, 74, 924–928 CrossRef CAS PubMed.
- S. Liu, E. Guo and L. Yin, J. Mater. Chem., 2012, 22, 5031–5041 RSC.
- Z. He, W. Que, J. Chen, X. Yin, Y. He and J. Ren, ACS Appl. Mater. Interfaces, 2012, 4(12), 6816–6826 CAS.
- D. Zhao, G. Sheng, C. Chen and X. Wang, Appl. Catal., B, 2012, 111–112, 303–308 CrossRef CAS PubMed.
- Z. He, Z. Zhu, J. Li, N. Wei and J. Zhou, J. Hazard. Mater., 2011, 190, 133–139 CrossRef CAS PubMed.
- V. Belessi, D. Lambropoulou, I. Konstantinou, A. Katsoulidis, P. Pomonis, D. Petridis and T. Albanis, Appl. Catal., B, 2007, 73, 292–299 CrossRef CAS PubMed.
- Z. He, W. Que and Y. He, Mater. Lett., 2013, 94, 136–139 CrossRef CAS PubMed.
- X. Xu, X. Fang, T. Zhai, H. Zeng, B. Liu, X. Hu, Y. Bando and D. Golberg, Small, 2011, 7, 445–449 CrossRef CAS PubMed.
- Z. He, W. Que, Y. He, J. Chen, H. Xie and G. Wang, J. Mater. Sci., 2012, 47, 7210–7216 CrossRef CAS.
- Z. He and W. Que, Phys. Chem. Chem. Phys., 2013, 15, 16768–16733 RSC.
- W. Ren, Z. Ai, F. Jia, L. Zhang, X. Fan and Z. Zou, Appl. Catal., B, 2007, 69, 138–144 CrossRef CAS PubMed.
- Y. Huang, W. K. Ho, S. C. Lee, L. Z. Zhang, G. S. Li and J. C. Yu, Langmuir, 2008, 24, 3510–3516 CrossRef CAS PubMed.
- X. X. Yang, C. D. Cao, K. Hohn, L. Erickson, R. Maghirang, D. Hamal and K. Klabunde, J. Catal., 2007, 252, 296–302 CrossRef CAS PubMed.
- J. J. Xu, Y. H. Ao, D. G. Fu and C. W. Yuan, Appl. Surf. Sci., 2008, 254, 3033–3038 CrossRef CAS PubMed.
- M. Abaker, A. Umar, S. Baskoutas, S. H. Kim and S. W. Hwang, J. Phys. D: Appl. Phys., 2011, 44, 155405 CrossRef.
- M. Abaker, A. Umar, S. Baskoutas, G. N. Dar, S. A. Zaidi, S. A. Al-Sayari, A. Al-Hajry, S. H. Kim and S. W. Hwang, J. Phys. D: Appl. Phys., 2011, 44, 425401 CrossRef.
- A. Umar, M. Abaker, M. Faisal, S. W. Hwang, S. Baskoutas and S. A. Al-Sayari, J. Nanosci. Nanotechnol., 2011, 11, 3474–3480 CrossRef CAS PubMed.
- C. Ye, S. Hu, W. Yan, J. M. Duan and C. Y. Jing, J. Phys. Chem. C, 2013, 117, 5785–5791 CAS.
|
| This journal is © The Royal Society of Chemistry 2014 |
Click here to see how this site uses Cookies. View our privacy policy here. ![[thin space (1/6-em)]](https://www.rsc.org/images/entities/char_2009.gif) :
:![[thin space (1/6-em)]](https://www.rsc.org/images/entities/char_2009.gif) 1. To investigate an effect of the post-thermal treatment on the sensitized TiO2, the as-prepared samples were calcined in air for 2 h in a muffle furnace at 200, 300, 400 and 500 °C, respectively, and the corresponding samples were labeled as ST2, ST3, ST4 and ST5. In addition, commercial Degussa P25 TiO2 (anatase
1. To investigate an effect of the post-thermal treatment on the sensitized TiO2, the as-prepared samples were calcined in air for 2 h in a muffle furnace at 200, 300, 400 and 500 °C, respectively, and the corresponding samples were labeled as ST2, ST3, ST4 and ST5. In addition, commercial Degussa P25 TiO2 (anatase![[thin space (1/6-em)]](https://www.rsc.org/images/entities/char_2009.gif) :
:![[thin space (1/6-em)]](https://www.rsc.org/images/entities/char_2009.gif) rutile = 75
rutile = 75![[thin space (1/6-em)]](https://www.rsc.org/images/entities/char_2009.gif) :
:![[thin space (1/6-em)]](https://www.rsc.org/images/entities/char_2009.gif) 25) with a specific surface area of 55 m2 g−1 and primary particle size of 20 nm were also used for comparison purposes.
25) with a specific surface area of 55 m2 g−1 and primary particle size of 20 nm were also used for comparison purposes.


