Analysis of vibrational spectra of solid-state adenine and adenosine in the terahertz region†
Feng
Zhang
a,
Ohki
Kambara
b,
Keisuke
Tominaga
*ac,
Jun-ichi
Nishizawa
*d,
Tetsuo
Sasaki
b,
Houng-Wei
Wang
e and
Michitoshi
Hayashi
*e
aDepartment of Chemistry, Graduate School of Science, Kobe University, Kobe 657-8501, Japan. E-mail: tominaga@kobe-u.ca.jp
bResearch Institute of Electronics, Shizuoka University, 3-5-1 Jyohoku, Naka-ku, Hamamatsu, Shizuoka 432-8561, Japan
cMolecular Photoscience Research Center, Kobe University, Kobe 657-8501, Japan
dSemiconductor Research Institute, Sophia University, Tokyo 102-8554, Japan. E-mail: nishizawa@hanken.jp; atmyh@ntu.edu.tw
eCenter for Condensed Matter Sciences, National Taiwan University, 1 Roosevelt Rd. Sec. 4, Taipei 10617, Taiwan
First published on 3rd October 2013
Abstract
The low-frequency vibrations of crystalline adenine and adenosine were studied by 5 K terahertz (THz) spectroscopy and solid-state density functional theory (DFT) based on a harmonic model. The accuracy of the calculations was assessed from aspects of frequencies and isotope shifts. The anharmonicity of the potential surface was discussed by observing the thermal shift of the sequence bands. An analytical method was proposed for quantifying the contributions of the intermolecular and intramolecular motions to the normal modes. Adenine exhibited weak coupling between the intermolecular and intramolecular vibrations. The adenine and ribose moieties of adenosine, which are linked through a glycosidic bond, showed intense relative vibrations strongly coupled with the intermolecular vibrations. This finding reveals that adenosine has high flexibility, which arises from the glycosidic bond. An experimental method was further proposed to identify the intermolecular or intramolecular modes.
Introduction
There has been increasing interest in using terahertz (THz) spectroscopy to study the low-frequency dynamics of nucleic acids and proteins. THz spectroscopy provides direct picosecond and sub-picosecond measurements of the dynamics of macromolecules, which undergo large-amplitude atomic motions and are closely related to various biological functions.1,2 Recently, the relationship between protein secondary structures and their THz spectra has been demonstrated,3,4 and the hydration effect of proteins has been observed in THz spectra.5–9 Nevertheless, much research is still required to arrive at a thorough interpretation of the THz spectra for these complex systems.Theoretical solid-state frequency calculations for complex macromolecular systems are still computationally costly, even for molecular dynamics simulations, let alone for ab initio calculations. Experimentally, resolving specific modes from the broad profiles of THz macromolecule spectra is problematic. Under normal conditions, macromolecules tend to condense in an amorphous state, which produces the featureless absorption of the density of state in THz spectra.1,3–13 Even in the crystalline state, which restricts the IR absorption at the gamma point, there are many normal modes which interfere with the THz spectra, and the overlapping signals obscure the band line shapes.14
Against this backdrop, small biomolecules – the building blocks for macromolecules – have attracted intense interest.15–26 Understanding the vibrations of small molecules is an essential step for tackling dynamic problems involving larger hierarchical structures. Furthermore, the experimental and theoretical considerations for studying small molecules are much more tractable. They tend to form crystals under normal conditions, and only limited numbers of normal modes at the gamma point are visible in the THz spectra. The bands can usually be distinguished and the broadening effect is less pronounced. The rich dynamical information extracted from the band frequencies, band broadening, and thermal and isotopic shifts are expected to provide a reliable method for evaluating the accuracy of the theoretical calculations.
With the development of THz spectroscopic technologies and solid-state density functional theory (DFT) calculation methods, much effort has been devoted to elucidating the low-frequency vibrations of the constituent molecules of nucleic acids. The THz spectra of a number of nucleobases and nucleosides have been measured.18–20 More recently, King et al. prepared a series of polycrystalline base pairs, which are a model for the stacking structures of double helix conformations of DNA. Solid-state DFT calculations were performed to assign the THz peaks for these systems, and showed that nucleobases vibrate like rigid bodies in the low-frequency region.21,22
In this work we try to illustrate the low-frequency vibrational motion of polycrystalline adenosine, which consists of an adenine linked to a ribose moiety though a β-glycosidic bond, a large building block of DNA with more flexibility than nucleobases. Adopting a stacking structure of the purine rings in a crystalline state, adenosine serves as a prototype system to preliminarily resemble the vibrational dynamics of nucleic acids. A thorough interpretation of the vibrations of adenosine may allow a better understanding of the dynamics of nucleic acids. In addition, the THz spectra of polycrystalline adenine was studied for comparison. The THz spectra of polycrystalline adenine and adenosine were measured from 30 to 200 cm−1 at 5 K and compared with the theoretical calculations at 0 K. The thermal energy, kT, at 5 K is 3.5 cm−1; therefore, only the ground energy states for normal modes beyond 30 cm−1 are populated (>99%). Hence the 5 K spectra detected the fundamental transition (v = 0 → 1). The assignment of the THz band was performed by the solid-state DFT method using CRYSTAL09,27,28 in which all-electron atom-centered Gaussian basis sets were used to construct Bloch wave functions. Using the same method as in our previous work on 2-furoic acid and anthracene,24,25 the THz spectra of deuterated polycrystalline adenine and adenosine were also recorded to obtain the isotopic shift, which was used to assess the calculation results. Finally, an analytical method was used to quantitatively characterize the intermolecular and intramolecular motions in the normal modes.
Experimental
Protonated adenine and adenosine were purchased from Sigma-Aldrich and used without further purification. Deuterated adenine and adenosine were recrystallized from hot deuterium oxide. The deuterium substitution was confirmed by observing the disappearance of the O–H and N–H stretch bands with ATR-FTIR spectroscopy. The ATR-FTIR spectra are shown in the ESI.† Three hydrogen atoms in the O–H and N–H groups in adenine and five in adenosine were exchanged with deuterium. The deuteration yield was greater than 95% for adenine and adenosine.Two THz setups were used in this work. One was used to generate a broad THz radiation band (20–200 cm−1) based on difference frequency mixing.29,30 Two near-IR beams emitted from two independent Cr:forsterite lasers were combined in an undoped GaP crystal under small-angle noncollinear phase-matching conditions. The phonon-polariton modes were then excited to generate the THz radiation. The wide frequency range emission was achieved by the high transmittance of the GaP crystal. The bandwidths of the THz waves were kept below 0.015 cm−1 by adjusting the bandwidths of the two near-IR beams. A double-beam configuration was employed to ensure a high signal-to-noise ratio with a maximum value of 5000. Pyroelectric deuterium triglycine sulfate detectors at room temperature were used to detect the THz signals. Near-IR light was cut off with a black polyethylene filter. Spectra were acquired by averaging 32 scans. The entire THz wave path was purged with dry air to eliminate ambient water vapor. THz spectra were recorded at 5 and 300 K. The 5 K spectra were collected using a helium cryostat. The sample powder was ground in a mortar, and then mixed with polyethylene (PE) until a homogeneous dispersion was achieved throughout the filling matrix. The mixtures were finally pressed into 1 mm-thick pellets under a pressure of around 3.4 MPa. For all samples, a concentration of 50 wt% was used to measure the spectra at 30–60 cm−1, and a concentration of 5 wt% was used for spectra at 60–200 cm−1. An air background spectrum was recorded as a reference.
The second THz setup was a THz time-domain spectroscopy system used to generate a THz band at 10–60 cm−1.4 A femtosecond laser pulse at 800 nm with a width of 10 fs was used to excite THz radiation in a photoconductive antenna system (Aispec, Japan). An identical antenna was employed to detect the THz signal after it was transmitted through the sample pellet. The spectra were acquired by averaging 10 scans. The THz wave path was purged with dry air. THz spectra were recorded at 78 K in a liquid nitrogen cryostat. Pure pellet samples were used for the measurements, and an air background spectrum was recorded as a reference. Powder XRD spectra were measured with a diffractometer (Rigaku, Japan) at room temperature (1.54 Å Cu-Kα radiation) to determine the polymorphs in each sample.
Computation
DFT calculations implemented with a periodic boundary condition were performed with CRYSTAL09 software. The functional was at the B3LYP level,31,32 and the basis set was at the Gaussian 6-31G(d,p) level.33 The effectiveness of this combination in frequency calculations has been demonstrated for various hydrogen-bonded molecular systems.34–39 The total energy convergence criteria for the geometry optimization and frequency calculations were 10−7 and 10−10 hartree, respectively. The truncation tolerances for the Coulomb and Hartree–Fock exchange integral series were 10−6, 10−6, 10−6, 10−6, and 10−12 hartree. The radial and angular distributions of points in the normal space were defined by a pruned (55![[thin space (1/6-em)]](https://www.rsc.org/images/entities/char_2009.gif) 434) grid. A shrinking factor of (3,3) was used to define the commensurate grids and the sampling rate of the k point in the reciprocal space.28
434) grid. A shrinking factor of (3,3) was used to define the commensurate grids and the sampling rate of the k point in the reciprocal space.28
Crystal structures of the protonated adenine and adenosine were obtained from the Cambridge Structural Database (CSD).40 The powder XRD spectra of the protonated and deuterated adenine and adenosine were compared with the XRD patterns of CSD entries to confirm the consistency of the calculated and experimental geometries. The entries KOBFUD41 for adenine and ADENO 12 (ref. 42) for adenosine agreed most closely with the experimental data, and were used as the starting geometries. The geometry data were obtained at room temperature.
Polycrystalline adenine belongs to the P21/c space group. The unit cell contains four pairs of adenine dimers; each dimer occupies one asymmetry site, and is related to the others by a two-fold screw axis along b and a slide plane along c. The symmetry of each adenine is Cs, and the unit cell parameters are a = 7.890 Å, b = 22.242 Å, c = 7.448 Å, and β = 113.19°. The asymmetric unit and the molecular arrangement of the unit cell are shown in Fig. 1(a) and (c), respectively. Polycrystalline adenosine belongs to the P21 space group. The unit cell contains two molecules which are related to each other by a two-fold screw axis along b. The unit cell parameters are a = 4.843 Å, b = 10.290 Å, c = 11.853 Å, and β = 99.31°. The asymmetric unit and the molecular arrangement in the unit cell are shown in Fig. 2(a) and (c), respectively.
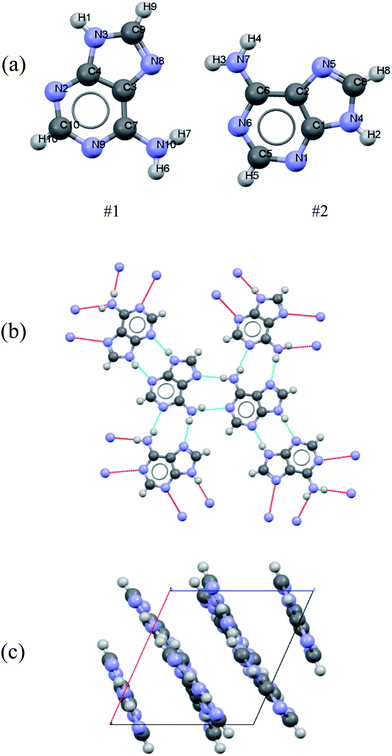 | ||
| Fig. 1 (a) Atom labeling scheme for the adenine dimer, (b) hydrogen bonding of adenine in the solid-state, and (c) adenine packing arrangement in the unit cell. | ||
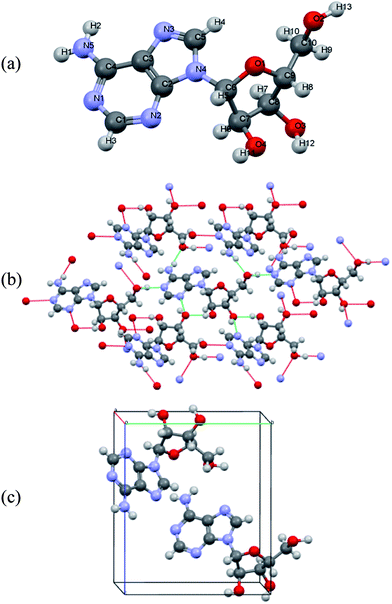 | ||
| Fig. 2 (a) Atom labeling scheme for adenosine, (b) hydrogen bonding of adenosine in the solid-state, and (c) molecular arrangement of adenosine in the unit cell. | ||
During the geometry optimization for the protonated adenine and adenosine, only the atomic coordinates were allowed to relax, the unit cell parameters were fixed at the experimental values, and the space group symmetries were preserved. Frequency calculations were performed by diagonalizing the mass-weighted Hessian in Cartesian coordinates under the harmonic approximation. IR intensities were determined using the Berry phase approach. The Born charge, which is the derivative of the dipole moment with respect to the atomic displacement, was calculated as the polarization difference between the equilibrium and distorted geometries.43,44
For deuterated adenine and adenosine, the frequencies were calculated directly from the Hessian already computed for the protonated adenine and adenosine, although the isotopic mass for the corresponding hydrogen atoms was used.
Quantitative mode analysis method
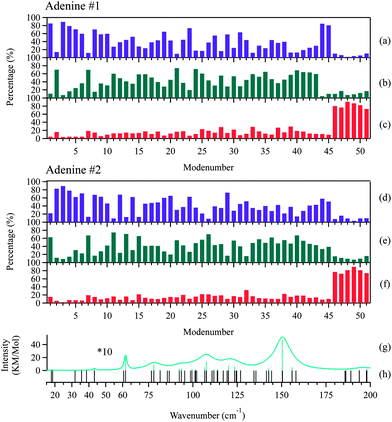
We describe an analytical method for resolving the three types of motion components: intermolecular translation, libration, and intramolecular vibration. We place the origin of the coordinate system at the molecular center of mass for convenience. The intermolecular translation vector, δtrans, represented by the displacement of the molecular center of mass, is obtained according to eqn (1) as proposed by Jepsen and Clark,17 | (1) |
The libration angle θlib can be basically calculated by eqn (2),
| θlib = |momentlib|/I | (2) |
 | (3) |
Finally, the atomic displacement, δintrai, during intramolecular vibrations is obtained by subtracting the intermolecular transition vector, δtrans, and the libration vector, δlibi, from the total displacement, δi. The percentage of each type of displacement in the total displacement is calculated from eqn (4),
 | (4) |
Results and discussion
THz spectra at 5 K
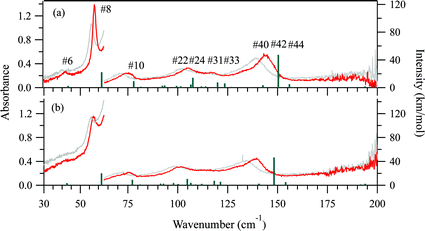
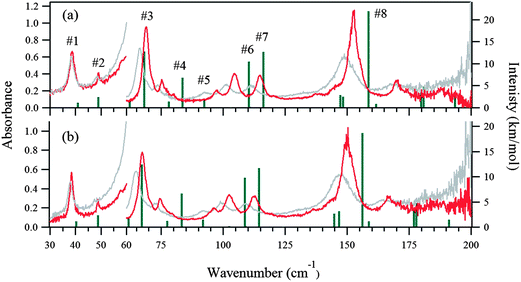
The 5 K THz spectra of the protonated and deuterated adenine are shown in Fig. 3(a) and (b), respectively. Severe band-overlapping is observed in the frequency range 60–160 cm−1, and multi-peak fitting with a Lorentzian line shape failed to resolve the underlying peaks. The 5 K spectra of the protonated and deuterated adenosine are shown in Fig. 4(a) and (b), respectively. In contrast to adenine, they contain sharp peaks over the entire frequency region. Because of the decrease in the signal-to-noise ratio, the region beyond 160 cm−1 was not involved in the multi-peak fitting with a Lorentzian line shape function. Thus, the locations of the eight most intense peaks are well defined and are used in the quantitative discussion in the following sections. The four weak peaks at 58, 80, 138, and 145 cm−1 could not be resolved.Geometry optimization
The accuracy of the calculations for the intramolecular structure is evaluated by the variation of the internal coordinates of the heavy atoms, because the position of the hydrogen atoms cannot be accurately determined from the XRD measurements. The root-mean-square deviations (RMSDs) of the bond lengths are 0.0114 Å for the adenine dimer and 0.0141 Å for adenosine, and the RMSDs of the bond angles are 1.2100° for the adenine dimer and 1.1512° for adenosine. Complete lists of the experimental and calculated bond lengths angles for the asymmetric adenine and adenosine units are provided in the ESI.†It is also important to assess the reproduction of the intermolecular contacts, because they mediate the intermolecular vibrations. Adenine molecules adopt planar motifs with π–π stacking. The two molecules in the asymmetric unit are connected via two hydrogen bonds, and each adenine is also connected to two other adenines in the neighboring asymmetric units via two hydrogen bonds (Fig. 1(b)).41 The experimental and calculated bond lengths of the six symmetry-unique hydrogen bonds are listed in Table 1. The lengths of the hydrogen bonds are underestimated, except for hydrogen bond N6⋯(H7)N10, where the length is overestimated by 0.0615 Å. The RMSD for all six hydrogen bonds is 0.0357 Å. In the case of adenosine, the stacking involves molecules interacting with one another by a translation along the a axis. Each adenosine is connected to the neighboring molecules via eight hydrogen bonds (Fig. 2(b)), of which four are symmetry-unique.42 The experimental and calculated bond lengths of the four symmetry-unique bonds are listed in Table 1. They are all systematically underestimated, and the RMSD is 0.0306 Å. Generally, the hydrogen bond lengths are underestimated for adenine and adenosine, implying that a weak strain might be generated in the intermolecular structures during geometry optimization.
| H-bonds | Exp. | Cal. |
|---|---|---|
| Adenine | ||
| N2⋯(H2)N4 | 2.891 | 2.8824 |
| N3(H1)⋯N1 | 2.864 | 2.8494 |
| N5⋯(H6)N10 | 3.047 | 3.0013 |
| N7(H4)⋯N9 | 3.060 | 3.0556 |
| N7(H3)⋯N8 | 3.072 | 3.0334 |
| N6⋯(H7)N10 | 3.056 | 3.1175 |
| RMSD | 0.0357 | |
| Adenosine | ||
| (H2)N5⋯O2 | 2.899 | 2.8869 |
| N1⋯(H13)O2 | 2.777 | 2.7434 |
| N2⋯(H12)O3 | 2.918 | 2.9089 |
| O4(H11)⋯O3 | 2.754 | 2.7049 |
| RMSD | 0.0306 | |
Frequency calculation
Fig. 3(a) and (b) show the calculated normal modes for protonated and deuterated adenine, and Fig. 4(a) and (b) show the results for protonated and deuterated adenosine, respectively. The intensities of the calculated modes in the region of 30–60 cm−1 are enlarged 10-fold in order to compare them with the results for the system in which the concentration is 10-fold greater than those for the higher frequency measurements. The calculations reproduced the experimental frequencies of the modes fairly well for all the samples. However, the calculated frequencies are systematically overestimated. This may in part arise from the underestimation of the hydrogen bond lengths which increases the force constant of the normal modes, but primarily stems from the anharmonicity of the potential surfaces.For protonated and deuterated adenine, the overlapping of the 21 IR-active modes of the 45 calculated optic normal modes accounts for the broadband profiles in the region below 160 cm−1. It also implies that the 21 modes experience severe line shape broadening. The mode numbers of the several strongest normal modes are labeled in Fig. 3(a). In the case of protonated and deuterated adenosine, the calculations predict 17 IR-active optic modes below 160 cm−1, although several modes are too weak to be detected. One-to-one correspondence between the calculated and experimental modes is observed over the entire frequency region. When the correlation is evaluated using the eight strongest peaks, excellent agreement between the calculated and experimental frequencies is observed (Fig. 5), implying a genuine relationship between the calculations and the experimental results. The RMSDs of the eight calculated peaks are 3.71 and 3.66 cm−1 for protonated and deuterated adenosine, respectively.
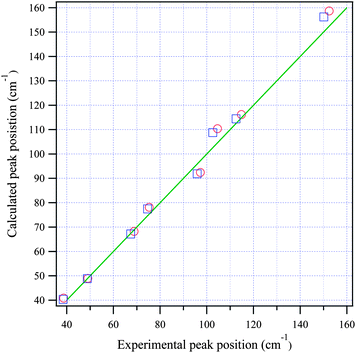 | ||
| Fig. 5 The relationship between the calculated and experimental frequencies for adenosine (circles) and deuterated adenosine (squares). The green line passes through the origin with a slope of one. | ||
Isotopic shifts are critical for assigning vibrational modes in the mid-IR region. Previously, we have shown that the isotopic shift caused by deuteration is also a powerful tool for assigning the vibrational bands in the THz frequency region and for investigating the properties of these normal modes.24,25 Here the isotopic shift is defined by eqn (5),
 | (5) |
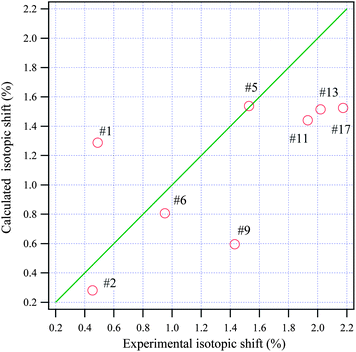 | ||
| Fig. 6 The relationship between the calculated and experimental isotopic shifts for adenosine. The green line passes through the origin with a slope of one. | ||
Thermal shift
The discrepancy between the calculated and experimental results may arise from problems with the DFT model; the largest contribution is from the anharmonicity of the potential surfaces, which is not accounted for in the harmonic model. The potential surfaces of molecular solids in the low-frequency region have anharmonic properties mediated by weak interactions, such as hydrogen bonds and van der Waals forces. The anharmonicity experienced by the sequence transitions (ν = 1–2, 2–3 etc.) can be determined with temperature-dependent spectra.The THz spectra at 300 K are superimposed with the 5 K spectra in Fig. 3 for protonated and deuterated adenine, and in Fig. 4 for protonated and deuterated adenosine. The thermal energy at 300 K is equal to 208.5 cm−1. The elevated energy levels are significantly populated for the normal modes below 200 cm−1. The anharmonicity means that nearly all the normal modes of the four samples are red shifted, whereas the low-frequency wings of the absorption profiles are broadened. An interesting exception is that the center frequencies of the first protonated and deuterated adenosine peaks remain almost unchanged. This indicates that complicated mechanisms are likely to be involved in the temperature-dependent properties of these two samples.
Mode analysis
Rigid-body factor group analysis45 predicts that adenine crystals possess 48 intermolecular modes represented by 12Ag + 12Au + 12Bg + 12Bu. The three Au + 2Bu modes are acoustic translations, corresponding to the three negative modes in the DFT calculations. The other 45 are all optic modes: the 21 (11Au + 10Bu) modes are IR-active, and the other 24 (12Ag + 12Bg) modes are Raman active. These predictions exactly match the results of the DFT calculations, suggesting that the dynamics of the intermolecular and intramolecular vibrations can be completely separated and that adenine can be treated as a rigid molecule.
King et al. investigated the vibrations of the 1-methylthymine–9-methyladenine 1![[thin space (1/6-em)]](https://www.rsc.org/images/entities/char_2009.gif) :
:![[thin space (1/6-em)]](https://www.rsc.org/images/entities/char_2009.gif) 1 co-crystalline complex22 in the frequency region below 100 cm−1. The two molecules vibrate like rigid bodies, which is analogous to the behavior of adenine. The similarity in behavior may arise from the closed cyclic configurations shared by these molecules. It may also suggest that other small molecules adopting a similar molecular configuration may be expected to exhibit weak coupling between the intermolecular and intramolecular motions. A direct contrast can be found in the case of amino acids as demonstrated by Williams, et al.46,47 As small as nucleobases, but adopting linear configurations, L-alanine and L-serine were revealed to undergo significant intramolecular structural torsions which strongly coupled with the intermolecular motions in the THz region.
1 co-crystalline complex22 in the frequency region below 100 cm−1. The two molecules vibrate like rigid bodies, which is analogous to the behavior of adenine. The similarity in behavior may arise from the closed cyclic configurations shared by these molecules. It may also suggest that other small molecules adopting a similar molecular configuration may be expected to exhibit weak coupling between the intermolecular and intramolecular motions. A direct contrast can be found in the case of amino acids as demonstrated by Williams, et al.46,47 As small as nucleobases, but adopting linear configurations, L-alanine and L-serine were revealed to undergo significant intramolecular structural torsions which strongly coupled with the intermolecular motions in the THz region.
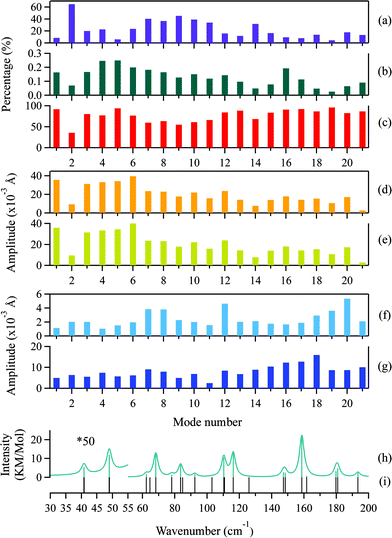
Generally, two types of atomic motion are involved in the intramolecular vibrations of the adenine and ribose moieties: large-amplitude relative motion, which is mediated by the glycosidic bond; and small-amplitude internal atomic motion. The amplitude of the relative motion can be described by the displacement,  of the centers of mass of the two moieties during the intramolecular vibration according to eqn (6),
 | (6) |
 is the displacement of the centers of mass of these two moieties during the molecular libration motion. The amplitudes of
  are shown in Fig. 8(d) and (e) for the adenine and ribose moieties, respectively.
The amplitudes of the internal vibrations in the adenine and ribose moieties, δinternalk, is described by the RMSD atomic distances from the center of mass in the adenine or ribose moiety of the distorted intramolecular structure, from that of the equilibrium intramolecular structure, as shown in eqn (7),
 | (7) |
 is the position vector of the ith atom using the center of mass as the origin within the adenine or ribose moiety of the equilibrium structure. The δinternalk for the adenine and ribose moieties is shown in Fig. 8(f) and (g), respectively.
For the normal modes at the low-frequency end of the spectrum, the amplitudes of the relative motions of the adenine and ribose moieties are much larger compared with their internal motion, indicating that the flexibility of adenosine stems from the glycosidic linkage. The amplitude of the relative motions of the adenine and ribose moieties decrease as the frequency increases, whereas the amplitude of their internal motion increases. The localized atomic vibrations gradually dominate in the normal modes at the high-frequency end of the spectrum. In addition, the amplitude of the internal motion of the ribose moiety is generally twice as large as that of the adenine moiety. This greater flexibility may arise from its linear side chain. The adenine moiety, possessing a cyclic structure, is quite rigid.
We next consider the molecular vibrations in detail. Several normal modes can be visually distinguished in the mode animation. The second mode features the intermolecular translation, the first and third modes are dominated by the torsional librations of the adenine and ribose moieties about the glycosidic bonds, and the sixth mode features the bending of these two moieties. Klooster and Craven measured the nuclear anisotropic thermal parameters of polycrystalline adenosine by neutron diffraction at 123 K.48 They calculated the frequency arising from the pure torsional libration of the adenine and ribose moieties about the glycosidic bond by treating them as rigid bodies, based on a classical mechanic model. They predicted a normal mode at around 62 cm−1; our DFT calculations predict a mode at 62.3 cm−1 (the third mode) and it is observed experimentally at 58.5 cm−1 in the 5 K spectra. This further verifies the rationale of our DFT calculations.
Finally, we would like to look for some experimental evidence to support the mode assignments for crystalline adenosine. As we know, by varying the molecular arrangement in the solid-state, the intermolecular potential surface is remarkably changed, but the intramolecular potential surface is barely affected. Therefore, we expect large variations for the intermolecular modes in THz spectroscopy, but not for the intramolecular modes.
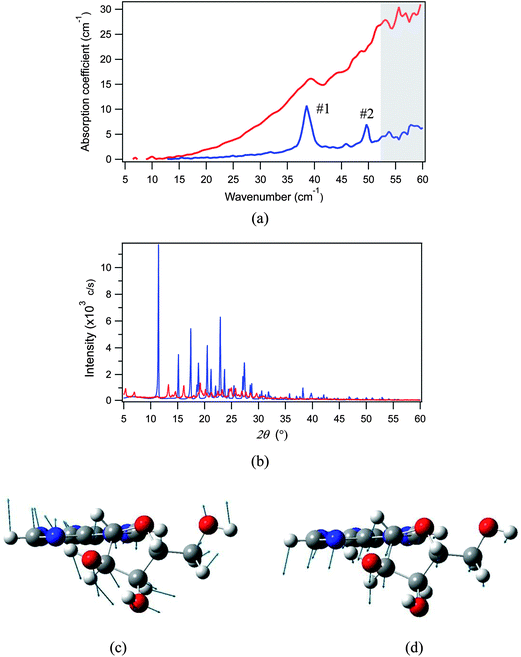
We herein prepared a protonated adenosine solid with a reduced crystallinity by freeze-drying a 10 wt% aqueous solution. The THz spectra of samples with low and high crystallinities were measured using the THz-TDS system at 78 K, and compared in Fig. 9(a); their crystallinities were checked by powder XRD as shown in Fig. 9(b). The first and second modes of adenosine show completely distinct behaviors: the first mode experiences only a slight shift of frequency and is still identified in the low crystallinity THz spectrum, but the second mode has completely disappeared. Hence we can assign the first mode to an intramolecular vibration, and the second to an intermolecular vibration. As mentioned above, the DFT calculation predicts that the first mode is an intermolecular translation (Fig. 9(c)), and the second mode is a structural torsion between the adenine and ribose moieties (Fig. 9(d)), and this is completely consistent with the experimental assertion.
In summary, we observed great flexibility of adenosine, allowed by its glycosidic linkage, which mediates the large-amplitude torsion and bending of the adenine and ribose moieties in the low-frequency region. This observation may clarify the flexibility of the glycosidic linkages, which connect nucleobase pairs to the main chain of the double helix conformation of DNA, and may be useful in future dynamic studies of DNA.
Conclusion
DFT calculations with a periodic boundary condition were performed to assign modes in the THz spectra of polycrystalline adenine and adenosine measured at 5 K. The calculated and experimental results agreed well for both samples. Isotopic shifts of the vibrational modes were obtained experimentally and theoretically, and we compared these to see the accuracy of the calculations. The anharmonicity of the normal modes was discussed by the observation of a thermal shift for the sequence transitions. An analytical model was used to deconvolute the intermolecular and intramolecular motions in the normal modes. Adenine showed weak coupling between the intermolecular and intramolecular motions. The intermolecular vibrations dominated the characteristic low-frequency region, whereas the intramolecular vibrations dominated the high-frequency region. In contrast, adenosine exhibited strong relative vibrations between the adenine and ribose moieties, mediated by the glycosidic bond, in the low-frequency region, and these vibrations were strongly coupled with the intermolecular vibrations. This vibrational freedom allowed by the glycosidic bond is likely to be observed in other nucleosides as well as molecules containing nucleoside segments, such as nucleotides and nucleic acids. In addition, we demonstrated that a normal mode could be identified as featuring intermolecular or intramolecular vibrations by observing its behavior in the THz spectrum when the crystallinity of the sample was reduced.Acknowledgements
This work was partially supported by Industry-Academia Collaborative R&D from the Japan Science and Technology Agency, JST, and by a Grant-in-Aid for Creative Scientific Research (no. 17GS0209) from the Ministry of Education, Culture, Sports, Science, and Technology of Japan.References
- S. D. Schwartz and V. L. Schramm, Nat. Chem. Biol., 2009, 5, 551–558 CrossRef CAS PubMed.
- A. Markelz, S. Whitmire, J. Hillebrecht and R. Birge, Phys. Med. Biol., 2002, 47, 3797–3805 CrossRef CAS.
- K. Yamamoto, K. Tominaga, H. Sasakawa, A. Tamura, H. Murakami, H. Ohtake and N. Sarukura, Biophys. J., 2005, 89, L22–L24 CrossRef CAS PubMed.
- O. Kambara, A. Tamura, T. Uchino, K. Yamamoto and K. Tominaga, Biopolymers, 2010, 93, 735–739 CAS.
- N. Yamamoto, O. Kambara, K. Yamamoto, A. Tamura, S. Saito and K. Tominaga, Soft Matter, 2012, 8, 1997–2006 RSC.
- S. Kawaguchi, O. Kambara, M. Shibata, H. Kandori and K. Tominaga, Phys. Chem. Chem. Phys., 2010, 12, 10255–10262 RSC.
- J. Xu, K. W. Plaxco and S. J. Allen, Protein Sci., 2006, 15, 1175–1181 CrossRef CAS PubMed.
- J. Xu, K. W. Plaxco and S. J. Allen, J. Phys. Chem. B, 2006, 110, 24255–24259 CrossRef CAS PubMed.
- S. J. Kim, B. Born, M. Havenith and M. Gruebele, Angew. Chem., Int. Ed., 2008, 47, 6486–6489 CrossRef CAS PubMed.
- V. Q. Vinh, S. J. Allen and K. W. Plaxco, J. Am. Chem. Soc., 2011, 133, 8942–8947 CrossRef PubMed.
- O. Kambara, A. Tamura, A. Naito and K. Tominaga, Phys. Chem. Chem. Phys., 2008, 10, 5042–5044 RSC.
- T. R. Globus, D. L. Woolard, T. Khromova, T. W. Crowe, M. Bykhovskaia, B. L. Gelmont, J. Hesler and A. C. Samuels, J. Biol. Phys., 2003, 29, 89–100 CrossRef CAS.
- C. F. Zhang, E. Tarhan, A. K. Ramdas, A. M. Weiner and S. M. Durbin, J. Phys. Chem. B, 2004, 108, 10077–10082 CrossRef CAS.
- M. T. Katarzyna, D. B. Andrew, D. W. Christopher, E. C. John, R. P. Arwen, A. G. Davies and H. L. Edmund, J. Appl. Crystallogr., 2011, 44, 129–133 CrossRef.
- F. P. David, S. Karen, J. H. Edwin and O. Esenturk, ChemPhysChem, 2007, 8, 2412–2431 CrossRef PubMed.
- M. Walther, B. M. Fischer and P. U. Jepsen, Chem. Phys., 2003, 288, 261–268 CrossRef CAS.
- P. U. Jepsen and S. J. Clark, Chem. Phys. Lett., 2007, 442, 275–280 CrossRef CAS PubMed.
- Y. C. Shen, P. C. Upadhya and E. H. Linfield, Appl. Phys. Lett., 2003, 82, 2350–2352 CrossRef CAS.
- Y. C. Shen, P. C. Upadhya, E. H. Linfield and A. G. Davies, Vib. Spectrosc., 2004, 35, 111–114 CrossRef CAS PubMed.
- B. M. Fischer, M. Walther and P. Uhd Jepsen, Phys. Med. Biol., 2002, 47, 3807–3814 CrossRef CAS.
- M. D. King and T. M. Korter, J. Phys. Chem. A, 2011, 115, 14391–14396 CrossRef CAS PubMed.
- M. D. King, W. Ouellett and T. M. Korter, J. Phys. Chem. A, 2011, 115, 9467–9478 CrossRef CAS PubMed.
- J. Robles, A. Grandas, E. Pedroso, F. J. Luque, R. Eritja and M. Orozco, Curr. Org. Chem., 2002, 6, 1333–1368 CrossRef CAS.
- O. Kambara, K. Tominaga, J. Nishizawa, T. Sasaki, H.-W. Wang and M. Hayashi, Chem. Phys. Lett., 2010, 498, 86–89 CrossRef CAS PubMed.
- O. Kambara, C. S. Ponseca, K. Tominaga, J. Nishizawa, T. Sasaki, H. W. Wang and M. Hayashi, Bull. Chem. Soc. Jpn., 2013, 86, 714–720 CrossRef CAS.
- M. R. C. Williams, A. B. True, A. F. Izmaylov, T. A. French, K. Schroeck and C. A. Schmuttenmaer, Phys. Chem. Chem. Phys., 2011, 13, 11719–11730 RSC.
- R. Dovesi, R. Orlando, B. Civalleri, C. Roetti, V. R. Saunders and C. M. Zicovich-Wilson, Z. Kristallogr., 2005, 220, 571–573 CrossRef CAS.
- R. Dovesi, V. R. Saunders, C. Roetti, R. Orlando, C. M. Zicovich-Wilson, F. Pascale, B. Civalleri, K. Doll, N. M. Harrison, I. J. Bush, P. D'Arco and M. Llunell, CRYSTAL09 User's Manual, University of Torino, Torino, 2009 Search PubMed.
- K. Suto, T. Sasaki, T. Tanable, K. Saito, J. I. Nishizawa and M. Ito, Rev. Sci. Instrum., 2005, 76, 123109 CrossRef.
- J. Nishizawa, Denshi Kagaku, 1963, 14, 17–31 Search PubMed.
- A. D. Becke, J. Chem. Phys., 1993, 98, 5648–5652 CrossRef CAS.
- C. Lee, W. Yang and R. G. Parr, Phys. Rev. B: Condens. Matter Mater. Phys., 1988, 37, 785–789 CrossRef CAS.
- P. C. Hariharan and J. A. Pople, Theor. Chim. Acta, 1973, 28, 213–222 CrossRef CAS.
- F. Cora, M. Alfredsson, G. Mallia, et al., Principles and Applications of density in inorganic chemistry II Book Series: Structure and Bonding, Springer, Berlin, 2004, vol. 113, pp. 171–232 Search PubMed.
- C. M. Zicovich-Wilson, F. Pascale, C. Roetti, V. R. Saunders, R. Orlando and R. Dovesi, J. Comput. Chem., 2004, 25, 1873–1881 CrossRef CAS PubMed.
- M. D. King and T. M. Korter, J. Phys. Chem. A, 2010, 114, 7127–7128 CrossRef CAS PubMed.
- E. M. Witko and T. M. Korter, J. Phys. Chem. A, 2011, 115, 10052–10058 CrossRef CAS PubMed.
- D. G. Allis, A. M. Fedor, T. M. Korter, J. E. Bjarnason and E. R. Brown, Chem. Phys. Lett., 2007, 440, 203–209 CrossRef CAS PubMed.
- M. D. King, P. M. Hakey and T. M. Korter, J. Phys. Chem. A, 2010, 114, 2945–2953 CrossRef CAS PubMed.
- F. H. Allen, Acta Cryst., 2002, B58, 380–388 CAS.
- S. Mahapatra, S. K. Nayak, S. J. Prathapa and T. N. G. Row, Cryst. Growth Des., 2008, 8, 1223–1225 CAS.
- X. P. Fu, H. A. Aisa, M. Abdurahim, A. Yili, S. F. Aripova and B. Tashkhodzhaev, Khim. Prir. Soedin., 2007, 149, 181–183 Search PubMed.
- F. Pascale, C. M. Zicovich-Wilson, F. Lopez Gejo, B. Civalleri, R. Orlando and R. Dovesi, J. Comput. Chem., 2004, 25, 888–897 CrossRef CAS PubMed.
- C. M. Zicovich-Wilson, R. Dovesi and V. R. Saunders, J. Chem. Phys., 2001, 115, 9708–9718 CrossRef CAS.
- D. L. Rousseau, R. P. Bauman and S. P. S. Porto, J. Raman Spectrosc., 1981, 10, 253–290 CrossRef CAS.
- R. W. Williams, S. Schlücker and B. S. Hudson, Chem. Phys., 2008, 343, 1–18 CrossRef CAS PubMed.
- R. W. Williams and E. J. Heilweil, Chem. Phys., 2010, 373, 251–260 CrossRef CAS PubMed.
- W. T. Klooster, J. R. Ruble and B. M. Craven, Acta Crystallogr., Sect. A: Found. Crystallogr., 1991, B47, 376–383 CAS.
Footnote |
| † Electronic supplementary information (ESI) available: FTIR spectra of the protonated and deuterated adenine and adenosine, tables of the bond angles and bond lengths of adenine and adenosine, and figures showing the atomic motion of the IR-active modes below 160 cm−1 calculated for crystalline adenine and adenosine. See DOI: 10.1039/c3ra44285c |
| This journal is © The Royal Society of Chemistry 2014 |

