Preparation of bifunctionalized phenylene-bridged periodic mesoporous organosilica for solid-phase microextraction†
Liao Yuan
Xia
*ab,
Yun Chu
Hu
a,
Min Zhi
Rong
b and
Yong Jin
Liang
b
aCollege of Material Science and Engineering, Central South University of Forestry and Technology, Changsha 410004, P. R. China. E-mail: xly1516@126.com
bMaterials Science Institute, Sun Yat-Sen University, Guangzhou 510275, P. R. China. Fax: +86-02084114008
First published on 30th October 2013
Abstract
Well-ordered bifunctionalized periodic mesoporous organosilicas (BPMOs), with various mesostructures (like hexagonal p6mm, cubic Ia![[3 with combining macron]](https://www.rsc.org/images/entities/char_0033_0304.gif) d symmetry), relatively large mesopores, a phenylene-bridged skeleton and vinyl functional groups, were first prepared by co-condensation of 1,4-bis(triethoxysilyl)benzene (BTEB) and triethoxyvinylsilane (TEVS) with a triblock copolymer (P123) as a template under acid conditions. It was found that the mesostructure of the BPMOs can be facilely tuned by altering the fraction of organosilanes in the synthesis mixture. With an increase of TEVS content, the mesostructure changed from p6mm to Ia
d symmetry), relatively large mesopores, a phenylene-bridged skeleton and vinyl functional groups, were first prepared by co-condensation of 1,4-bis(triethoxysilyl)benzene (BTEB) and triethoxyvinylsilane (TEVS) with a triblock copolymer (P123) as a template under acid conditions. It was found that the mesostructure of the BPMOs can be facilely tuned by altering the fraction of organosilanes in the synthesis mixture. With an increase of TEVS content, the mesostructure changed from p6mm to Ia![[3 with combining macron]](https://www.rsc.org/images/entities/char_0033_0304.gif) d, until disordered. The mechanisms of the mesophase transformation were discussed based on the adsorption of vinyl groups into the micelles and the relative reactivities of the organosilane precursors. In addition, the potential application of the BPMOs as an effective fibre-coating absorbent is tested in solid-phase microextraction (SPME) analyses.
d, until disordered. The mechanisms of the mesophase transformation were discussed based on the adsorption of vinyl groups into the micelles and the relative reactivities of the organosilane precursors. In addition, the potential application of the BPMOs as an effective fibre-coating absorbent is tested in solid-phase microextraction (SPME) analyses.
1. Introduction
A new class of organic–inorganic hybrid materials called periodic mesoporous organosilicas (PMOs) has been synthesized by using bridged organosilsesquioxane of the general formula [(RO)3Si–R′–Si(OR)3] as a precursor, in the presence of surfactants as structure-directing agents (SDAs).1–3 Such PMO materials have potential applications in molecular sieves, catalysts, adsorbents and sensors, due to their periodically organized mesopores with well-defined mesostructure, uniform pore-size distribution and high surface area.4,5 So far, a diverse range of organic moieties,6–15 such as aliphatic, aromatic or heteroaromatic, have been successfully employed in the synthesis of mesoporous organosilicas with the aid of surfactants in basic, acidic, or neutral media. However, the PMOs are usually prepared by using a single bridged organosilanes precursor, and severely limit further chemical modified of pore surfaces due to the bridge organic units incorporated into the framework is less reactive.16 To extend the functionality of PMOs, two approaches are commonly used. One is the grafting approach, where different types of organic groups as functional sites are bound on the pore surface by a post-synthesis treatment. Compared to the grafting method, it is confirmed to be a feasible way that bridged bis-(trialkoxysilyl)organosilanes [(RO)3Si–R′–Si(OR)3] and terminal trialkoxysilylorganosilanes [(RO)3SiR′′] are co-condensation in the presence of SDAs.16–25 The resultant BPMOs consist of bridging organic units and terminal organic groups. In general, the bridging groups are responsible for the physical and mechanical performance of the BPMOs framework, while the terminal organic groups in the channels can impart more functionality to the BPMOs. Therefore, various functional groups, such as vinyl, aminopropyl, glycidoxypropyl, mercaptopropyl and thiophene, have been introduced into BPMOs.19,22–25 Among the functional groups, vinyl was considered as the most versatile because it is not only fairly stable in the synthesis but also enough hydrophobic and have many applications value in selective adsorption, catalysis and separations.26Moreover, most of the research efforts have been concentrated on PMOs with various organic bridging units and hexagonal mesostructures under various pH conditions.14,27–31 Nevertheless, it is relatively few studies for PMOs with 3-D cubic mesostructures such as Pm3n, Fm3m, Im3m, and Ia![[3 with combining macron]](https://www.rsc.org/images/entities/char_0033_0304.gif) d symmetry,32–39 especially cubic BPMOs with rigid aromatic bridging groups. More recently, Wu and co-workers prepared benzene-bridged BPMOs with cubic Pm3n symmetry that show well-ordered mesostructures and relatively high concentrations of organic groups.40 However, the resultant materials showed relatively small pore diameters (<3 nm). To the best of our knowledge, synthesis of large-pored BPMOs with cubic Ia3d symmetry containing rigid aromatic bridging groups and terminal functional groups have not been reported. This may result from the small domain of this cubic phase (Ia
d symmetry,32–39 especially cubic BPMOs with rigid aromatic bridging groups. More recently, Wu and co-workers prepared benzene-bridged BPMOs with cubic Pm3n symmetry that show well-ordered mesostructures and relatively high concentrations of organic groups.40 However, the resultant materials showed relatively small pore diameters (<3 nm). To the best of our knowledge, synthesis of large-pored BPMOs with cubic Ia3d symmetry containing rigid aromatic bridging groups and terminal functional groups have not been reported. This may result from the small domain of this cubic phase (Ia![[3 with combining macron]](https://www.rsc.org/images/entities/char_0033_0304.gif) d) of MCM-48 in phase diagrams and the more restricted synthesis condition.41
d) of MCM-48 in phase diagrams and the more restricted synthesis condition.41
As it is well know, PMOs with Ia![[3 with combining macron]](https://www.rsc.org/images/entities/char_0033_0304.gif) d symmetry can provide a more open framework and thus great advantages in the applications such as mass transportation, adsorbents and catalyst supports. Herein, the present work first reports the synthesis of BPMO, with relatively large mesopores (4.5 nm), a phenylene-bridged skeleton and vinyl functional groups, cubic Ia
d symmetry can provide a more open framework and thus great advantages in the applications such as mass transportation, adsorbents and catalyst supports. Herein, the present work first reports the synthesis of BPMO, with relatively large mesopores (4.5 nm), a phenylene-bridged skeleton and vinyl functional groups, cubic Ia![[3 with combining macron]](https://www.rsc.org/images/entities/char_0033_0304.gif) d symmetry that show good structural orderings, by co-condensation of 1,4-bis-(triethoxysilyl)-benzene (BTEB) and triethoxyvinylsilane (TEVS) with triblock copolymer (P123) as template under acid conditions. The advantage of this synthesis route lies on the facile change of the mesostructure of the resultant BPMOs, which is carried out by altering the fraction of TEVS in the synthesis mixture. Importantly, the TEVS not only the surface groups but also modifies interactions with the surfactant, thereby affecting the mesopore architecture, which was proven to be crucial for the mesostructure transformed from 2-D hexagonal to cubic geometry in this study. In addition, the generation of 2-D hexagonal p6mm and cubic Ia
d symmetry that show good structural orderings, by co-condensation of 1,4-bis-(triethoxysilyl)-benzene (BTEB) and triethoxyvinylsilane (TEVS) with triblock copolymer (P123) as template under acid conditions. The advantage of this synthesis route lies on the facile change of the mesostructure of the resultant BPMOs, which is carried out by altering the fraction of TEVS in the synthesis mixture. Importantly, the TEVS not only the surface groups but also modifies interactions with the surfactant, thereby affecting the mesopore architecture, which was proven to be crucial for the mesostructure transformed from 2-D hexagonal to cubic geometry in this study. In addition, the generation of 2-D hexagonal p6mm and cubic Ia![[3 with combining macron]](https://www.rsc.org/images/entities/char_0033_0304.gif) d mesophases with large pores is favoring the accessibility of vinyl groups, which is possible with respect to specific functionality, such as separation, adsorption, catalysis, sensing and drug delivery.
d mesophases with large pores is favoring the accessibility of vinyl groups, which is possible with respect to specific functionality, such as separation, adsorption, catalysis, sensing and drug delivery.
2. Experimental
2.1. Chemicals
1,4-Bis(triethoxylsilyl)benzene (BTEB, 96% purity), triblock copolymer (Pluronic P123, MW = 5800) and triethoxyvinyl-silane (TEVS) were bought from Aldrich. The standard mixture of four non-polar compounds including benzene (B), toluene (T), ethylbenzene (E) and o-xylene (X) were purchased from Alfa Aesar and dissolved in methanol (HPLC grade) to make stock solutions at a concentration of 1 mg mL−1 for each compound. Other chemicals were used as received without further purification. Deionized water was used in all the experiments.2.2. Synthesis of BPMOs
Typically, P123 (1.98 g) and sodium chloride (1.23 g) were dissolved in 70 mL of 5.71 × 10⁻² M hydrochloric acid aqueous solution. Herein, sodium chloride was used to favor the co-assembling of organosilica precursors, and hence increased the structural regularity.42,43 After a homogeneous solution was obtained at 273 K, a mixture of BTEB and TEVS precursors (5 mmol of the precursors were pre-hydrolyzed at room temperature in 5 mL mixture of ethanol and hydrochloric acid solution (EtOH![[thin space (1/6-em)]](https://www.rsc.org/images/entities/char_2009.gif) :
:![[thin space (1/6-em)]](https://www.rsc.org/images/entities/char_2009.gif) H2O = 4
H2O = 4![[thin space (1/6-em)]](https://www.rsc.org/images/entities/char_2009.gif) :
:![[thin space (1/6-em)]](https://www.rsc.org/images/entities/char_2009.gif) 1 (v/v); ([HCl] = 3.04 × 10⁻³ M) under ultrasonic for 15 min) was dropwise added under vigorous stirring at 273 K for 30 min. This procedure is so-called prehydrolysis, its main purpose being to equalize the hydrolysis rates of the two precursors at low temperature.44 The molar percentage of TEVS varied between 0 and 30% (see Table 1). The mixtures were further stirred at 303 K for 24 h, and aged at 353 K for 24 h. The molar composition of the final reaction mixture was 1.0organosilica
1 (v/v); ([HCl] = 3.04 × 10⁻³ M) under ultrasonic for 15 min) was dropwise added under vigorous stirring at 273 K for 30 min. This procedure is so-called prehydrolysis, its main purpose being to equalize the hydrolysis rates of the two precursors at low temperature.44 The molar percentage of TEVS varied between 0 and 30% (see Table 1). The mixtures were further stirred at 303 K for 24 h, and aged at 353 K for 24 h. The molar composition of the final reaction mixture was 1.0organosilica![[thin space (1/6-em)]](https://www.rsc.org/images/entities/char_2009.gif) :
:![[thin space (1/6-em)]](https://www.rsc.org/images/entities/char_2009.gif) 0.068P123
0.068P123![[thin space (1/6-em)]](https://www.rsc.org/images/entities/char_2009.gif) :
:![[thin space (1/6-em)]](https://www.rsc.org/images/entities/char_2009.gif) 0.80HCl
0.80HCl![[thin space (1/6-em)]](https://www.rsc.org/images/entities/char_2009.gif) :
:![[thin space (1/6-em)]](https://www.rsc.org/images/entities/char_2009.gif) 778H2O
778H2O![[thin space (1/6-em)]](https://www.rsc.org/images/entities/char_2009.gif) :
:![[thin space (1/6-em)]](https://www.rsc.org/images/entities/char_2009.gif) 4.2NaCl. The product was filtered, washed with deionized water and ethanol, and then dried at room temperature overnight. The as-synthesized powdery sample (1.0 g) was stirred in a solution of HCl (3.0 g) and ethanol (200 mL) at 333 K for 24 h. The extracted samples were collected by filtration, washed with deionized water and ethanol for three times, and then air-dried.
4.2NaCl. The product was filtered, washed with deionized water and ethanol, and then dried at room temperature overnight. The as-synthesized powdery sample (1.0 g) was stirred in a solution of HCl (3.0 g) and ethanol (200 mL) at 333 K for 24 h. The extracted samples were collected by filtration, washed with deionized water and ethanol for three times, and then air-dried.
| TEVSa (%) | S BET b (m2 g−1) | S mic c (m2 g−1) | V T d (cm3 g−1) | D p e (nm) | Mesostructuref |
|---|---|---|---|---|---|
| a Molar percentage of TEVS in the mixture of BTEB and TEVS precursors. b S BET, BET surface area. c S mic, micropore area, calculated from t-Plot method. d V T, total pore volume. e D p, pore diameter estimated from average pore diameter and adsorption branch. f Mesostructures were determined by XRD analysis and TEM observation. | |||||
| 0 | 833 | — | 1.06 | 5.11 | p6mm |
| 5 | 649 | 51 | 0.71 | 4.40 | p6mm |
| 10 | 535 | 126 | 0.49 | 4.07 | p6mm |
| 15 | 573 | 88 | 0.57 | 4.18 |
p6mm/Ia![[3 with combining macron]](https://www.rsc.org/images/entities/char_0033_0304.gif) d d |
| 20 | 702 | 52 | 0.78 | 4.57 |
Ia![[3 with combining macron]](https://www.rsc.org/images/entities/char_0033_0304.gif) d d |
| 25 | 553 | 52 | 0.49 | 3.72 |
Ia![[3 with combining macron]](https://www.rsc.org/images/entities/char_0033_0304.gif) d/disordered d/disordered |
| 30 | 410 | 120 | 0.27 | 3.21 | Disordered |
2.3. Characterization
Powder X-ray Diffraction (XRD) patterns were conducted on a Rigaku 2200 diffractometer using Cu Kα radiation source (40 kV, 30 mA) with 2θ range from 0.6 to 5°. All the samples were scanned under the same conditions. Transmission electron microscopy (TEM) images were obtained on a JEM-2010HR microscope operated at 200 kV. The samples were crushed in an agate mortar, dispersed in ethanol by ultrasonic, and then collected using Cu grids covered by carbon films. Particles size and appearance of the produced PMOs were observed by a HITACHI S-4800 scanning electron microscope (SEM) at 10 kV. 13C and 29Si cross polarization (CP) nuclear magnetic resonance (NMR) spectra were recorded at room temperature on a Bruker AVANCE 400 spectrometer under the following conditions: a recycle delay of 3.0 s and 1469 times the number of acquisitions for 13C CP-MAS NMR spectra, and a recycle delay of 3.0 s and 903 the number of acquisitions for 29Si MAS NMR spectra. The specific surface areas and porous structures of the samples were determined by analyzing the results of nitrogen sorption at 77 K in a Micrometrics ASAP 2010 apparatus based on Brunauer–Emmett–Teller (BET) and Barrett–Joyner–Halenda (BJH) methods, respectively. Total pore volumes of all the materials were estimated from the amount of N2 adsorbed at a relative pressure, P/Po, of 0.99. Prior to the measurements, the samples were treated at 120 °C in vacuum for 8 h. Fourier-transform infrared (FTIR) spectra were measured by Bruker EQUINOX 55 FT-IR spectrometer with KBr tablets method. All the samples were dried at 105 °C for 72 h under vacuum in advance. The BPMOs-coated fibers prepared by direct coating method, and the solid-phase microextraction (SPME) measure procedures are based on the our previous work.19 Thermogravimetric analysis (TGA) was performed on a Netzsch TG-209 instrument at a heating rate of 10 °C min−1 under nitrogen atmosphere.3. Results and discussion
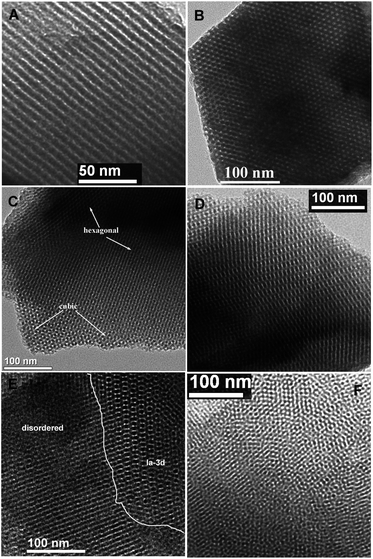
Highly ordered BPMOs with various mesostructure can be prepared by co-condensation of BTEB and TEVS using P123 as the template under acid conditions. Table 1 summarizes the structural characteristics of the BPMOs synthesized with a wide range of TEVS loading. It can be seen that the mesostructure changes from 2-D hexagonal to cubic Ia![[3 with combining macron]](https://www.rsc.org/images/entities/char_0033_0304.gif) d structure and finally disordered structure with increasing TEVS content (see Table 1). The transformation is also shown in the powder XRD patterns (see Fig. 2a and b). The samples containing 0, 5, and 10% molar percentage of TEVS display three XRD diffraction peaks (100, 110 and 200 as marked by asterisks) in the low-angle diffraction regime (see Fig. 2a), which can be assigned to well-ordered 2-D hexagonal (p6mm) mesostructure in each case. The structural assignments based on the XRD patterns are verified by TEM images (see Fig. 3A and B). For the sample with 15% TEVS, only a sharp diffraction peak together with a weak reflection (marked by arrow) is perceivable. TEM images imply that the products consisted of a mixture of hexagonal (p6mm) and cubic (Ia
d structure and finally disordered structure with increasing TEVS content (see Table 1). The transformation is also shown in the powder XRD patterns (see Fig. 2a and b). The samples containing 0, 5, and 10% molar percentage of TEVS display three XRD diffraction peaks (100, 110 and 200 as marked by asterisks) in the low-angle diffraction regime (see Fig. 2a), which can be assigned to well-ordered 2-D hexagonal (p6mm) mesostructure in each case. The structural assignments based on the XRD patterns are verified by TEM images (see Fig. 3A and B). For the sample with 15% TEVS, only a sharp diffraction peak together with a weak reflection (marked by arrow) is perceivable. TEM images imply that the products consisted of a mixture of hexagonal (p6mm) and cubic (Ia![[3 with combining macron]](https://www.rsc.org/images/entities/char_0033_0304.gif) d) mesostructured phases (see Fig. 3C), and this suggests that a phase transition occurs.
d) mesostructured phases (see Fig. 3C), and this suggests that a phase transition occurs.
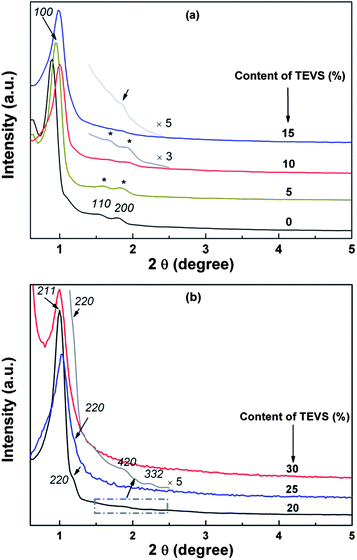 | ||
| Fig. 2 X-ray diffraction patterns of various mesostructure (a) and (b) BPMOs with different molar percentages of TEVS. | ||
With increasing of TEVS molar percentage to 20%, pronounced changes in the diffraction pattern (see Fig. 2b, marked by arrows) are observed, a shift of the first intense reflection to 211 and a shoulder on the right hand side of the reflection [220] appeared. In addition, two broad diffraction peaks in the range of 2θ = 1.5–2.5 degree are indexed to [321] and [420] reflection of the Ia3d space group.41 These are indicative of the transformation from the hexagonal mesostructure to cubic Ia![[3 with combining macron]](https://www.rsc.org/images/entities/char_0033_0304.gif) d symmetry, which can be further substantiated by TEM images (see Fig. 3D). An analogous phase transition from hexagonal to cubic Ia
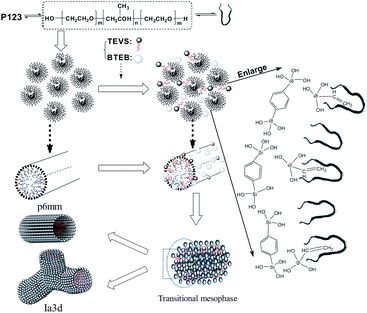
d symmetry, which can be further substantiated by TEM images (see Fig. 3D). An analogous phase transition from hexagonal to cubic Ia![[3 with combining macron]](https://www.rsc.org/images/entities/char_0033_0304.gif) d structure has been observed in previous synthesis of mesoporous silica,38,41,43,45 in this case the organic additives as co-structure directing agents are usually involved. However, they could not offer more details about vinyl groups act as a “pending” functional group influencing the hydrophobic–hydrophilic ratio (VH/VL) in the previously synthesis routes. Clearly, there are several different interactions, such as hydrogen bonding, hydrophobic interaction, between the two precursors and surfactant molecules at the micelle–water interface could contribute cooperatively to co-assemble in mesostructure. To the best of our knowledge, the mesophase transformation mainly due to the strong hydrophobic interaction between the nonpolar vinyl groups and the hydrophobic hydrocarbon tails of the P123 molecules in this study. Herein, the addition of TEVS can act as the effective co-surfactant so that the VH/VL will be increased, thus resulting in a change of the curvature of the micelle. It is conceivable that more and more terminal vinyl groups are intercalated into the micelles with molar percentage of TEVS increasing, as shown in Fig. 1. This leads to a mesophase transition from higher curved surface (2D hexagonal, p6mm) to a lower cured surface (biscontinuous cubic, Ia
d structure has been observed in previous synthesis of mesoporous silica,38,41,43,45 in this case the organic additives as co-structure directing agents are usually involved. However, they could not offer more details about vinyl groups act as a “pending” functional group influencing the hydrophobic–hydrophilic ratio (VH/VL) in the previously synthesis routes. Clearly, there are several different interactions, such as hydrogen bonding, hydrophobic interaction, between the two precursors and surfactant molecules at the micelle–water interface could contribute cooperatively to co-assemble in mesostructure. To the best of our knowledge, the mesophase transformation mainly due to the strong hydrophobic interaction between the nonpolar vinyl groups and the hydrophobic hydrocarbon tails of the P123 molecules in this study. Herein, the addition of TEVS can act as the effective co-surfactant so that the VH/VL will be increased, thus resulting in a change of the curvature of the micelle. It is conceivable that more and more terminal vinyl groups are intercalated into the micelles with molar percentage of TEVS increasing, as shown in Fig. 1. This leads to a mesophase transition from higher curved surface (2D hexagonal, p6mm) to a lower cured surface (biscontinuous cubic, Ia![[3 with combining macron]](https://www.rsc.org/images/entities/char_0033_0304.gif) d).15,46 That can entirely explain the XRD pattern when the amount of TEVS is increased to 20%.
d).15,46 That can entirely explain the XRD pattern when the amount of TEVS is increased to 20%.
In this work, the BPMOs with 15% TEVS might present a mixed mesophases (coexistence of 2D hexagonal and cubic Ia![[3 with combining macron]](https://www.rsc.org/images/entities/char_0033_0304.gif) d mesostructure as shown in Fig. 3C). On the other hand, higher TEVS molar percentage such as 25 and 30%, leads to a less ordered mesostructure as indicated by XRD diffraction peaks (see Fig. 2b), which is also substantiated by TEM images (see Fig. 3E and F). Note that the degree of mesostructural order and the porosity of the resulting materials usually decrease with increasing loading of terminal functional groups.24 These phenomena can be correlated to the obvious reduction in the crosslink density of BPMOs due to incorporating TEVS that possesses fewer hydrolysable groups (3 in TEVS vs. 6 in BTEB).
d mesostructure as shown in Fig. 3C). On the other hand, higher TEVS molar percentage such as 25 and 30%, leads to a less ordered mesostructure as indicated by XRD diffraction peaks (see Fig. 2b), which is also substantiated by TEM images (see Fig. 3E and F). Note that the degree of mesostructural order and the porosity of the resulting materials usually decrease with increasing loading of terminal functional groups.24 These phenomena can be correlated to the obvious reduction in the crosslink density of BPMOs due to incorporating TEVS that possesses fewer hydrolysable groups (3 in TEVS vs. 6 in BTEB).
Fig. 4 (and ESI Fig. S1†) display N2 adsorption–desorption isotherms obtained at 77 K for BPMOs and the corresponding pore size distribution curves (inset). The isotherms of the BPMOs with various TEVS contents belong to type-IV with clear capillary condensation steps, suggesting uniform mesopores. Besides, with increasing of TEVS contents, the BPMOs exhibit clear adsorption uptake at low relative pressure, suggesting the existence of plentiful micropores. As shown in Table 1, the average pore diameter (Dp), pore volumes (VT) and surface areas are strongly dependent on the loading of TEVS, keeps pace with the mesophases transformation. With increasing TEVS content from 0 to 10% in the synthetic gel, the average pore diameters (Dp) and pore volumes (VT) gradually reduce which can be probably attributed to the pendent vinyl groups having occupied the pore space to a certain extent. It is worthy noted that the BPMOs materials contain a large amount of micropores additional to the mesopores (see Table 1). This is probably attributed to the EO chains (P123) and/or vinyl groups penetrating into the silica network. While the TEVS percentage is further increased to 20%, the textural data gives an ascending trend. It is worthy to note that the Dp and VT are in between that of 10% and 20% when the TEVS percentage is 15%. These phenomena are consistent with the XRD and TEM measurements, strongly suggesting the phase transition from p6mm to Ia![[3 with combining macron]](https://www.rsc.org/images/entities/char_0033_0304.gif) d. On the other hand, all the values of Dp and VT tend to decline when the TEVS loading rises to 25 and 30%, while the mesostructure regularities of BPMOs gradually decrease. Moreover, the specific surface areas (SBET) of the BPMOs samples were in the range from 500 to 700 m2 g−1, which is slightly lower than the reported values for vinyl-functional PMOs.16,22
d. On the other hand, all the values of Dp and VT tend to decline when the TEVS loading rises to 25 and 30%, while the mesostructure regularities of BPMOs gradually decrease. Moreover, the specific surface areas (SBET) of the BPMOs samples were in the range from 500 to 700 m2 g−1, which is slightly lower than the reported values for vinyl-functional PMOs.16,22
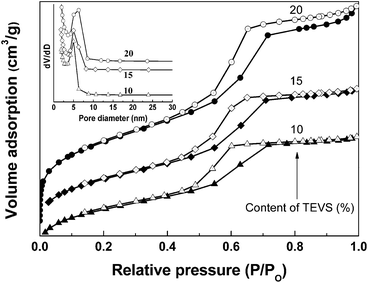 | ||
| Fig. 4 N2 adsorption–desorption isotherms and corresponding pore size distributions (inset) of BPMOs with various molar percentages of TEVS. | ||
To view the connectivity of phenylene, silicate and vinyl groups, 29Si NMR spectra of the BPMOs with different molar ratios of BTEB/TEVS are collected. As shown in Fig. 5a, the sample with 0% TEVS display two signals at −74.3, −66.4 ppm. While the samples containing 10 and 20% have similar 29Si NMR spectra, showing three signals at −74.3, −66.4 and −57.4 ppm, respectively. Generally, the C2H3SiO1.5 resonances should appear at lower chemical shift regime as compared with ArSiO1.5. Thus, the two signals at −74.3 and −66.4 ppm can be assigned as T2 and T3 for the Si attached with phenylene, while the others at −57.4 and −66.4 ppm belong to T2′ and T3′ for the Si connected with vinyl groups.23 Unfortunately, the presence of Q3 signals [Si(OSi)3(OH)] suggests that a little carbon–silicon cleavage happens after synthesis and surfactant extraction.
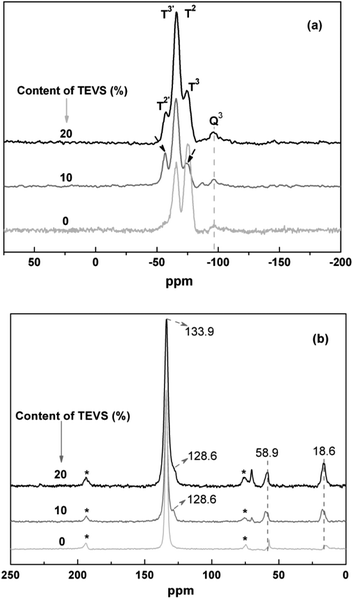 | ||
| Fig. 5 Solid-state (a) 29Si and (b) 13C NMR spectra for BPMOs with various molar percentages of TEVS. The bands in (b) marked by asterisks represent spinning sidebands. | ||
13C NMR spectra for the BPMOs are depicted in Fig. 5b. The signals at 133.9 and 128.6 ppm are assigned to the carbons in phenyl and vinyl groups, respectively.22,43 it is also confirm that the vinyl groups incorporated into the BPMOs and remains intact during the synthesis and solvent extraction. Due to the interference or overlap of the phenylene peak, the vinyl groups at 128.6 ppm present itself as a shoulder. Additionally, the resonance peaks at 16.3 ppm and 58.9 ppm are assigned to the carbons in the surface ethoxy groups (Si–OCH2CH3), which were formed during surfactant extraction by acidified ethanol. Besides, some bands at around 70–75 ppm are attributed to the carbon species of remainder of the nonionic surfactant P123.
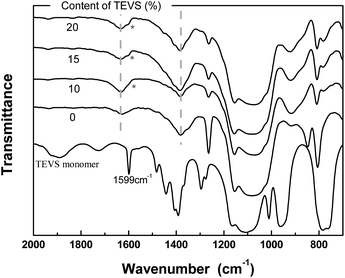
To further analyze the chemical structure of the BPMOs, their FTIR spectra are inspected (see Fig. 6). The phenylene peaks at 1380 and 1627 cm−1 are evident for all samples, which mask the characteristic band of the vinyl groups at around 1600 cm−1.22 Nevertheless, the appearance of the shoulder at 1599 cm−1 reflects the existence of vinyl groups. In other words, these analyses also support the conclusions made from the discussion of the solid-state 13C NMR spectra.
TGA of as-synthesized and solvent-extracted PMO samples containing 15% TEVS were conducted under nitrogen atmosphere (see Fig. 7). About 4% of weight loss below 100 °C is attributed to the removal of physical water. The subsequent weight loss between 100 and 318 °C (∼9% for the solvent-extracted samples and 40% for as-synthesized samples) can be mostly attributed to P123 decomposition. The further weight loss at temperature higher than 318 °C should be due to partial decomposition of the organic groups (vinyl and phenylene groups) in BPMOs.
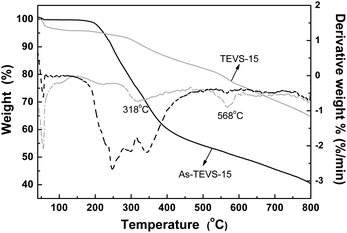 | ||
| Fig. 7 TGA and corresponding DTG curves of as-synthesized (black) and solvent-extracted (little gray) BPMOs with 15% TEVS under nitrogen atmosphere. | ||
Particle morphologies of BPMOs were investigated using the SEM technique. As shown in Fig. 8, the content of TEVS plays an essential role in the morphology of BPMOs. With a rise in TEVS content, the morphology is changed from rod-like (0% TEVS) to bended rod-shaped (5% TEVS), irregular particles (10% TEVS), and aggregation of spheroidic particles (15 and 20% TEVS). From the above results, we could see that the incorporation of TEVS definitely affects the particles morphology, which is consistent with the variation trend of the mesostructure. It is ascribed to the vinyl groups that act as a co-solvent, affecting the micelle curvature and growth of the micellar aggregates.15 Therefore, it can be assumed that the rod-shaped particles are formed through hexagonal package of self-assembled flexible rod-like micelles, while the spherical particles arise from the aggregated Ia![[3 with combining macron]](https://www.rsc.org/images/entities/char_0033_0304.gif) d phases. Meanwhile, it is noted that particle sizes increased with larger amount of TEVS contained in the BPMOs.
d phases. Meanwhile, it is noted that particle sizes increased with larger amount of TEVS contained in the BPMOs.
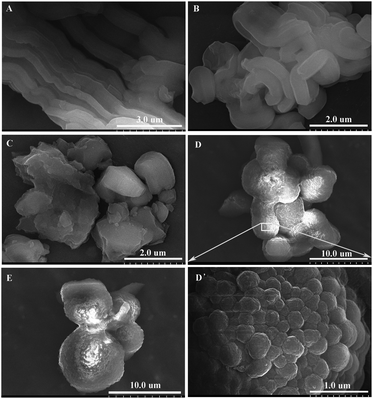 | ||
| Fig. 8 SEM images of BPMOs with various molar percentages of TEVS: (A) 0%, (B) 5%, (C) 10%, (D) and (D′, partly enlarge) 15%, (E) 20%. | ||
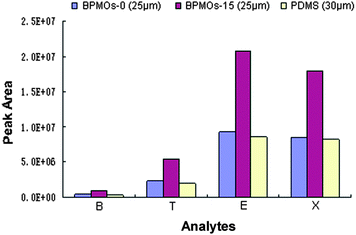
To examine the potential applications of the presented BPMOs, we selected BPMOs-0, BPMOs-15 as the coating adsorbent, used to prepare fibres for the SPME.19,45 As shown in Fig. 9, the BPMOs-coated fibers both have better extraction performance than the commercial 30 μm PDMS fiber. It should be noted that the BPMOs-15-coated fiber exhibit much better extraction efficiency than that of the commercial fiber, although its thickness was thinner (25 μm). On the one hand, the BPMOs-coated fibers possess high specific surface area, ordered mesostructure and more open framework, which can provide a good transportation and adsorption ability to the BTEX compounds. On the other hand, it is mainly attributed to abundant of vinyl groups are bound on pore surface of the BPMOs-15, thus higher π–π interaction, hydrophobic interaction will be occurred between the fiber and the analytes, thereby enhance the affinity of the fiber to BTEX.19 As a result, the BPMOs-15-coated fiber present better extraction performance than the BPMOs-0-coated and PDMS fibers.
4. Conclusions
Cubic BPMOs with Ia![[3 with combining macron]](https://www.rsc.org/images/entities/char_0033_0304.gif) d symmetry that combine rigid phenylene-bridged organosilica with vinyl groups were successfully prepared in this work for the first time. The BPMOs materials were obtained by co-condensation of BTEB and TEVS using triblock copolymer P123 as the template under acid conditions. This reaction system can provide a way to fabricate 2-D hexagonal p6mm and cubic Ia
d symmetry that combine rigid phenylene-bridged organosilica with vinyl groups were successfully prepared in this work for the first time. The BPMOs materials were obtained by co-condensation of BTEB and TEVS using triblock copolymer P123 as the template under acid conditions. This reaction system can provide a way to fabricate 2-D hexagonal p6mm and cubic Ia![[3 with combining macron]](https://www.rsc.org/images/entities/char_0033_0304.gif) d mesostructures with large pores, thereby favoring the accessibility of vinyl groups. It is worthy to note that the TEVS not only acted as the functionalized agent in the synthesis, but also act as a “pending” functional group influencing the micelle curvature and growth of the micellar aggregates, which was proven to be crucial for the mesophase transformation. Additionally, such functional materials possess a more open framework and relatively large mesopores could have promising applications for selective adsorb and separate.
d mesostructures with large pores, thereby favoring the accessibility of vinyl groups. It is worthy to note that the TEVS not only acted as the functionalized agent in the synthesis, but also act as a “pending” functional group influencing the micelle curvature and growth of the micellar aggregates, which was proven to be crucial for the mesophase transformation. Additionally, such functional materials possess a more open framework and relatively large mesopores could have promising applications for selective adsorb and separate.
Acknowledgements
This work was supported by the NSF of China (Grants 31200438 and 31170521), Scientific Research Fund of Hunan Provincial Education Department, China (Grant 12B135), Doctoral Program Foundation of Institutions of Higher Education of China (Grant 20124321120002) and Youth Scientific Research Foundation of Central South University of Forestry & Technology (Grant QJ2011032B).Notes and references
- T. Asefa, M. J. MacLachlan, N. Coombs and G. A. Ozin, Nature, 1999, 402, 867 CAS.
- S. Inagaki, S. Guan, Y. Fukushima, T. Ohsuna and O. Terasaki, J. Am. Chem. Soc., 1999, 121, 9611 CrossRef CAS.
- B. J. Melde, B. T. Holland, C. F. Blanford and A. Stein, Chem. Mater., 1999, 11, 3302 CrossRef CAS.
- M. P. Kapoor and S. Inagaki, Bull. Chem. Soc. Jpn., 2006, 79, 1463 CrossRef CAS.
- Y. Yamauchi, N. Suzuki, L. Radhakrishnan and L. Wang, Chem. Rec., 2009, 9, 321 CrossRef CAS PubMed.
- W. J. Hunks and G. A. Ozin, Chem. Commun., 2004, 2426 RSC.
- L. Zhao, G. Zhu, D. Zhang, Y. Di, Y. Chen, O. Terasaki and S. Qiu, J. Phys. Chem. B, 2005, 109, 765 Search PubMed.
- E.-B. Cho, D. J. Kim and M. Jaroniec, Langmuir, 2007, 23, 11844 CrossRef CAS PubMed.
- R. M. Grudzien, B. E. Grabicka, S. Pikus and M. Jaroniec, Chem. Mater., 2006, 18, 1722 CrossRef CAS.
- X. W. Wu, J. F. Ruan, T. Ohsuna, O. Terasaki and S. N. Che, Chem. Mater., 2007, 19, 1577 CrossRef CAS.
- W. H. Zhang, X. N. Zhang, L. X. Zhang, F. Schroeder, P. Harish, S. Hermes, J. L. Shi and R. A. Fischer, J. Mater. Chem., 2007, 17, 4320 RSC.
- T. Shimada, K. Aoki, Y. Shinoda, T. Nakamura, N. Tokunaga, S. Inagaki and T. Hayashi, J. Am. Chem. Soc., 2003, 125, 4688 CrossRef CAS PubMed.
- A. Sayari and W. Wang, J. Am. Chem. Soc., 2005, 127, 12194 CrossRef CAS PubMed.
- J. Morell, G. Wolter and M. Fröba, Chem. Mater., 2005, 17, 804 CrossRef CAS.
- C. Vercaemst, M. Ide, H. Friedrich, K. P. Jong, F. Verpoort and P. V. Dervoort, J. Mater. Chem., 2009, 19, 8839 RSC.
- T. Asefa, M. Kruk, M. J. MacLachlan, N. Coombs, H. Grondey, M. Jaroniec and G. A. Ozin, J. Am. Chem. Soc., 2001, 123, 8520 CrossRef CAS PubMed.
- R. K. Zeidan, S.-J. Hwang and M. E. Davis, Angew. Chem., Int. Ed., 2006, 45, 6332 CrossRef CAS PubMed.
- J. Alauzun, A. Mehdi, C. Reyé and R. J. P. Corriu, J. Am. Chem. Soc., 2006, 128, 8718 CrossRef CAS PubMed.
- F. Zhu, Y. J. Liang, L. Y. Xia, M. Z. Rong, C. Y. Su, R. Lai, R. Y. Li and G. F. Ouyang., J. Chromatogr., A, 2012, 1247, 42 CrossRef CAS PubMed.
- C. C. Ting, C. H. Chung and H. M. Kao, Chem. Commun., 2011, 47, 5897 RSC.
- W. Wang, S. Xie, W. Zhou and A. Sayari, Chem. Mater., 2004, 16, 1756 CrossRef CAS.
- L. Y. Xia, M. Q. Zhang, M. Z. Rong and W. M. Xu, Phys. Chem. Chem. Phys., 2010, 12, 10569 RSC.
- Q. Yang, M. P. Kapoor and S. Inagaki, J. Am. Chem. Soc., 2002, 124, 9694 CrossRef CAS PubMed.
- J. Morell, M. GEngerich, G. Wolter, J. Jiao, M. Hunger, P. J. Klar and M. Fröba, J. Mater. Chem., 2006, 16, 2809 RSC.
- S. Z. Qiao, C. X. Lin, Y. G. Jin, Z. Li, Z. M. Yan, Z. P. Hao, Y. N. Huang and G. Q. Lu, J. Phys. Chem. C, 2009, 113, 8673 CAS.
- G. Wang, A. N. Otuonye, E. A. Blair, K. Denton, Z. Tao and T. Asefa, J. Solid State Chem., 2009, 182, 1649 CrossRef CAS PubMed.
- S. Inagaki, S. Guan, T. Ohsuna and O. Terasaki, Nature, 2002, 416, 304 CrossRef CAS PubMed.
- Y. Goto and S. Inagaki, Chem. Commun., 2002, 2410 RSC.
- K. Landskron, B. D. Hatton, D. D. Perovic and G. A. Ozin, Science, 2003, 302, 266 CrossRef CAS PubMed.
- O. Olkhovyk and M. Jaroniec, J. Am. Chem. Soc., 2005, 127, 60 CrossRef CAS PubMed.
- C. Vercaemst, M. Ide, B. Allaert, N. Ledoux, F. Verpoort and P. Van Der Voort, Chem. Commun., 2007, 2261 RSC.
- M. P. Kapoor and S. Inagaki, Chem. Mater., 2002, 14, 3509 CrossRef CAS.
- Y. Liang, M. Hanzlik and R. Anwander, J. Mater. Chem., 2006, 16, 1238 RSC.
- H. I. Lee, C. Pak, S. H. Yi, J. K. Shon, S. S. Kim, B. G. So, H. Chang, J. E. Yie, Y. U. Kwon and J. M. Kim, J. Mater. Chem., 2005, 15, 4711 RSC.
- X. Zhou, S. Qiao, N. Hao, X. Wang, C. Yu, L. Wang, D. Zhao and G. Q. Lu, Chem. Mater., 2007, 19, 1870 CrossRef CAS.
- M. P. Kapoor, M. Yanagi, Y. Kasama, T. Yokoyama, S. Inagaki, T. Shimada, H. Nanbu and L. R. Juneja, J. Mater. Chem., 2006, 16, 3305 RSC.
- Y. Liang, E. S. Erichsen, V. Hanzlik and R. Anwander, Chem. Mater., 2008, 20, 1451 CrossRef CAS.
- W. P. Guo, F. Kleitz, K. Cho and R. Ryoo, J. Mater. Chem., 2010, 20, 8257 RSC.
- E. B. Cho, D. Kim, J. Górka and M. Jaroniec, J. Mater. Chem., 2009, 19, 2076–2081 RSC.
- H. Y. Wu, C.-T. Chen, I.-M. Hung, C.-H. Liao, V. Vetrivel and H.-M. Kao, J. Phys. Chem. C, 2010, 114, 7021 CAS.
- X. Y. Liu, B. Z. Tian, C. Z. Yu, F. Gao, S. H. Xie, B. Tu, R. C. Che, L.-M. Peng and D. Y. Zhao, Angew. Chem., Int. Ed., 2002, 41, 3876 CrossRef CAS.
- J. W. Tang, C. Z. Yu, X. F. Zhou, X. X. Yan and D. Y. Zhao, Chem. Commun., 2004, 2240 RSC.
- Y. Q. Wang, C. M. Yang, B. Zibrowius, B. Spliethoff, M. Lindén and F. Schüth, Chem. Mater., 2003, 15, 5029 CrossRef CAS.
- T. A. Jones, C. D. Wood, C. Dickinson and Y. Z. Khimyak, Chem. Mater., 2008, 20, 3385 CrossRef.
- T. W. Kim, F. Kleitz, B. Paul and R. Ryoo, J. Am. Chem. Soc., 2005, 127, 7601 CrossRef CAS PubMed.
- Y. Q. Wang, Y. J. Wang, C. M. Yang, G. Z. Lu and F. Schüth, Langmuir, 2006, 22, 5491 CrossRef CAS PubMed.
Footnote |
| † Electronic supplementary information (ESI) available: Fig. S1, N2 adsorption–desorption isotherms. See DOI: 10.1039/c3ra46178e |
| This journal is © The Royal Society of Chemistry 2014 |

