A DNA–Ag cluster as a sensor for BODIPY isomers and HepG-2 cells†
Ting-Ting Zhaoab,
Qiu-Yun Chen*ab,
Pei-Dong Wanga and
Zhi-Peng Chena
aSchool of Chemistry and Chemical Engineering, Jiangsu University, 301 Xuefu Road, Zhenjiang, 212013, P. R. China
bState Key Laboratory of Coordination Chemistry, Nanjing University, 210093, P. R. China. E-mail: chenqy@ujs.edu.cn; Fax: +86051188791602; Tel: +86051188791800
First published on 3rd January 2014
Abstract
The isomers of BODIPY exhibit different cytotoxicities in the cancer treatment process. A type of homoduplex structure, DNA–Ag nanoclusters (DNA–AgNCs), was prepared to distinguish a para-substitued-BODIPY (C2) from a meta-substitued-BODIPY (C1) by their fluorescent quenching constants. Intercalation of C2 to the homoduplex and effective energy transfer in the conjugated system, formed by the coordination of the Ag in DNA–AgNCs with the N atoms of the two pyridines, were found to be two key factors for DNA–AgNCs to recognize the special isomers of BODIPY and therefore enhance the emission of C2. The high sensitivity of DNA–AgNCs to total protein from HepG-2 cells makes it a potential sensor for cancer cells with high expression of hypoxia-inducible factor.
Introduction
DNA–Ag nanoclusters (DNA–AgNCs), as a new type of fluorescent marker, have attracted significant attention in bio-labelling and in chemical and biological sensing due to their fluorescence control properties and high fluorescence sensitivity.1–3 For example, a multi-DNA–AgNC based on a template containing a recognition sequence and C-rich oligonucleotides has been constructed to detect the change of HIF (hypoxia-inducible factor) in cancer cells in vitro.4 The fluorescence intensity changes upon the interaction between the target substance and the oligonucleotides template, which enable a sensitive in situ detection of the analyte using fluorescence spectroscopy, so DNA–Ag can be used in the detection of single-stranded DNA binding protein (SSB) and complementary DNA.5 All of these assays feature fluorescent DNA–AgNCs that can be synthesized by varying the nucleobase sequence. Because of the high binding affinity of silver toward sulfur, DNA–AgNCs have been used for detection of biothiols and thiol-containing pharmaceuticals.6 Xiaoda Yang reported a sensitive method for determination of N-acetylcysteine (NAC) based on the red fluorescence quenching of oligonucleotide-protected silver nanoclusters (AgNCs) where the DNA-template of the AgNCs was partly replaced by NAC.7 However, there is no report on the fluorescence of DNA–AgNCs to distinguish organic isomers so far. Currently, the fluorescence sensing mechanism of synthesized DNA–AgNCs probes can be summarised as follows: (1) a conformational change induced by the target, such as the detection of K+, H+, Cu2+ and hemin;8–10 (2) interaction with the silver core, for instance, GSH (glutathione) can be detected due to the disturbance of the Ag core by forming a Ag–S bond;5,6 (3) blocking electron transfer in the DNA–Ag system, such as the detection of single-stranded DNA binding protein, hypoxia-inducible factor, aptamers, and RNA, which is based on the partial binding to DNA template.1,4,11,12 An electron transfer quenching mechanism has been implemented to develop quantum dot (QD)-based aptasensors.13 For example, the anti-thrombin aptamer nucleic acid sequence, which was linked to CdSe–ZnS QDs, was blocked by a complementary nucleic acid to form a duplex. The intercalation of doxorubicin into the blocked duplex structure led to electron transfer quenching of the QDs. Based on the intrinsic electron–hole transport properties, specific conformations and accompanying conformational changes when interacting with drugs, DNA–AgNCs may be used as a probes to sense specific isomers of organic compounds.4,4-Difluoro-1,3,5,7-tetramethyl-4-bora-3a,4a-diaza-s-indacene (BODIPY) derivatives represent a unique class of fluorophores, which has found important applications in chemical biology and biomolecular chemistry.14 Two fluorescence chemosensors, based upon conjugation of BODIPY and di(2-picolyl)amine via two benzyl group spacers, have been found to selectively sense copper(II) ions and to image mitochondria in vitro. However, the two analogous compounds exhibit different cytotoxicity to HepG-2 cells.15 Generally, the emission quenching mechanism of the EB–DNA system (EB, ethidium bromide) is used to evaluate the intercalation of anticancer compounds to DNA.16a,b BODIPY derivatives have long-wavelength absorption and fluorescence emission. The interaction of anticancer drugs with DNA is very important to analyse drug cytotoxicity. So, it is possible to use DNA–AgNCs as a fluorescent probe to analyze cytotoxicity.
Here, a new type of near-infrared fluorescent DNA–AgNC with emission at 770–800 nm has been constructed and it is based on the specific DNA sequence, 5′-C3AC3AC3GC3A-CTAC![[G with combining low line]](https://www.rsc.org/images/entities/char_0047_0332.gif)
![[T with combining low line]](https://www.rsc.org/images/entities/char_0054_0332.gif)
![[G with combining low line]](https://www.rsc.org/images/entities/char_0047_0332.gif) CT-3′. It is interesting to find that fluorescent DNA–AgNCs show different fluorescence responses to two isomers of BODIPY derivatives (C1 and C2, Scheme S1†), which have different anticancer activities. A new mechanism for the fluorescence sensing, has been suggested. Moreover, the near-infrared fluorescent DNA–AgNCs show high sensitivity for the total protein from HepG-2 cells due to the specific homoduplex structure of the DNA–AgNCs.
CT-3′. It is interesting to find that fluorescent DNA–AgNCs show different fluorescence responses to two isomers of BODIPY derivatives (C1 and C2, Scheme S1†), which have different anticancer activities. A new mechanism for the fluorescence sensing, has been suggested. Moreover, the near-infrared fluorescent DNA–AgNCs show high sensitivity for the total protein from HepG-2 cells due to the specific homoduplex structure of the DNA–AgNCs.
Results and discussion
Characterization of DNA-based silver nanoclusters
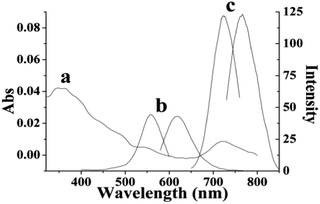
A new type of DNA-based silver nanoclusters has been successfully synthesized using 5′-C3AC3AC3GC3A-CTACGTGCT-3′as the template. The size of the DNA–AgNCs is in the range of 0.5–2 nm (Fig. S1A†), the main emission maximum is at 770–800 nm when excited at 730–750 nm (Fig. 1). The UV absorption peaks of AgNCs are at 350, 540 and 720 nm. The peaks at 350 nm and 720 nm correspond to the distinguishing absorption of the AgNCs,17a while the peak at 540 nm is from the surface plasmon resonance of silver nanoparticles.17b The CD spectrum of the free DNA has a positive band at 286 nm and a negative band at 210 nm, which is characteristic of C-quadruplexes, and it also has negative bands around 240–260 nm (Fig. 2). It has been reported that the negative band at 245 nm and the positive bands around 260–280 nm are characteristic bands of B-form DNA. The antiparallel G-quadruplexes are characterized by a positive band at 290 nm and a negative band at 260 nm. So we deduce that the free DNA is B-form DNA with C- and G-quadruplexes. The conformation of the DNA changes greatly after the synthesis of the DNA–AgNCs. The positive band becomes smaller and the negative band becomes deeper. The former indicates the presence of guanine–guanine stacking and the disruption of the C-quadruplexes caused by Ag–N bonds between the Ag and DNA, demonstrated by the peak at 240 cm−1 in the Raman spectra (Fig. S1B†). The latter indicates interstrand adenine–adenine interactions mediating a duplex formation.18 Also, the slightly acidic buffer ( citrate buffer pH 5.0) and the sequence GpA (5′-CT![[A with combining low line]](https://www.rsc.org/images/entities/char_0041_0332.gif)
![[C with combining low line]](https://www.rsc.org/images/entities/char_0043_0332.gif)
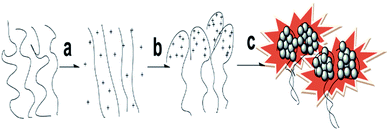
![[G with combining low line]](https://www.rsc.org/images/entities/char_0047_0332.gif) TGCT-3′) are important for the formation of the parallel homoduplex. So, the main conformation of DNA in the DNA–AgNCs is a parallel homoduplex. The synthesis process of the DNA–AgNCs is shown in Scheme 1. When heating the DNA solution, the hydrogen bond of the base pairs in the DNA break, resulting in a free state DNA. So highly Ag+-loaded DNA complexes were obtained after the temperature shifted from 71 °C (Tm of the template oligonucleotides) to 25 °C. The newly formed DNA–Ag+ complex was reduced to DNA–Ag by NaBH4 and then gathered to form the fluorescence homoduplex-DNA–AgNCs at 4 °C.
TGCT-3′) are important for the formation of the parallel homoduplex. So, the main conformation of DNA in the DNA–AgNCs is a parallel homoduplex. The synthesis process of the DNA–AgNCs is shown in Scheme 1. When heating the DNA solution, the hydrogen bond of the base pairs in the DNA break, resulting in a free state DNA. So highly Ag+-loaded DNA complexes were obtained after the temperature shifted from 71 °C (Tm of the template oligonucleotides) to 25 °C. The newly formed DNA–Ag+ complex was reduced to DNA–Ag by NaBH4 and then gathered to form the fluorescence homoduplex-DNA–AgNCs at 4 °C.
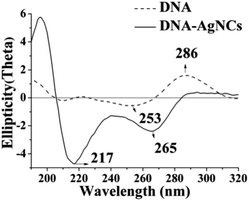 | ||
| Fig. 2 CD spectra of DNA–AgNCs in 0.5 mM citrate buffer (pH 5.0): (solid line) no Ag; (dashed line) DNA–AgNCs. | ||
The sensitivity for BODIPY derivatives and sensing mechanism
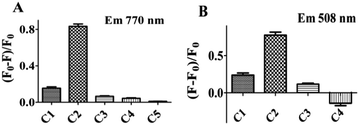
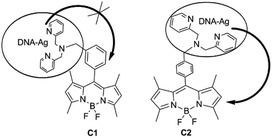
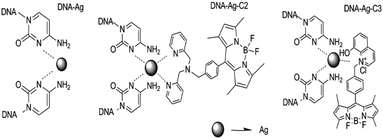
In order to study whether there is an energy transfer between substituted BODIPY (C1 and C2) and the DNA–AgNCs, we measured the fluorescence sensing of 8-[di(2-picolyl)amine-3-benzyl]-4,4-difluoro-1,3,5,7-tetramethyl-4-bora-3a,4a-diaza-s-indacene (C1) and 8-[di(2-picolyl)amine-4-benzyl]-4,4-difluoro-1,3,5,7-tetramethyl-4-bora-3a,4a-diaza-s-indacene (C2) by DNA–AgNCs (Fig. S2†). The two compounds (C1 and C2) have an effect on the emission of the DNA–AgNCs at 770 nm. The quenching constants of C1 and C2 are about 0.179, and 0.84 respectively, indicating that C2 decreased the emission much more than C1. So the synthesized fluorescent probe can be used to distinguish the isomers in the range of 4–80 μM (Fig. S3†).In order to study the mechanism, the effect of the BODIPY derivatives 8-(N-benzyl-8-hydroxylquinolinium)-4,4-difluoro-1,3,5,7-tetramethyl-4-bora-3a,4a-diaza-s-indacene choloride (C3) and 8-(N-benzyl-4-acetylpyridium)-4,4-difluoro-1,3,5,7-tetramethyl-4-bora-3a,4a-diaza-s-indacene chloride (C4) as well as 4,4′-dimethy-2′2-dipyridine (C5) on the fluorescence were tested. It is interesting to note that all of them (C3–C5) showed a weak effect on the emission of DNA–Ag (770 nm), even smaller than that of C1. The quenching constants of C3–C5 are 0.085, 0.063 and 0.01 respectively (Fig. 3A). So, we deduce that the BODIPY moiety in C2 or the pyridyl groups themselves are not the main reason for the quenching. According to the Hammett equation, para-electron substitution is better than meta-substitution in facilitating electron transfer which leads to the quenching of the luminescence of quantum dots,13,19 therefore, we deduce that the para-substituted group (di(pyridylmethyl)amine) in the benzyl group of C2 leads to a higher electron transfer efficiency from the DNA–AgNCs to the BODIPY moiety than meta-substituted C1, resulting in the emission at 770 nm (Scheme 2).
The positive (275–285 nm) and negative (245 nm) bands in the CD spectra move up integrally, reflecting the change of spiral in the double helix resulting from the embedding of the compounds C1 or C2 (Fig. S4A and D†).20a,b In order to study the mode of action of the compounds, the induced circular dichroism (ICD) of the compounds was tested. In the ICD spectra of the DNA–Ag–C1 system (Fig. S4B and C†), the multiple positive peaks around 300–450 nm are caused by the binding of C1 to the major groove of the DNA–AgNCs which can be bonded in multiple directions.20c The affinity of C1 to the major groove in the form of Genin dimers or oligomers was further demonstrated by the appearance for one negative band at 495 nm and one positive band at 505 nm (Fig. S4C†).20d However, C2 can intercalate the DNA–AgNCs as shown by the appearance of one negative band at 395 nm in the ICD spectrum of the DNA–Ag–C2 complexes (Fig. S4E†).20e So the quenching constants may be affected by the mode of action of the compounds on the DNA–AgNCs.
Next, the influence of the DNA–AgNCs on the fluorescence of the compounds was also tested. The results are shown in Fig. 3B. The emission of C1, C2 and C3 increased with the addition of DNA–AgNCs indicating a different method of energy transfer from the DNA–AgNCs to the electron donating group BODIPY (C1, C2, C3). The significant increase in emission of C2 at 508 nm is lead by the quenching of DNA–Ag (at 770 nm) by transfer of energy to C2. However, the decreasing emission of C4 indicates the influence of the electron withdrawing group (carbonyl group) in BODIPY on the energy transfer between the BODIPY moiety and the DNA–AgNCs. For the sake of a better understanding of the transfer mechanism, we make the following speculation. In addition to the cytosine N3 atom, the Ag can coordinate to both the N atoms of the pyridines from the dpa-DOBIPY forming a conjugated system, which can facilitate the energy transfer from the DNA–AgNCs to C1 or C2. This conjugated system is one important factor for the increasing emission of C1 and C2, which is two times larger with two pyridines, relative to that of C3 with one pyridine (Scheme 3).
The sensitivity for HIF in total protein from HepG-2 cell
Hypoxia-inducible factor (HIF) is the core transcription factor in regulating oxygen homeostasis and plays an important role in the formation of cancer cells.21a It is well known that most cancer cells are in an oxygen deficient environment due to their metabolism. So HIF-1 is more highly expressed in most cancer cells than in normal cells, especially for HepG-2 cells. However, the amount of HIF-1 is still not enough to be tested by an efficient method other than electrophoresis, which is complicated and expensive. So, it is important and necessary to develop a simple and economic method to detect HIF. The DNA sequence containing 5′-R![[C with combining low line]](https://www.rsc.org/images/entities/char_0043_0332.gif)
![[G with combining low line]](https://www.rsc.org/images/entities/char_0047_0332.gif)
![[T with combining low line]](https://www.rsc.org/images/entities/char_0054_0332.gif)
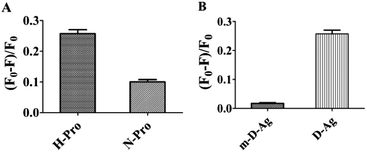
![[G with combining low line]](https://www.rsc.org/images/entities/char_0047_0332.gif) -3′ was identified as a HIF-1 specific binding site on the hypoxia response element (HRE) of many different metabolic related enzyme genes.21b,c The sensitivity of the synthesized DNA–AgNCs to HIF-1 was studied. The fluorescence emission of the DNA–AgNCs decreased with increasing concentration of total protein from HepG-2 (Fig. S5†). Although both the total protein from HepG-2 and normal cells could decrease the emission of the DNA–AgNCs, the fluorescence quenching constant of the total protein from HepG-2 cells is 0.27009, which is obviously larger (0.1106) than that from normal cells (Fig. 4A). So, the designed DNA–AgNCs can detect HIF in total protein from HepG-2. In addition, the sensitivity of different DNA–AgNCs has been compared. As shown in Fig. 4B, the quenching constants for 10 μg mL−1 total protein from HepG-2 cells for DNA–AgNCs in this report (0.27009) is more than 10- or 15-fold greater when compared with multi-DNA–AgNCs in a previous report (0.02326).4 The sensitivity of DNA–AgNCs for HIF has been improved significantly. Similar to the binding mode between 5′-R
-3′ was identified as a HIF-1 specific binding site on the hypoxia response element (HRE) of many different metabolic related enzyme genes.21b,c The sensitivity of the synthesized DNA–AgNCs to HIF-1 was studied. The fluorescence emission of the DNA–AgNCs decreased with increasing concentration of total protein from HepG-2 (Fig. S5†). Although both the total protein from HepG-2 and normal cells could decrease the emission of the DNA–AgNCs, the fluorescence quenching constant of the total protein from HepG-2 cells is 0.27009, which is obviously larger (0.1106) than that from normal cells (Fig. 4A). So, the designed DNA–AgNCs can detect HIF in total protein from HepG-2. In addition, the sensitivity of different DNA–AgNCs has been compared. As shown in Fig. 4B, the quenching constants for 10 μg mL−1 total protein from HepG-2 cells for DNA–AgNCs in this report (0.27009) is more than 10- or 15-fold greater when compared with multi-DNA–AgNCs in a previous report (0.02326).4 The sensitivity of DNA–AgNCs for HIF has been improved significantly. Similar to the binding mode between 5′-R![[C with combining low line]](https://www.rsc.org/images/entities/char_0043_0332.gif)
![[G with combining low line]](https://www.rsc.org/images/entities/char_0047_0332.gif)
![[T with combining low line]](https://www.rsc.org/images/entities/char_0054_0332.gif)
![[G with combining low line]](https://www.rsc.org/images/entities/char_0047_0332.gif) -3′ and HIF, two G-residues in 5′-CTAC
-3′ and HIF, two G-residues in 5′-CTAC![[G with combining low line]](https://www.rsc.org/images/entities/char_0047_0332.gif)
![[T with combining low line]](https://www.rsc.org/images/entities/char_0054_0332.gif)
![[G with combining low line]](https://www.rsc.org/images/entities/char_0047_0332.gif) CT-3′ bind to the major groove of HIF21d and form a specific homoduplex structure. We deduce that the formation of the homoduplex DNA makes the G-residues extrude and facilitate its binding to HIF. This results in the fluorescent sensing being enhanced.
CT-3′ bind to the major groove of HIF21d and form a specific homoduplex structure. We deduce that the formation of the homoduplex DNA makes the G-residues extrude and facilitate its binding to HIF. This results in the fluorescent sensing being enhanced.
Conclusions
Near-infrared fluorescent DNA–AgNCs with parallel homoduplex conformation and an emission at 770–800 nm have been constructed using 5′-C3AC3AC3GC3A-CTACGTGCT-3′as a template. The para-electron donating group, intercalation of C2 to the homoduplex and the conjugated system increase the emission of C2 at 508 nm and decrease the emission of the DNA–AgNCs at 770 nm by facilitating energy transfer from the DNA–AgNCs to C2. The conjugated system is formed by the coordination of Ag from the DNA–AgNCs with the N atoms of the two pyridine groups from C2. The interaction of C1 with the major groove by the Genin dimers has a weak effect on emission at 770 nm of the DNA–AgNCs. So, the synthesized DNA–AgNCs can serve as a probe to discriminate C2 from C1 based on the different fluorescence quenching constants of the probe. Based on the different toxicity for C1 (IC50 > 100 μM) and C2 (IC50 11 μM) to HepG-2 cells (it has been reported,15 the result is shown in Fig. S6†), we deduce that the DNA–AgNCs may be used as a probe to explore the possible toxicity mechanism of anticancer BODIPY derivatives. Moreover, the sensitivity of this type of DNA–AgNCs for total protein from HepG-2 cells with high expression of HIF, has been improved significantly, laying a foundation for the use of DNA–AgNCs for sensing HIF. Overall, this type of DNA–AgNCs open a new application area for noble metal nanoclusters in sensing cancer cells or as a probe to explore the interaction of drugs with DNA.Experimental
Materials
DNA oligomer was purchased from Sangon Biotech. Its base sequence was 5′-C3AC3AC3GC3A-CTACGTGCT-3′. Silver nitrate (99%, A.C.S. reagent), citrate acid, sodium hydroxide, NaBH4 (power, 96%) were all obtained from Sinopharm Chemical Reagent Co. Ltd. 8-[Di(2-picolyl)amine-3-benzyl]-4,4-difluoro-1,3,5,7-tetramethyl-4-bora-3a,4a-diaza-s-indacene (C1), 8-[di(2-picolyl)amine-4-benzyl]-4,4-difluoro-1,3,5,7-tetramethyl-4-bora-3a,4a-diaza-s-indacene (C2) were synthesized as reported.15 The synthesis procedure of 8-(N-benzyl-8-hydroxylquinolinium)-4,4-difluoro-1,3,5,7-tetramethyl-4-bora-3a,4a-diaza-s-indacene choloride (C3) and 8-(N-benzyl-4-acetylpyridium)-4,4-difluoro-1,3,5,7-tetramethyl-4-bora-3a,4a-diaza-s-indacene chloride (C4) are shown in ESI.† 4,4′-Dimethyl-2′2-dipyridine (C5) was purchased from Sigma Aldrich Co. Ltd. The structure of C1, C2, C3, C4 and C5 are shown in Scheme S1.† Water was purified with a Millipore Milli-Q system (25 °C: 18.2 MΩ cm, 7.2 × 10⁻² N m−1).Synthesis of DNA–AgNCs
Silver clusters were synthesized by combining DNA (5′-C3AC3AC3GC3A-CTACGTGCT-3′) and Ag+ solutions in a 10 mM citrate buffer at pH = 5. The final concentration of AgNO3 and DNA is 200 μM and 13 μM, respectively. Then the DNA–Ag+ was heated to 71 °C, and maintained for 2 min, followed by slow cooling to room temperature. The whole cooling process is about 2 h. An aqueous solution of NaBH4 was added to give a final concentration of 2 BH4−/Ag+ at room temperature, and the resulting solution was vigorously shaken for 1 min and left standing for 3 days in the dark at 4 °C.Characterization
The electronic absorption spectrum was recorded using a UV-2450 UV-visible spectrophotometer at room temperature. Photoluminescent emission spectra were measured on a Varian Cary Eclipse spectrofluorometer. TEM was performed at room temperature on a JEOL JEM-200CX transmission electron microscope using an accelerating voltage of 200 kV. Circular dichroism (CD) spectra were measured on Jasco J-815 spectropolarimeter at room temperature. The resonance Raman spectra of the samples were obtained in the 100–1800 cm−1 range using a Jobin-Yvon Ramanor HG-2S double monochromator operating in the second order of gratings and exciting by 532 nm excitation line with the average laser power of 5 mW.Extraction of the total protein in the cells
First, 2 × 10⁶ cells, which are normal cells and HepG-2 cell, were collected and centrifuged at 1000 g and washed in PBS. Then the precipitation was lysed in 100 μL of precooling lysate buffer containing 0.5% Triton X-100, 100 mM Tris–HCl, 150 mM NaCl, 0.1 U mL−1 aprotinin for 30 min on ice and centrifuged at 12![[thin space (1/6-em)]](https://www.rsc.org/images/entities/char_2009.gif) 000 g for 2 min. The supernatant collected is the total protein.
000 g for 2 min. The supernatant collected is the total protein.
Analysis of compounds and HIF
1 μM DNA–AgNCs in a solution of citrate buffer (10 mM, pH 7.0) with varying quantities (as shown in figures) of (C1), (C2), (C3), (C4) and (C5), and total protein from normal cells (WRL-68) and HepG-2 were kept at room temperature for 10 min. Then the mixtures were subjected to fluorescence measurement.Acknowledgements
Financial support of National Science Foundation of China (21271090) and Coordination Chemistry State key Laboratory Foundation of Nanjing University.Notes and references
- G. Y. Lan, W. Y. Chen and H. T. Chang, Analyst, 2011, 136, 3623 RSC.
- K. Wang, J. Huang, X. H. Yang, X. X. He and J. B. Liu, Analyst, 2013, 138, 62 RSC.
- J. M. Obliosca, C. Liu and H. C. Yeh, Nanoscale, 2013, 5, 8443 RSC.
- T. T. Zhao, Q. Y. Chen, C. Zeng, Y. Q. Lan, J. G. Cai, J. Liu and J. Gao, J. Mater. Chem. B, 2013, 1, 4678 RSC.
- Z. W. Chen, Y. H. Lin, C. Q. Zhao, J. S. Ren and X. G. Qu, Chem. Commun., 2012, 48, 11428 RSC.
- Z. Z. Huang, F. Pu, Y. H. Lin, J. S. Ren and X. G. Qu, Chem. Commun., 2011, 47, 3487 RSC.
- X. X. Y. Wang, R. Y. Lin, Z. H. Xu, H. D. Huang, L. M. Li, F. Liu, N. Li and X. D. Yang, Anal. Chim. Acta, 2013, 793, 79 CrossRef CAS PubMed.
- T. Li, L. B. Zhang, J. Ai, S. J. Dong and E. K. Wang, ACS Nano, 2011, 5, 6334 CrossRef CAS PubMed.
- L. B. Zhang, J. B. Zhu, S. J. Guo, T. Li, J. Li and E. K. Wang, J. Am. Chem. Soc., 2013, 135, 2403 CrossRef CAS PubMed.
- L. P. Zhang, X. X. Zhang, B. Hu, L. M. Shen, X. W. Chen and J. H. Wang, Analyst, 2012, 137, 4974 RSC.
- J. J. Li, X. Q. Zhong, F. F. Cheng, J. R. Zhang, L. P. Jiang and J. J. Zhu, Anal. Chem., 2012, 84, 4140 CrossRef CAS PubMed.
- J. M. Obliosca, C. Liu and H. C. Yeh, Nanoscale, 2013, 5, 8443 RSC.
- R. Freeman, J. Girsh and I. Willner, ACS Appl. Mater. Interfaces, 2013, 5, 2815 CAS.
- A. P. de Silva, H. Q. N. Gunaratne, T. Gunnlaugsson, A. J. M. Huxley, C. P. McCoy, J. T. Rademacher and T. E. Rice, Chem. Rev., 1997, 97, 1515 CrossRef CAS PubMed.
- Z. Li, Q. Y. Chen, P. D. Wang and Y. Wu, RSC Adv., 2013, 3, 5524 RSC.
- (a) Q.-Y. Chen, H.-J. Fu, W.-H. Zhu, Y. Qi, Z.-P. Ma, K.-D. Zhao and J. Gao, Dalton Trans., 2011, 40, 4414 RSC; (b) Q.-Y. Chen, H.-J. Fu, J. Huang and R.-X. Zhang, Spectrochim. Acta, Part A, 2010, 75, 355 CrossRef PubMed.
- (a) B. Sengupta, C. M. Ritchie, J. G. Buckman, K. R. Johnsen, P. M. Goodwin and J. T. Petty, J. Phys. Chem. C, 2008, 112, 18776 CrossRef CAS; (b) S. H. Yau, N. Abeyasinghe, M. Orr, L. Upton, O. Varnavski, J. H. Werner, H.-C. Yeh, J. Sharma, A. P. Shreve, J. S. Martinez and T. Goodson, III, Nanoscale, 2012, 4, 4247 RSC.
- (a) J. Kypr and I. Kejnovska, Nucleic Acids Res., 2009, 37, 1713 CrossRef CAS PubMed; (b) I. Kejnovska, M. Tůmová and M. Vorlícková, Biochim. Biophys. Acta, 2001, 1527, 73 CrossRef CAS.
- J. I. Seeman, Chem. Rev., 1983, 83, 83 CrossRef CAS.
- (a) Z. J. Liu, Y. K. Si and X. G. Chen, Acta Pharmaceutica Sinica, 2010, 45, 1478 CAS; (b) W. A. Baase, Jr and W. C. Johnson, Nucleic Acids Res., 1979, 6, 797 CrossRef PubMed; (c) F. Fleury, A. Sukhanova, A. Ianoul, J. Devy, I. Kudelina, O. D. Alain, J. P. Alixi, J. C. Jardillier and I. Nabiev, J. Biol. Chem., 2000, 275, 3501 CrossRef CAS PubMed; (d) B. Norden and F. Tjerneld, Biopolymers, 1982, 21, 1713 CrossRef CAS PubMed; (e) N. C. Garbett, P. A. Ragazzon and J. B. Chaires, Nat. Protoc., 2007, 2, 3166 CrossRef CAS PubMed.
- (a) M. S. Wiesener, H. Turley, W. E. Allen, C. Willam, K.-U. Eckardt, K. L. Talks, S. M. Wood, K. C. Gatter, A. L. Harris, C. W. Pugh, P. J. Ratcliffe and P. H. Maxwell, Blood, 1998, 92, 2260 CAS; (b) G. L. Semenza, B. H. Jiang, S. W. Leung, R. Passantino, J.-P. Concordeti, P. Mairei and A. Giallongo, Biochem. Mol. Biol. Int., 1996, 32529 CAS; (c) M. S. Ullah, A. J. Davies and A. P. Halestrap, J. Biol. Chem., 2006, 281, 9030 CrossRef CAS PubMed; (d) J. A. Forsythe, B. H. Jiang, N. V. Iyer, F. Agani, S. W. Leung, R. D. Koos and G. L. Semenza, Mol. Cell. Biol., 1996, 16, 4604 CAS.
Footnote |
| † Electronic supplementary information (ESI) available: Structure of C1 to C5, Scheme S1; synthesis of C3, C4; TEM and Raman spectra, Fig. S1; fluorescence spectra, Fig. S2, S3 and S5; CD spectra of Fig. S4. See DOI: 10.1039/c3ra47151a |
| This journal is © The Royal Society of Chemistry 2014 |

