Depolymerization of polycarbonate with catalyst in hot compressed water in fused silica capillary and autoclave reactors†
Zhiyan
Pan
*a,
Zhichao
Hu
a,
Yinghai
Shi
a,
Yuan
Shen
a,
Junliang
Wang
a and
I-Ming
Chou
b
aDepartment of Environmental Engineering, Zhejiang University of Technology, Hangzhou 310032, P.R. China. E-mail: panzhiyan@zjut.edu.cn; Fax: +86-571-88320061; Tel: +86-571-88320061
bLaboratory for Experimental Study Under Deep-sea Extreme Conditions, Sanya Institute of Deep-sea Science and Engineering, Chinese Academy of Science, Sanya 572000, P.R. China
First published on 16th April 2014
Abstract
Depolymerization of polycarbonate (PC) with the catalyst manganese acetate (Mn(Ac)2) was studied in hot compressed water (HCW) using a stainless steel batch autoclave reactor and a fused silica capillary reactor (FSCR). The phase behavior of PC in water with or without Mn(Ac)2 during the heating, reaction and cooling processes was observed. The phase behavior indicated that the dissolution time of PC in HCW to form a homogeneous liquid solution was effectively reduced by adding Mn(Ac)2 as a catalyst. For the reaction in the autoclave reactor, the main liquid products were bisphenol A (BPA) and phenol. The effects of operating parameters such as catalyst concentration (ratio of Mn(Ac)2 to PC) (0–2.5%), temperature (250–280 °C) and reaction time (5–60 min) on depolymerization of PC were investigated in the autoclave reactor. The optimal experimental conditions were found to be a temperature of 280 °C, reaction time of 20 min with the ratio of Mn(Ac)2/PC of 2.0%, giving yields of BPA and phenol of 55.25% and 18.63%, respectively. The main gaseous product CO2 in the FSCR was qualitatively and quantitatively analyzed by Raman spectroscopy. A reaction pathway for catalytic depolymerization of PC in HCW was proposed based on the experimental results.
1. Introduction
Bisphenol A polycarbonate (PC) is one of the most widely used engineering thermoplastics. It is widely used in compact discs, automobile parts, computer parts, construction materials and other fields because of its high durability, excellent transparency, and good mechanical properties.1 With increasing polymer consumption, the effective utilization of waste has received a great deal of attention in recent years to help preserve resources and protect the environment. Material, thermal, and chemical recycling are the three main ways of recycling waste polymers. Among these methods, chemical recycling is considered to be the most promising for recycling waste polymers, and involves decomposing them into their monomers or other useful chemicals through chemical reactions. This approach is suitable for the conversion of waste PC into its corresponding monomers,2,3 which can then be reused as raw materials.Some organic solvents such as methanol,4–6 ethanol,2,7 toluene,8 and ethylene glycol9 have been reported as effective media for decomposing waste polymers. However, water is an attractive alternative to alcohols because it is non-toxic, abundant and eco-friendly. Hot compressed water (HCW, here water above 200 °C at sufficiently high pressure) shows extraordinary physical and chemical properties, and is an excellent medium with strong dissolving power for chemical reactions.10–12 We previously studied the hydrolysis of polyethylene terephthalate (PET) in HCW.13 Our results showed that PET could completely decompose to its monomers terephthalic acid and ethylene glycol in HCW. Tagaya et al.14 investigated the decomposition of PC in HCW from 230 to 430 °C; the yield of identified product reached 67% in the reaction performed at 300 °C for 24 h with the addition of Na2CO3 as a catalyst. Pan et al. used a fused silica capillary reactor (FSCR) to study hydrolysis of PC in HCW.15 The gaseous product CO2 was analyzed by in situ Raman spectroscopy, and phase behavior during the reaction was observed by a microscope and recorded continuously with a digital camera. Pan et al. also investigated the effects of plastic additives decabromodiphenyl ether and di-n-octyl phthalate on the depolymerization of PC in subcritical water at temperatures from 260 to 340 °C with a reaction time ranging from 15 to 60 min.16 Decomposition of PC was conducted in a tube bomb reactor by Watanabe et al.17 Their results showed the PC decomposed into BPA in 5 min around the saturated pressure of water at 300 °C, and the maximum yield of BPA was about 80%.
In HCW, chemical reactions can be catalyzed by metal acetates, which decrease the reaction temperature or shorten the reaction time. Kao and coworkers18 used cobalt acetate, cupric acetate, manganese acetate (Mn(Ac)2), sodium acetate and zinc acetate (Zn(Ac)2) to catalyze glycolysis of PET. Metal acetates have revealed great potential to accelerate reactions in our previous studies,19 but the Mn(Ac)2-catalyzed depolymerization of PC in HCW has not been examined. In the present work, we investigate the catalytic depolymerization of PC with Mn(Ac)2 in HCW in a stainless steel batch autoclave reactor and FSCR, and quantitatively analyze the gaseous product CO2 in the FSCR by Raman spectroscopy. Phase changes with or without catalyst are observed and recorded as a new method to study the catalytic depolymerization reaction of Mn(Ac)2 in HCW in a FSCR.
2. Experimental
2.1 Materials
PC with a mean molecular weight of 16![[thin space (1/6-em)]](https://www.rsc.org/images/entities/char_2009.gif) 000–17
000–17![[thin space (1/6-em)]](https://www.rsc.org/images/entities/char_2009.gif) 000 was purchased from Sigma-Aldrich (St. Louis, MO, USA), and was cleaned and dried in a drying oven at 60 °C before use. BPA (purity >99%), phenol (purity >99.9%) and Mn(Ac)2 (purity >99%) were supplied by Sinopharm Chemical Reagent Co., Ltd (Shanghai, China), Hangzhou Shuanglin Chemical Reagent Factory (Hangzhou, China) and Shanghai Meixing Chemical Co., Ltd (Shanghai, China), respectively. These materials were used as received. Two types of fused silica capillary tubes (665 μm O.D. and 300 μm I.D. with protective polyimide layer coating, or 4 mm O.D. and 2 mm I.D.) used in this study were purchased from Polymicro Technologies LLC (Phoenix, AZ, USA) and Technical Glass Products, Inc. (Painesville, OH, USA), respectively.
000 was purchased from Sigma-Aldrich (St. Louis, MO, USA), and was cleaned and dried in a drying oven at 60 °C before use. BPA (purity >99%), phenol (purity >99.9%) and Mn(Ac)2 (purity >99%) were supplied by Sinopharm Chemical Reagent Co., Ltd (Shanghai, China), Hangzhou Shuanglin Chemical Reagent Factory (Hangzhou, China) and Shanghai Meixing Chemical Co., Ltd (Shanghai, China), respectively. These materials were used as received. Two types of fused silica capillary tubes (665 μm O.D. and 300 μm I.D. with protective polyimide layer coating, or 4 mm O.D. and 2 mm I.D.) used in this study were purchased from Polymicro Technologies LLC (Phoenix, AZ, USA) and Technical Glass Products, Inc. (Painesville, OH, USA), respectively.
2.2 Apparatus and procedure
A small FSCR (665 μm O.D. and 300 μm I.D. and 2 cm long) was used to observe the phase behavior during PC hydrolysis in the presence and absence of Mn(Ac)2, and a large FSCR (4 mm O.D. and 2 mm I.D. and 5 cm long) was used for Raman spectroscopic analysis of the gaseous product CO2. To make a FSCR, a section with a length of 2 or 5 cm was cut from the appropriate silica capillary. The protective layer coating was burnt off (only small FSCR) and then one open end was sealed with an oxyhydrogen flame. PC and aqueous Mn(Ac)2 solution were loaded into the capillary and the open end of the tube was then sealed with an oxyhydrogen flame. The small FSCR was inserted into the sample chamber of a heating/cooling stage (INS0908051, INSTEC, Inc., Boulder, CO, USA), the temperature of which was managed via a digital temperature controller (accuracy ±0.1 °C, STC200, Instec., USA). The heating and cooling rate was 10 °C min−1. The phase behavior of the PC during the reaction in HCW with or without catalyst Mn(Ac)2 was observed with a polarization microscope (DM2500P, Leica Microsystems GmbH, Wetzlar, Germany). Information was continuously recorded into a computer by a digital camera (JVC, TK-C1481, Yokohama, Japan). The large FSCR was heated in a preheated hot-air oven, which was at the desired reaction temperature. After a set reaction time, the large FSCR was removed, rapidly quenched in a water bath to halt reactions, and then the gaseous product was directly analyzed using Raman spectroscopy. The experimental apparatus and other details have been described previously.20,21The catalytic depolymerization of PC in HCW was carried out in a 50 mL stainless steel batch autoclave reactor. In a typical experimental, reactants in the specified ratio (3 g of PC to 24 mL of water and a certain amount of Mn(Ac)2) were loaded into the autoclave, and then sealed. The autoclave was heated in a electric heating collar, and the temperature and pressure were measured by a K-type thermocouple and pressure gauge, respectively. When the set reaction time was reached, the autoclave was removed and immediately quenched in a water bath to reach ambient temperature. The autoclave was opened and washed with ethanol to recover products. The solid residue was separated from the solution by vacuum filtration. The liquid products were identified using a gas chromatograph (GC) (Agilent 6890, Agilent Technologies, Santa Clara, CA, USA) equipped with a 30 m × 0.25 mm × 0.25 μm HP-5 capillary column coupled to a mass spectrometer (MS). The liquid compounds were quantified using a GC (Agilent 6890) with a 30 m × 0.32 mm × 0.25 μm Agilent 19091J-413 capillary column. The temperature program involved an isothermal soak for 3 min at 150 °C, followed by heating at a rate of 20 °C min−1 up to 280 °C, and then holding at this temperature for 5 min. The solid residue was qualitatively analyzed using a Fourier-transform infrared (FT-IR) spectrometer (AVATAR-370, Thermo Nicolet, Waltham, MA, USA). A Raman spectrometer (HR 800 Lab RAM, Horiba Jobin Yvon, Villeneuve d'Ascq, France) equipped with a 531.95 nm laser (frequency-doubled Nd:YAG, 20 mW) and CCD detector (multichannel, air cooled) was used to analyze the gaseous product CO2 and solid residue.
The residual PC on the filter was dried at 60 °C for 5 hours and then weighed. The depolymerization yield of PC was evaluated according to weight using the equation:
The yield of BPA is defined as:
The yield of phenol is defined as:
3. Results and discussion
3.1 Phase behavior of PC in HCW in FSCR
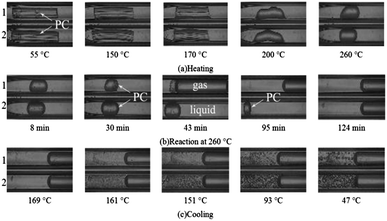
Fig. 1 shows the phase behavior of PC in water with and without Mn(Ac)2 catalyst during the heating, reaction and cooling processes. The phase behavior was observed by a microscope and recorded with a digital camera. Images taken of FSCR1 (PC with catalyst) and FSCR2 (PC without catalyst) showed that PC swelled and softened at 150 °C and generally shrank into liquid spherules at 200 °C; it remained in solid form coexisting with aqueous solution and vapor phase below 200 °C (Fig. 1(a)). Fig. 1(b) shows the phase behavior during heating at 260 °C. As the reaction time prolonged, the liquid PC spherule gradually became smaller and totally dissolved in HCW after a reaction time of 45 min in FSCR1, while two phases (aqueous solution and vapor phase) coexisted in FSCR1. The liquid PC spherule in FSCR2 without catalyst did not noticeably reduce in volume at the same reaction time as in FSCR1.It can be inferred that depolymerization hardly occurred without the catalyst at a constant temperature of 260 °C after a reaction time of 45 min. The liquid spherule totally dissolved in FSCR2 after 124 min of reaction. During the cooling process, as shown in Fig. 1(c), phase separation and a suspension of oily BPA spheres was observed at 161 °C. The amount of spheres increased substantially and they gradually became bigger as the temperature decreased. Ultimately, the amount of oily BPA spheres formed in FSCR1 at 47 °C was less than that in FSCR2. The depolymerization reaction in FSCR1 proceeded for a longer time than that in FSCR2 after complete dissolution of PC, so more unstable BPA was converted into phenol in FSCR1. Overall, the phase behavior in FSCR1 showed that the PC in the solution with catalyst started to swell and soften at 150 °C, melt at 200 °C, dissolve completely at 260 °C with a reaction time of 45 min, and finally form a homogeneous aqueous solution. In contrast, PC without catalyst dissolved completely at 260 °C with a reaction time of 124 min. The above results show that the Mn(Ac)2 catalyst plays an important role in shortening the time it takes PC to dissolve completely in HCW to form a homogeneous aqueous solution. Catalytic depolymerization of PC in a batch-type autoclave reactor was conducted on the basis of the results obtained in the FSCRs.
3.2 Analysis of the depolymerization products
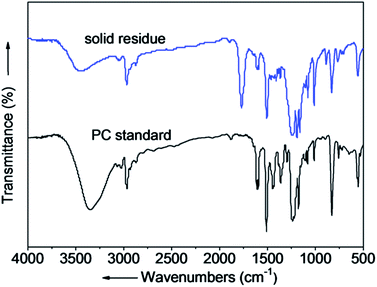
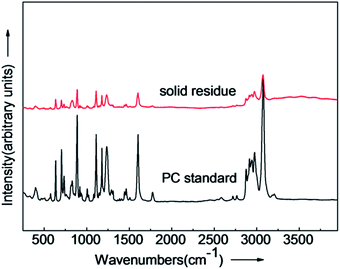
The structure of the solid residue after depolymerization (280 °C, 15 min) was confirmed by FT-IR and Raman spectra. The FT-IR and Raman spectra of the solid residue and PC standard are shown in Fig. 2 and Fig. 3. The accordance of absorption peaks of the solid residue at 3000–2843 cm−1 (C–H stretching), 1608 cm−1 (C![[double bond, length as m-dash]](https://www.rsc.org/images/entities/char_e001.gif) O symmetrical stretching), 1248 cm−1 (C–O–C), 830 cm−1 (C–H bending vibration), respectively. The results of FT-IR indicate the solid residue product is mainly PC. Additionally, the chemical structure was analyzed by Raman spectra, and the agreement in characteristic peaks in Raman spectra of the solid residue after reaction and PC standard revealed that the solid residue is actually residual PC. The liquid products identified by GC-MS, were mainly composed of phenol, p-tert-butyl phenol and p-isopropenylphenol and BPA. The main composition of liquid products after PC depolymerization are shown in Table 1.
O symmetrical stretching), 1248 cm−1 (C–O–C), 830 cm−1 (C–H bending vibration), respectively. The results of FT-IR indicate the solid residue product is mainly PC. Additionally, the chemical structure was analyzed by Raman spectra, and the agreement in characteristic peaks in Raman spectra of the solid residue after reaction and PC standard revealed that the solid residue is actually residual PC. The liquid products identified by GC-MS, were mainly composed of phenol, p-tert-butyl phenol and p-isopropenylphenol and BPA. The main composition of liquid products after PC depolymerization are shown in Table 1.
| Reaction time (min) | CAS | Chemical name |
|---|---|---|
| 5.79 | 108-95-2 | Phenol |
| 7.73 | 98-54-4 | p-tert-Butyl phenol |
| 7.76 | 4286-23-1 | p-Isopropenylphenol |
| 11.24 | 80-5-7 | BPA |
3.3 Effect of reaction time on CO2 yield in FSCR
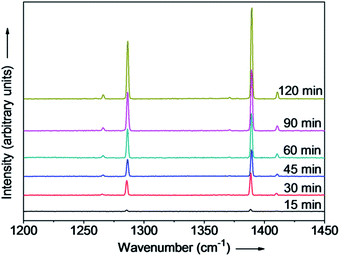
In HCW, the only gaseous product of depolymerization of PC is CO2.15 The relationship between the density of CO2 and its Raman peak area in a calibrated Raman spectrum is linear.22 Therefore, the catalytic depolymerization of PC could be estimated by monitoring the CO2 peak area in the vapor phase by Raman spectroscopy in the FSCR. To investigate the effect of reaction time on catalytic depolymerization of PC, experiments were performed at temperatures ranging from 250 to 280 °C, with a reaction time of 15 to 120 min. The results of these experiments are presented in Fig. 4. Each dot represents an average of no less than three independent experiments. The volume of CO2 increased as the reaction time prolonged, and it leveled off at 280, 270, 260 and 250 °C after reaction times of 30, 75, 105 and 120 min, respectively, indicating complete conversion of PC into smaller molecules. Fig. 5 shows Raman spectra of CO2 in the vapor phase that were collected at reaction times from 15 to 120 min at 260 °C in the FSCR. The Raman spectrum of CO2 contains an upper, lower and two hot bands. A drawback of the reaction in the FSCR is that it is difficult to recover liquid- and solid-phase products because of its small size, so a stainless steel batch autoclave reactor was used for quantitative analysis of liquid- and solid-phase products.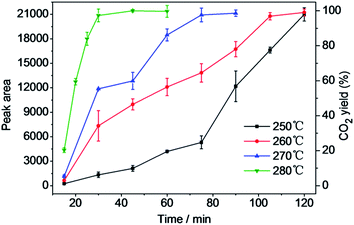 | ||
| Fig. 4 Effect of reaction time on peak area of CO2 and CO2 yield on depolymerization of PC in HCW at different temperatures. | ||
3.4 Effect of Mn(Ac)2/PC ratio on the catalytic depolymerization of PC in an autoclave
Mn(Ac)2 and PC with a ratio (w/w) between 0–2.5% were added to an autoclave with a fixed water/PC ratio of 8![[thin space (1/6-em)]](https://www.rsc.org/images/entities/char_2009.gif) :
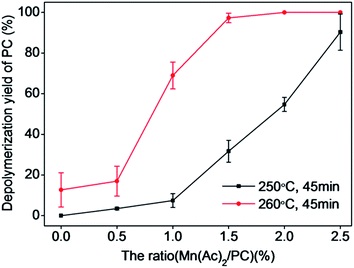
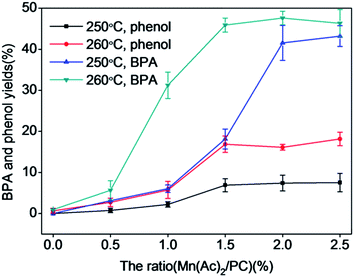
:![[thin space (1/6-em)]](https://www.rsc.org/images/entities/char_2009.gif) 1 (w/w) to study the effect of Mn(Ac)2 concentration on the depolymerization of PC. The experiments were carried out at temperatures of 250 and 260 °C with a reaction time of 45 min. The detailed results of these experiments are depicted in Fig. 6 and 7.
1 (w/w) to study the effect of Mn(Ac)2 concentration on the depolymerization of PC. The experiments were carried out at temperatures of 250 and 260 °C with a reaction time of 45 min. The detailed results of these experiments are depicted in Fig. 6 and 7.
Fig. 6 shows that the depolymerization yield of PC increased with increasing ratio of Mn(Ac)2/PC at temperatures of 250 and 260 °C. The catalytic effect was obvious at 250 °C, and the depolymerization yield of PC increased quickly from 3.82% to 100% with increasing Mn(Ac)2/PC ratio from 1.0% to 2.5%, which indicated that addition of Mn(Ac)2 can promote the depolymerization of PC and substantially accelerate the reaction rate. At 260 °C, the depolymerization yield of PC quickly reached 100% with a Mn(Ac)2/PC ratio of 1.5%. However, the catalytic effect became weaker when the Mn(Ac)2/PC ratio increased above 2.0%. Both the depolymerization yield of PC and the catalytic effect were reduced when the ratio of Mn(Ac)2/PC increased above 1.5%.
Fig. 7 reveals the relationship between the ratio of Mn(Ac)2/PC and the yields of BPA and phenol. Yields of BPA and phenol both increased with increasing Mn(Ac)2/PC ratio. The yield of phenol increased slowly, while that of BPA increased quickly and reached the highest yields of 43.7% and 49.3% under the conditions of 250 °C with a Mn(Ac)2/PC ratio of 2.5% and 260 °C with a Mn(Ac)2/PC ratio of 2.0%, respectively. When the Mn(Ac)2/PC ratio was above 2.0%, the yields of BPA and phenol increased slowly, and the catalytic effect of Mn(Ac)2 became weaker. The BPA yield also decreased with increasing ratio of Mn(Ac)2/PC at 260 °C as a result of the acceleration of BPA decomposition by the addition of Mn(Ac)2. Considering the depolymerization yield of PC, the yields of products, and the consumption of Mn(Ac)2, a Mn(Ac)2/PC ratio of 2.0% was chosen for further study.
3.5 Effect of reaction time and temperature on catalytic depolymerization of PC in an autoclave
The catalytic depolymerization of PC in HCW was studied by varying the reaction time in the range of 15–60 min in the temperature range from 250 to 280 °C with a water/PC ratio of 8![[thin space (1/6-em)]](https://www.rsc.org/images/entities/char_2009.gif) :
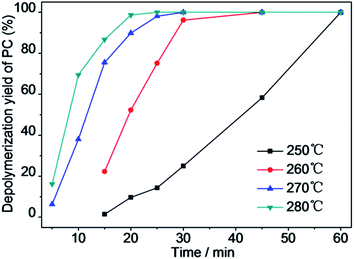
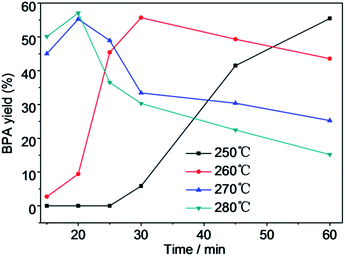
:![[thin space (1/6-em)]](https://www.rsc.org/images/entities/char_2009.gif) 1 (w/w), and Mn(Ac)2/PC ratio of 2.0% to study the influence of reaction time and temperature on this reaction. The results of these experiments are depicted in Fig. 8–10.
1 (w/w), and Mn(Ac)2/PC ratio of 2.0% to study the influence of reaction time and temperature on this reaction. The results of these experiments are depicted in Fig. 8–10.
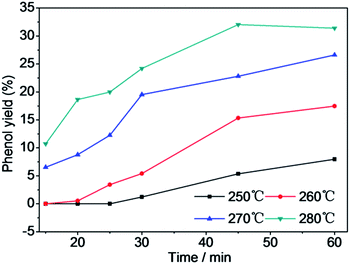
Fig. 8 shows that the depolymerization yield of PC increased with increasing reaction temperature and time. PC was barely depolymerized in water after 15 min at 250 °C. Upon increasing the temperature to 260 °C, the depolymerization yield of PC increased to 22.3% after 15 min. When the temperature was elevated to 270 °C and then to 280 °C, the depolymerization yield of PC increased dramatically to 100% after a reaction time of 30 min. The depolymerization yield of PC rapidly raised from 0% to 100% with increasing reaction time from 15 to 60 min at 250 °C. The depolymerization yield of PC was only 3.33% at 260 °C after a reaction time of 30 min in the absence of Mn(Ac)216 but reached 96.2% in the presence of Mn(Ac)2, so Mn(Ac)2 facilitated PC hydrolysis. The use of Mn(AC)2 catalyst greatly reduced the reaction time and temperature for PC completely depolymerization. For a reaction time range of 15–60 min, the BPA yield increased noticeably over time at low temperature (Fig. 9). The yields of BPA increased first and then decreased after achieving the highest yield after a reaction time of 30 min at a temperature of 260 °C, and after 20 min at 270 and 280 °C. Initially, the BPA yield increased as the depolymerization yield of PC increased. The decrease in the yield of BPA after reaching a maximum was attributed to the instability of BPA at high temperature. The stability of BPA was affected by the reaction temperature and time; it decomposed to phenol and other products after prolonged reaction times and at high temperature. Fig. 10 shows the yield of phenol with depolymerization time at four different temperatures. The yield of phenol was less than 10% at 250 °C, and increased to 32% at 280 °C after a reaction time of 45 min. Kim et al. considered that too high temperature decreased the main product yield, promoted side reactions and increased the yield of side products.5 The trend of BPA yield shown in Fig. 9 confirmed that BPA could be converted into phenol, phenolic compounds and other byproducts through the fracture of chemical bonds under the experimental conditions.23,24
Comparing experimental results for the depolymerization yield of PC in the autoclave and the CO2 yield in the FSCR, the reaction rate obtained in the stainless steel autoclave appeared to be higher than that in the FSCR. That is, maximum CO2 yield was reached after 120 min at 250 °C in the FSCR, but PC depolymerized completely within 60 min at the same temperature in the autoclave. This faster rate is attributed to the metal surface of the autoclave reactor we used.25
3.6 Reaction kinetics
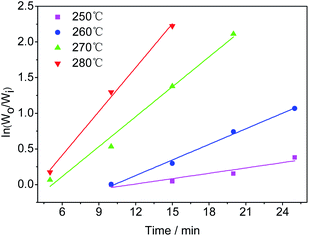
According to the experimental results of the decomposition of PC, the kinetic model rate equation of PC is expressed as follows: | (1) |
 | (2) |
Assuming that the initial concentration of PC is [PC]0, and the concentration of PC that has not degraded in time t is [PC]i, eqn (2) can be converted to eqn (3):
 | (3) |
The concentration is a measure of the quantity of the PC, so eqn (3) can be expressed in the form:
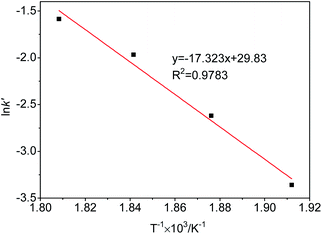
 | (4) |
 | (5) |
4. Reaction pathway of catalytic depolymerization of PC in HCW
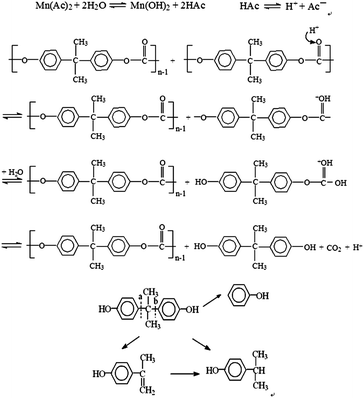
The phase behavior of PC in FSCR suggested that PC started to melt at about 150 °C, dissolved completely at 260 °C within a time of 45 min in the presence of Mn(Ac)2, and eventually formed an aqueous solution coexisting with a vapor phase. Combined with the analysis of the depolymerization products obtained in the autoclave, a depolymerization mechanism was proposed as illustrated in Scheme 1. The presence of CO2 in the vapor phase detected by Raman spectroscopy demonstrated that chain scission occurred at the ester bond of PC. As an acidic catalyst, Mn(Ac)2 dissociates in water and forms an acidic aqueous solution. Numerous hydrogen ions were thus produced and reacted with the –O– of the ester linkage in the repeat units of PC to form a protonated ester group, then polymer was hydrolyzed by water, just as other esters are. The intermolecular forces between PC chains weakened and distances enlarged with increased temperature, allowing the water molecules move faster and diffuse into the PC continuously.This further weakened the intermolecular forces in PC and leads to random chain scission reactions. High molecular polymer gradually broken, the polymer chains started to break up into shorter chains, which led to the amounts of oligomer increased. Initially, PC was broken down into oligomer and oligomer was partly converted into monomers, which accelerated the depolymerization process. As a result, PC was depolymerized to its monomers BPA and byproduct phenol in HCW. The depolymerization product BPA was partly converted to phenol, p-tert-butyl phenol, p-isopropenylphenol because of its instability in HCW with increasing reaction time and temperature. Our experimental results show that the presence of Mn(Ac)2 catalyst could accelerate the depolymerization reaction of PC.
5. Conclusions
Catalytic depolymerization of PC by Mn(Ac)2 in HCW was performed in a FSCR and a batch autoclave reactor, respectively. The phase behavior of PC in water with and without Mn(Ac)2 in the FSCRs were compared simultaneously during heating, reaction and cooling processes which were observed and recorded using a microscope and video recorder system.We used two different reactors to study the depolymerization of PC in the research, and the results indicated that (1) addition of Mn(Ac)2 decreased the time the PC took to dissolve in HCW and form a homogeneous aqueous solution, (2) CO2 was the gas product and its density increased as the reaction time extended from 8 to 45 min at 260 °C, (3) in the process of depolymerization of PC in HCW, BPA was one of the products and could be converted into phenol and other products at high temperatures, (4) the acceleration function of Mn(Ac)2 can mitigate the reaction conditions for recycling useful monomers from waste PC, (5) FSCR-based method is visually-accessible, low in energy and materials consumptions, and can be analyzed without sampling from the reactor by in situ Raman.
Acknowledgements
Financial support for this research was provided by the Natural Science Foundation of China (No. 21377116).Notes and references
- H. R. Hakimelahi, L. Hu, B. B. Rupp and M. R. Coleman, Polymer, 2010, 51, 2494 CrossRef CAS PubMed.
- H. Jie, H. Ke, Z. Qing, C. Lei, Y. Q. Wu and Z. B. Zhu, Polym. Degrad. Stab., 2006, 91, 2307 CrossRef CAS PubMed.
- M. Goto, J. Supercrit. Fluids, 2009, 47, 500 CrossRef CAS PubMed.
- J. Ozaki, S. K. I. Djaja and A. Oya, Ind. Eng. Chem. Res., 2000, 39, 245 CrossRef CAS.
- D. Kim, B. K. Kim, Y. Cho, M. Han and B. S. Kim, Ind. Eng. Chem. Res., 2009, 48, 6591 CrossRef CAS.
- F. S. Liu, Z. Li, S. T. Yu, X. Cui and X. P. Ge, J. Hazard. Mater., 2010, 174, 872 CrossRef CAS PubMed.
- R. E. N. de Castro, G. J. Vidotti, A. F. Rubira and E. C. Muniz, J. Appl. Polym. Sci., 2006, 101, 2009 CrossRef CAS.
- P. Joshi and G. Madras, Polym. Degrad. Stab., 2008, 93, 1901 CrossRef CAS PubMed.
- D. Kim, B. K. Kim, Y. M. Cho, M. Han and B. S. Kim, Ind. Eng. Chem. Res., 2009, 48, 685 CrossRef CAS.
- C. M. Comisar, S. E. Hunter, A. Walton and P. E. Savage, Ind. Eng. Chem. Res., 2008, 47, 577 CrossRef CAS.
- T. Adschiri, O. Sato, K. Machida, N. Saito and K. Arai, Kagaku Kogaku Ronbunshu, 1997, 23, 505 CrossRef CAS.
- P. E. Savage, J. Supercrit. Fluids, 2009, 47, 407 CrossRef CAS PubMed.
- H. Weingartner and E. U. Franck, Angew. Chem., Int. Ed., 2005, 44, 2672 CrossRef PubMed.
- H. Tagaya, K. Katoh, J. Kadokawa and K. Chiba, Polym. Degrad. Stab., 1999, 64, 289 CrossRef CAS.
- Z. Y. Pan, I. M. Chou and R. C. Burruss, Green Chem., 2009, 11, 1105 RSC.
- Y. Y. Huang, S. X. Liu and Z. Y. Pan, Polym. Degrad. Stab., 2011, 96, 1405 CrossRef CAS PubMed.
- N. M. Watanabe, Y. Matsuo, T. Matsushita, H. Inomata, T. Miyake and K. Hironaka, Polym. Degrad. Stab., 2009, 94, 2157 CrossRef PubMed.
- C. Y. Kao, W. H. Cheng and B. Z. Wan, Thermochim. Acta, 1997, 292, 95 CrossRef CAS.
- Y. P. Liu, M. X. Wang and Z. Y. Pan, J. Supercrit. Fluids, 2012, 62, 226 CrossRef CAS PubMed.
- H. C. Liu and Z. Y. Pan, Environ. Sci. Technol., 2012, 46, 3384 CrossRef CAS PubMed.
- X. L. Wang, W. X. Hu and I. M. Chou, J. Geochem. Explor., 2013, 132, 111 CrossRef CAS PubMed.
- J. C. Seitz, J. D. Pasteris and I. M. Chou, Am. J. Sci., 1996, 296, 577 CrossRef CAS.
- S. E. Hunter and P. E. Savage, Chem. Eng. Sci., 2004, 59, 4903 CrossRef CAS PubMed.
- S. E. Hunter and P. E. Savage, J. Org. Chem., 2004, 69, 4724 CrossRef CAS PubMed.
- G. J. DiLeo and P. E. Savage, J. Supercrit. Fluids, 2006, 39, 228 CrossRef CAS PubMed.
Footnote |
| † Electronic supplementary information (ESI) available: Experimental section and Fig. S1–S12. See DOI: 10.1039/c4ra00680a |
| This journal is © The Royal Society of Chemistry 2014 |


