The effect of boundary slip on elastohydrodynamic lubrication
Aleks
Ponjavic
and
Janet S. S.
Wong
*
Department of Mechanical Engineering, Imperial College London, UK SW7 2AZ. E-mail: j.wong@imperial.ac.uk; Fax: +44 (0)20 7494 7023; Tel: +44 (0)20 7594 8991
First published on 23rd April 2014
Abstract
The effect of interfacial slip on the friction and film thickness in an elastohydrodynamic (EHD) contact was directly evaluated. Experiments showed that the film thickness and friction decrease upon the application of an oleophobic coating given a sufficient pressure, as opposed to bare glass. Direct measurements of the slip velocity enabled the determination of a power law relationship between pressure and slip length. This implied the existence of spatial heterogeneity of the flow in the tribological contact due to the pressure distribution, which was confirmed by experiments. The power law relationship could also be used to predict the film thickness and friction based on conservation of mass and by using a rheological model for the lubricant. The film thickness and friction predictions were compared to experimental results. The former matched experimental observations. The latter however, underestimated the reduction in friction due to slip by a factor of two, suggesting the necessity of further work to elucidate the interplay between lubricant flow, rheology and friction.
Introduction
The breakdown of the classical no-slip boundary condition in fluid mechanics has been studied using a plethora of techniques over the past decades.1 The mechanisms of slip are often explored by measuring the hydrodynamic force generated as two surfaces approach each other, either by surface forces apparatus2 or by colloidal probe microscopy.3 It is also possible to directly study the flow of liquids close to a solid surface using total internal reflection combined with fluorescence recovery after photobleaching4 or double-focus fluorescence cross-correlation.5 Results from such experiments have shown that the degree of interfacial slip of a polymer is related to the shear stress at the fluid–solid interface.6,7 These experiments are of great interest from a fundamental perspective but not amenable to immediate tribology application due to large discrepancy between servicing and experimental conditions such as geometry, shear rate and pressure. To extend our understanding of the implication of interfacial slip to tribology application, an intermediate system can be used. An example of such a system is an elastohydrodynamic (EHD) contact which is relevant to an abundance of applied tribological systems.Rubbing surfaces can be lubricated to reduce the generation of friction. If the servicing conditions are such that a lubricant film is generated which separates the rubbing surfaces, the friction is caused solely by shearing of the lubricant.8Fig. 1a depicts an EHD contact under pure sliding conditions, where lubricant is entrained between a rotating glass sphere and a glass slide that are loaded against each other. The thin lubricant film (order of submicron) is subjected to high normal stress and hence its viscosity increases. As a result, the sphere is elastically deformed, creating a circular contact zone of mostly constant film thickness. The through-thickness velocity profile, u(z), of the lubricant can be found by solving the Reynold's equation. In the case of pure sliding, u(z) is mostly linear as shown by black arrows and the black solid line in Fig. 1a. If the rheology of the lubricant is known, the friction generated by such a contact can be calculated by assuming average values of shear rate, shear stress and temperature.8,9
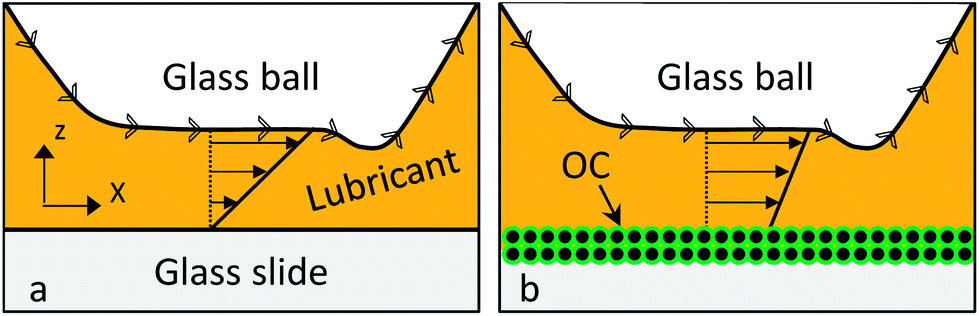 | ||
| Fig. 1 (a) Schematic of a pure sliding EHD contact with a classical Couette velocity profile (black solid line). (b) Altered profile caused by the application of an oleophobic coating (OC). | ||
The shear stresses in an EHD contact are generally large, of the order of MPa. If the interfacial energy between the lubricant and the surfaces is low, slip at the interface may occur. Interfacial slip will alter the velocity profile (as shown in Fig. 1b), which will in turn affect friction. As friction is determined by the shear stress at the wall, the possibility of interfacial slip in EHD conditions provides a unique opportunity to manage friction by manipulating lubricant–wall interactions. It has been shown that coatings that repel fluids can be used to generate large amounts of slip.10,11 Such coatings could potentially be used in tribological contacts.
The understanding of slip in EHD lubrication is limited as applied oleophobic coatings can easily be damaged due to the large shear stresses in the contact. Nevertheless, studies have been performed which indicate the existence of slip and its effect on friction. Measurements have been conducted in hydrodynamic lubrication with a water–glycerol mixture showing a drop in the friction of up to 30% when one of the surfaces is coated with a hydrocarbon monolayer.12 The slip length was determined to be 20 μm based on a modified Reynold's equation. Since lubricant is piezoviscous in an EHD contact, the analysis in ref. 12 is not applicable to EHD lubrication. Diamond-like carbon (DLC) coatings have also been shown to reduce friction by 10–30% over all lubrication regimes.13 While slip was postulated to be the cause, no information on slip length was given. Friction and film thickness measurements have been conducted with the oligomer polybutene (PB). Both were shown to be sensitive to the properties of the substrate, suggesting the existence of interfacial slip.14 A direct measurement of slip was performed independently by creating a dimple in PB in an EHD contact.15 The subsequent motion of the dimple could be related to the lubricant flow and was monitored using interferometric measurements. The results suggested that the lubricant slips at the interface. This slip could be related to the shear rate and applied pressure. Due to the use of a dimple, no spatial variation in the slip length could be discerned, and the range of shear rates was limited.
The potential use of interfacial slip to reduce friction in tribology is promising.16 To master this potential, it is necessary to directly correlate interfacial slip with friction and lubricant film thickness, with the latter being crucial to the protection of rubbing surfaces. This requires direct measurements of slip in steady conditions. This can be achieved using photobleached-fluorescence imaging velocimetry.17 This technique has been used previously by the authors to study the flow of PB in steel–glass18 and glass–glass EHD point contacts.19 The through-thickness velocity profile, u(z), have been obtained successfully. The results show that the shape of u(z) can be non-linear and depends on experimental conditions. However the evidence of slip is inconclusive. In this paper, photobleached-fluorescence imaging velocimetry is used to obtain u(z) of PB on bare glass and on glass with an oleophobic coating. The latter promotes interfacial slip. These results are combined with film thickness and friction measurements to explore the relationship between the three parameters. By comparing results obtained from bare and coated glass, the effect of interfacial slip on the tribological response of an EHD contact is investigated systematically.
Experimental
Materials
The EHD contact being studied consists of a 19 mm borosilicate glass sphere (PCS Instruments, roughness = 10 nm) which is loaded onto a glass slide (VWR, roughness = 0.5 nm). The glass sphere rotates at a fixed velocity in a lubricant bath such that the two solid surfaces are separated by the entrained lubricant. The lubricant (PB) is doped with a fluorescent dye, Nile Red, enabling the use of laser-induced fluorescence. To promote slip at the stationary lubricant–solid interface, the glass slide can be coated with an oleophobic coating called Fusso. All measurements were performed at room temperature (25 ± 1 °C).The lubricant is PB1300 (H-300, Ineos Oligomers). It is a highly viscous oligomer and has a number average molecular weight of 1300 g mol−1. Its viscosity is 66 Pa s at 25 °C, measured by a Discovery Hybrid Rheometer (TA Instruments) and its pressure–viscosity coefficient is 30 GPa−1.18 Its hydrodynamic radius is about 0.85 nm, approximated by comparison with X-ray scattering data for polyisobutylene.20 PB1300 was selected for its relatively high viscosity, which allows the formation of an EHD film at low velocities. Due to the low velocities employed, the heating induced by friction, and hence the thermal effect on viscosity, are negligible.18
The fluorescent dye, Nile Red (Sigma-Aldrich UK), is chosen because it is photo-physically unstable in PB, thus can be photobleached efficiently. It is hydrophobic and hence soluble in the PB. This limits the adsorption of Nile Red on surfaces, which in the case of glass was found to be negligible. Solutions of 1 mM Nile Red in PB were prepared using a magnetic stirrer at a temperature of 150 °C. The elevated temperature reduces the viscosity of the PB and promotes mixing. Nile Red has a hydrodynamic radius of approximately 0.5 nm,21 making it suitable for tracing the flow of the larger PB.
An oleophobic coating was used to promote slip at the lubricant–solid interface. DLC13 and hydrocarbon monolayer12 coatings have been used by others to facilitate slip in tribological contacts. These coatings are however not applicable to this work. DLC coatings are typically reflective which severely complicates the analysis when photobleached-fluorescence imaging is applied. Hydrocarbon monolayer coatings on the other hand, while non-reflective, are not sufficiently robust to sustain the harsh conditions of an EHD contact. In this study, a commercially available oleophobic smartphone coating ‘Fusso’ (API Corporation) is used. The product description reveals that the coating consists of a network of fluorocarbon chains which adheres to the silica surface, although the exact chemistry is undisclosed. Glass slides were coated for velocimetry and film thickness measurements, while glass spheres were coated for friction measurements. The coating was applied as per the provided instructions. Surfaces were plasma cleaned. A few drops of Fusso were then deposited on the surface, spread using a cloth, and allowed to evaporate. This was repeated three times. The coating was then allowed to set overnight. The resulting coating on the glass slides has an approximate thickness of 10 nm and a roughness of 1 nm. The contact angle of PB1300 on bare glass was measured optically to be 16°, while the contact angle on the Fusso coated glass was 69°. Solution of the Young–Dupré equation yields the work of adhesion 0.049 and 0.034 J m−2 for the glass and Fusso surfaces respectively. Thus PB adheres more strongly to bare glass than to Fusso coated glass and the lower work of adhesion for the Fusso surface is likely to promote slip.22 While the structure of the coating rendered it more robust than hydrocarbon monolayer coatings used in other studies, wear still occurred and the coating degraded over time. Repeated friction and photobleached-fluorescence imaging measurements showed that no significant changes in tribological properties could be observed within the first five minutes of testing, after which the oleophobicity of the coating drops. Thus every measurement performed on Fusso coated substrates was conducted using fresh coating. The duration of each experiment was less than 5 minutes to ensure that coating damage did not affect the results presented in this study.
In this work, the glass–glass contact and the glass–Fusso contact refers to EHD contacts between bare glass and bare glass; and bare glass and Fusso-coated glass respectively. Previous work has shown that PB in a glass–glass contact obeys the no-slip boundary condition.19
LIF film thickness measurements
In this work, the surfaces creating the EHD contact are transparent to comply with the requirements for photobleached-fluorescence imaging. Therefore laser-induced fluorescence (LIF) is chosen for measuring film thickness.A contemporary description of using LIF in tribological contacts can be found in literature.23 In short, when a lubricant is doped with a fluorescent dye and excited by an excitation source, it emits light. The amount of observed fluorescence emission is linearly proportional to the distance over which the excitation light interacts with the dye, which in this case corresponds to the lubricant film thickness. The optical setup and acquisition system used for LIF in this work are detailed in ref. 18, with the only differences being the replacement of all excitation sources by a blue LED and the use of a 5× objective.
Wide-field correction was performed to account for the inhomogeneity of the excitation beam. A calibration curve was generated by acquiring a fluorescence image of the Nile Red doped PB in a stationary point contact in order to obtain the correct lubricant film thickness. The corrected calibration image taken at a pressure of 260 MPa is shown in Fig. 2a. The separation between the sphere and the slide can be calculated based on the load and the material properties of glass using Hertzian theory.24 Thus at any pixel in the image, the intensity and the film thickness are known. Hence, the film thickness can be plotted against the intensity, as shown in Fig. 2b, generating a calibration curve. The fluorescence intensity is non-zero in the contact due to minor fluorescence from the glass and reflections of the excitation light. Note that the lubricant film thickness can be accurately measured at a resolution of approximately 20 nm when the film thickness is above 100 nm.
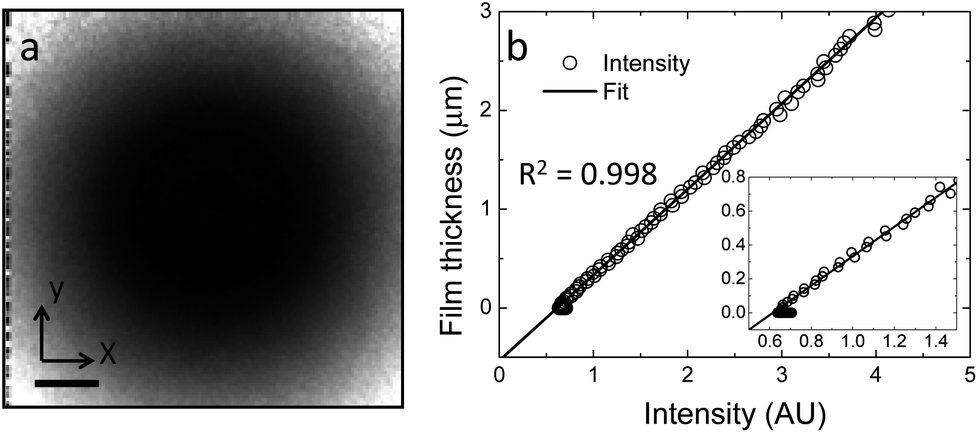 | ||
| Fig. 2 (a) Wide-field corrected calibration image. The grayscale from black to white represents intensity. The scale bar is 100 μm. (b) Calibration curve relating intensity and film thickness. The inset shows the good correlation even at smaller thicknesses. | ||
Friction measurements
The friction in EHD contacts are commonly measured using mini traction machines. These are typically designed to run at speeds in the range of mm s−1 to m s−1. In this work a highly viscous lubricant, PB1300, is used, requiring the use of lower velocities in the range of μm s−1. Therefore a tribometer (CETR) was used to measure the friction of an EHD contact lubricated with PB1300. Two load cells were used, one with a range of 0.5–5 N and a second with a range of 1–100 N. Note that the setups used for LIF and velocimetry measurements use a rotating sphere and a stationary glass flat. In contrast, for the friction measurements, a glass disc (similar to glass slides used for other experiments) rotates while the sphere is fixed to a force sensor. Previous results have shown that the difference between results acquired for glass sphere and glass disc rotation is minimal.25Measurements were performed for plain spheres and Fusso coated spheres at various loads and velocities. Lubricant was deposited on the glass disc. To avoid contribution to the friction force by lubricant outside of the contact, a wiper was used to form a thin film of lubricant prior to testing.
Photobleached-fluorescence imaging velocimetry
Details of the photobleached-fluorescence imaging velocimetry technique applied in this study can be found in ref. 18. A brief description is given here.Photobleached-fluorescence imaging velocimetry enables the determination of the velocity distribution, u(z), of a fluorescent dye doped lubricant in an EHD contact. Fig. 3a depicts a small volume of lubricant inside an EHD contact where the film thickness is approximately constant. It portrays the case where the lubricant slips at the lubricant–solid interface due to the application of a low surface energy coating. To evaluate u(z), the lubricant is tagged using a focused high powered laser beam, which photobleaches the dye dissolved into the lubricant in the focal volume. A tagged column with significantly weaker fluorescence intensity than the bulk lubricant is hence created, as shown in Fig. 3a. The tagged column is perturbed by the flow of the lubricant and its shape changes. If the evolution of this shape change is captured by imaging, it is possible to deduce the flow, i.e. u(z) of the lubricant. Due to the microscopically thin film and the diffraction limit, only the x–y plane can be imaged, as shown in Fig. 3b, where the initial column appears as a spot. Hence experimental results are in the form of sequences of images that depict the shape evolution of the tagged column against time, imaged on the x–y plane. Due to the small lubricant film thickness, the signal-to-noise (S–N) ratio of images obtained is low and synchronous averaging is implemented26 to improve the S–N ratio. The phosphorescence from rubbing surfaces is eliminated by subtracting each experimental sequence by a calibration sequence which captured the phosphorescence of the surfaces only. The phosphorescence-corrected sequences are used for analysis. It should be noted that the heating of the lubricant, due to the photobleaching process, is negligible.18
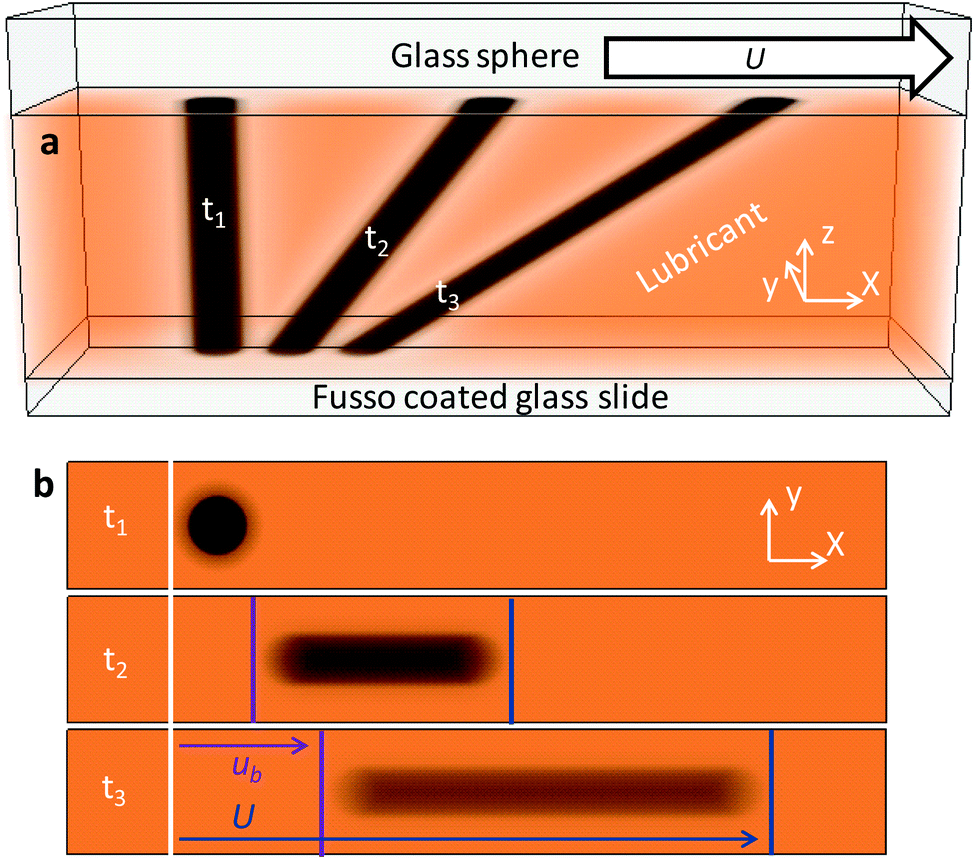 | ||
| Fig. 3 Schematic of the principles of photobleached-fluorescence imaging velocimetry. (a) A photobleached column is shown at three different times, t. (b) Projection of (a) onto the x–y plane. The perturbation of the spot can be used to determine the slip velocity, ub, and the velocity of the glass sphere, U. | ||
It is assumed that the film thickness is constant and that diffusion of Nile red in PB1300 is slow, as shown previously.18 A velocity profile reconstruction scheme which involves iteratively guessing u(z) and solving the scalar transport equation has been developed to determine u(z) using a non-linear least squares minimization algorithm implemented in Matlab (previously detailed18). In former studies, the lubricant was modelled by the motion of infinitesimal layers for which the velocity was solved and only the condition of profile continuity was imposed.18,19 An alternative solution of describing the general shape of the velocity profile by polynomials27 is implemented in this work instead, to produce a more accurate estimation of slip velocities. A cubic polynomial was chosen and the coefficients of the polynomial were determined and used in the velocity profile reconstruction scheme, as simulations based on experimental conditions showed that this order was sufficient for accurately determining slip velocities within 10%.
Results and discussion
In this section, interfacial slip on Fusso coated glass is assessed directly. The relationship between the amount of interfacial slip and applied pressure is established. The effect of slip on friction and film thickness is then quantified. The EHD contacts were fully flooded with lubricants in all applied experimental conditions, as confirmed by LIF film thickness measurements.Studies have been performed on systems with solidified lubricant, which suggest that slip may occur.28,29 Due to the potentially complicated interaction between solidified flow and slip, lubricant solidification is specifically avoided in this study by carrying out tests at a sufficiently low pressure.19 Hence all experiments in this study were conducted at maximum pressure below 390 MPa.
The effect of applied pressure on interfacial slip
Velocity profiles at the centre of the EHD contact have been obtained at various pressure and speed with Photobleached-fluorescence imaging velocimetry. For the experimental conditions investigated, the apparent shear rate remains fairly constant and hence the effect of apparent shear rate on slip is not expected. Measurements were repeated three times.Typical profiles for glass–Fusso EHD contacts are shown in Fig. 4. The result for the normalised relative intensity distribution (the degree of photobleaching), as defined previously,18 at a speed of 720 μm s−1 and pressures of 137 MPa (0.9 N) and 260 MPa (6.4 N), are presented in Fig. 4a and b respectively. In both figures, the top row shows the experimental result while the bottom row depicts the intensity distribution, resulting from the determined velocity profile. One-dimensional intensity distributions through the centre of the photobleached volume of the experimental and reconstructed results are shown in Fig. 4c and d. These distributions were obtained by averaging the data in Fig. 4a and b over five pixels in the y-direction, centred about the photobleached volume, to reduce noise. The displacement of the back of the photobleached volume, shown by its initial (labelled as ‘A’) and final (labelled as ‘B’) positions, indicates that slip occurs at the PB–Fusso coated glass slide interface at both pressures. However, the shape of the photobleached volume differs significantly at low and high pressure. At low pressure stretching of the photobleached column is observed. At high pressure (Fig. 4b and d), there is nearly no stretching of the photobleached volume and the back of the volume moves dramatically. This suggests that significant slip takes place at the PB–Fusso interface at high pressure.
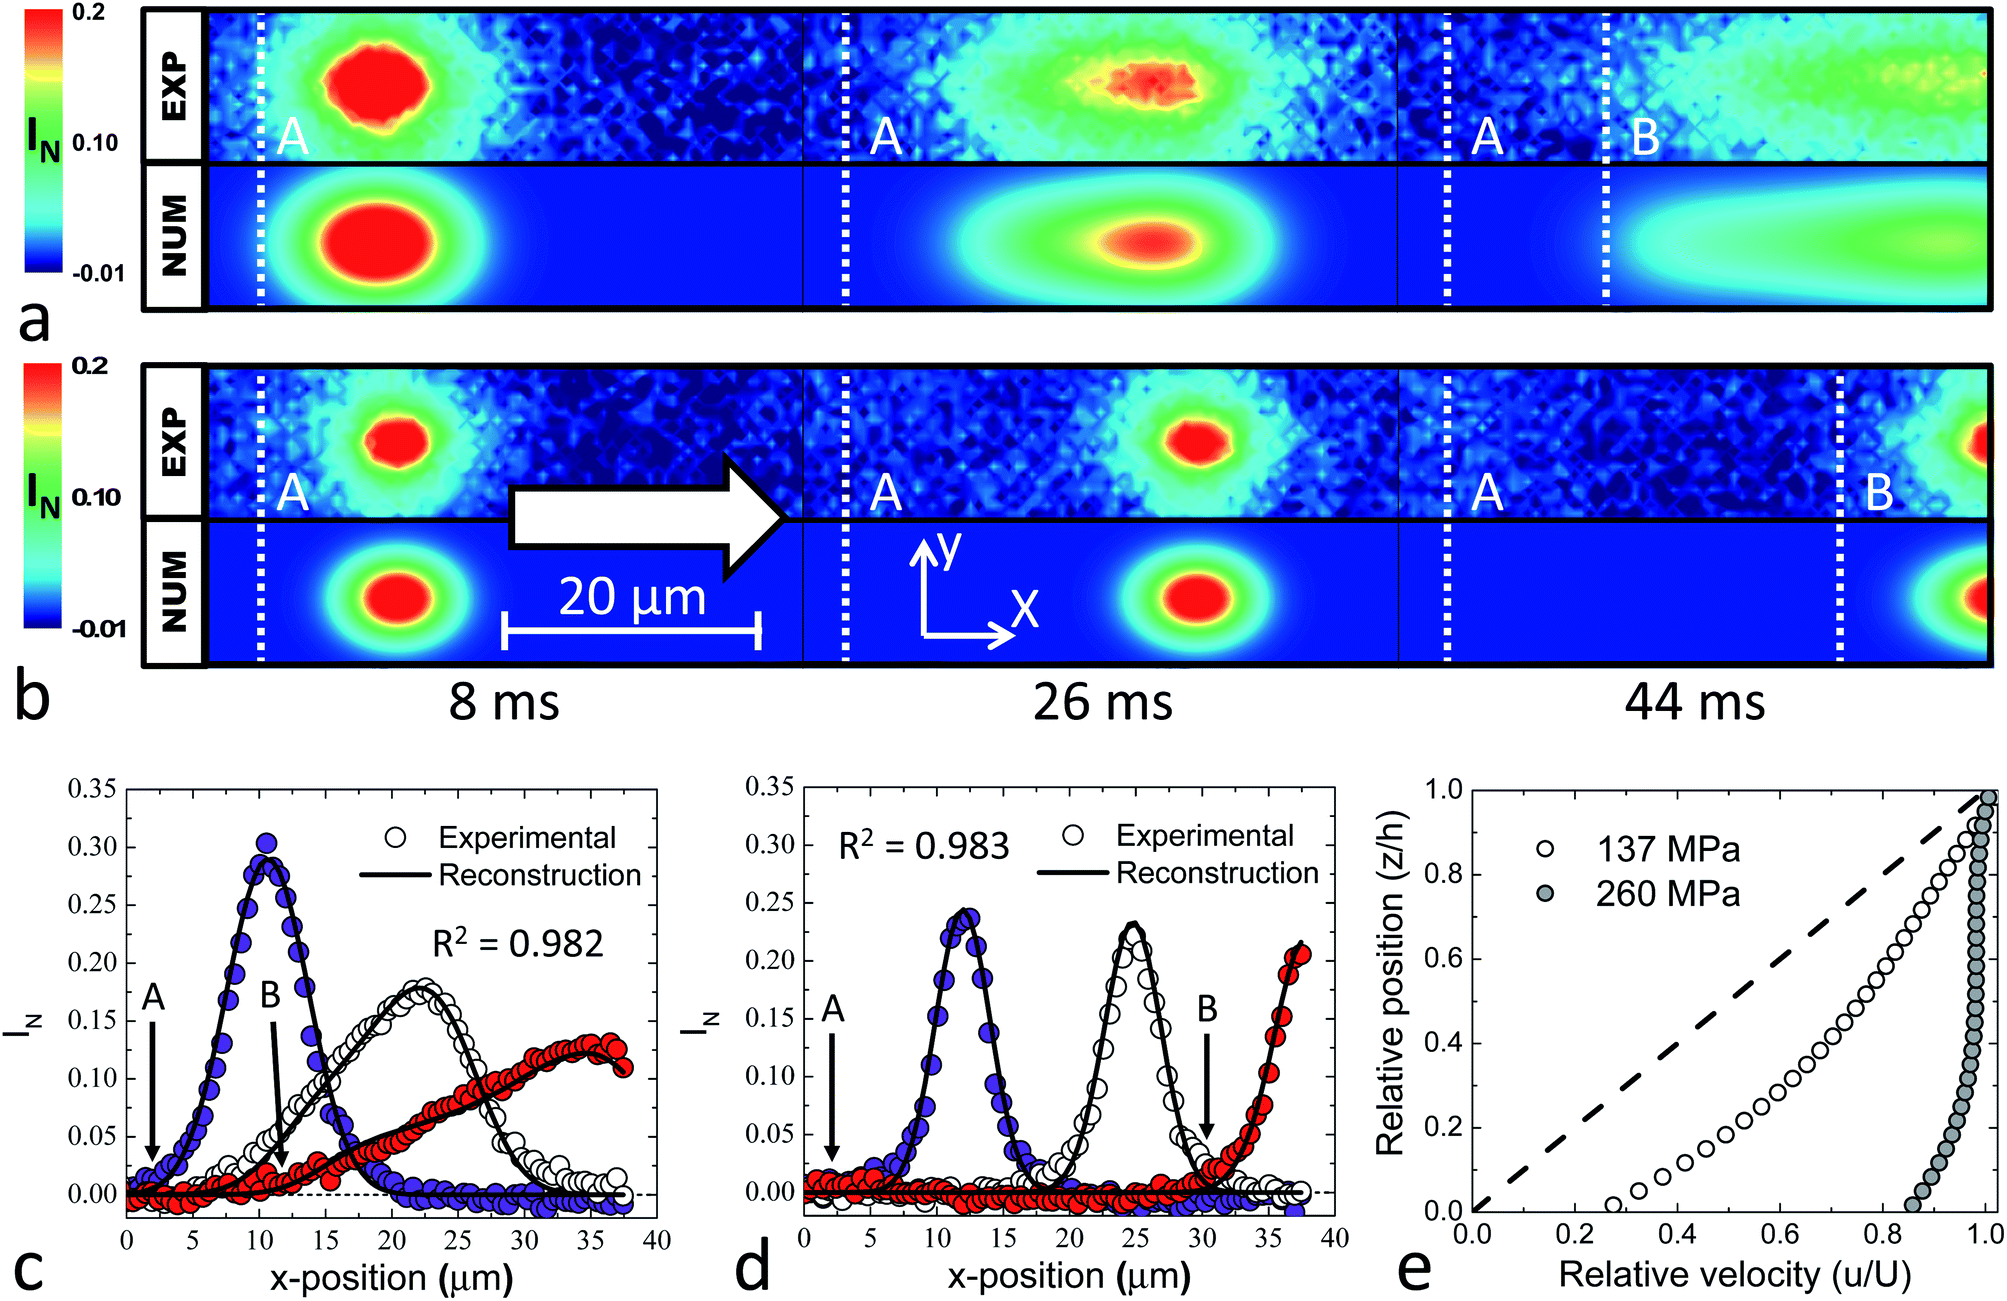 | ||
| Fig. 4 Comparison between velocimetry results the for glass–Fusso contact at different maximum normal pressure. (a and b) Experimental (exp) and numerical (num) normalised intensity distribution at three times for (a) 137 MPa and (b) 260 MPa. ‘A’ indicates the initial back position of the photobleached column and ‘B’ indicates the back position when there is slip. The colour bar represents the normalised relative intensity as previously defined.18 The arrow shows the direction of the flow. (c and d) Averaged distributions from (a and b) for the (c) 137 MPa and (d) 260 MPa. (e) Velocity profiles determined for the data in (c and d). The dashed line shows the theoretical Couette profile. | ||
The velocity profile obtained by the reconstruction scheme using a cubic polynomial fit is shown in Fig. 4e. It is clear that the applied normal pressure affects the resulting velocity profiles. At 137 MPa, the profile approximates a linear Couette flow, as expected at low pressure conditions.19 There is a small bump near the centre of the film which could be related to pressure driven flow, inhomogeneous shear or the resolution of the technique. The relative slip velocity, ub/U, is 0.24, where ub is the slip velocity and U is the ball speed. Assuming a linear velocity profile, this corresponds to a slip length of 70 nm. This is calculated using brel = (ub/U)/(1 − ub/U), where brel = b/h is the relative slip length for the slip length, b, and the film thickness, h. At 260 MPa, the velocity profile is almost vertical, with slight waviness. The waviness is an effect of the polynomial fitting and occurs when the relative shear rate is small, as information about the deformation of the lubricant becomes limited. The relative slip velocity is 0.85, which results in a significant reduction of the shear rate experienced by the lubricant. This corresponds to a slip length of approximately 518 nm. Hence an increase in applied pressure increases the amount of interfacial slip at the PB–Fusso interface. Similar relative slip velocity was observed at the moving surface of an EHD contact formed with a rotating Fusso-coated sphere and a stationary glass slide (not shown). This validates the existence of boundary slip due to the application of the oleophobic coating.
The relationship between brel and applied pressure in a glass–Fusso EHD contact is presented in Fig. 5. The results clearly show that the relative slip length increases with the applied pressure. This may be due to pressure-enhanced viscosity of PB in an EHD contact. The existence of a critical shear stress has been associated with interfacial slip phenomenon.2,6,16 Once the interfacial shear stress reaches critical shear stress, slip occurs. An increase in viscosity can allow the critical shear stress to be reached at lower shear rate, which corresponds to a larger relative slip length. This would manifest as an increase in slip length with pressure. Similarly to a previous analysis on slip in EHD lubrication,15 the relationship can be described by a power law of the form brel = Apn, where p is the pressure in MPa, A = 5 × 10⁻⁹ and n = 3.7 are fitting coefficients.
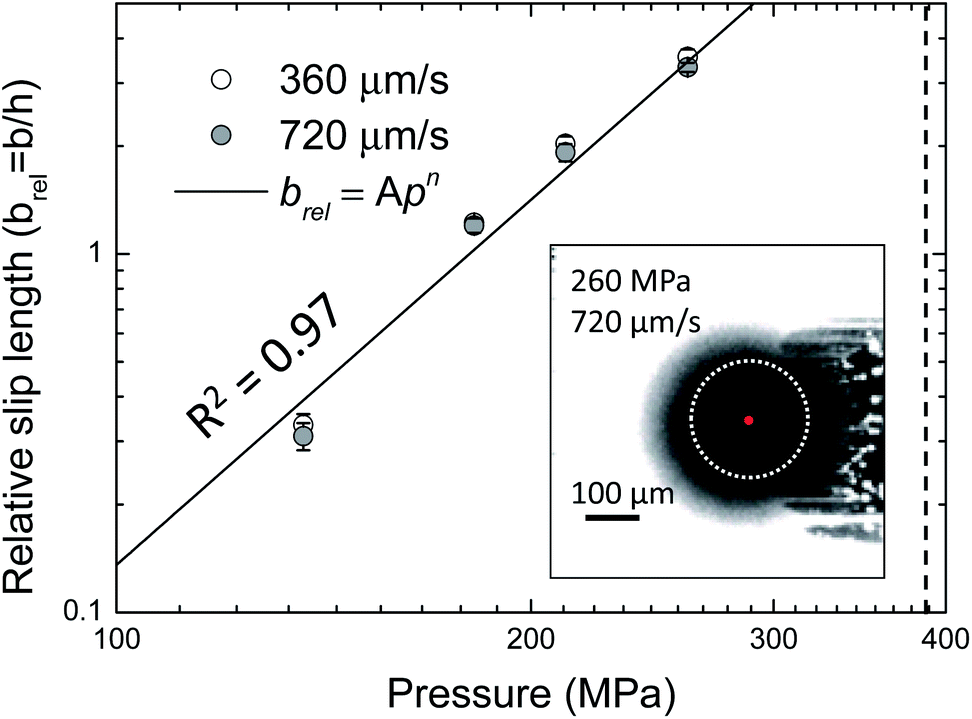 | ||
| Fig. 5 Slip length as a function of pressure in a glass–Fusso EHD contact at two different speeds. The black line indicates a power law fit. The dotted line shows the glass transition pressure.19 The inset shows the contact area (white dotted line) and the probing position (red dot). | ||
Results given in Fig. 4 and 5 clearly illustrate that interfacial slip is pressure-dependent. This conclusion is supported by previous experimental studies on the slip of PB15 and polyisobutylene.30 These results also directly show that the slip velocity can be large, a conclusion that is difficult to make solely based on friction measurements.
Spatially heterogeneous slip flow in EHD contacts
The pressure in an EHD contact varies with position. The exact solution for the pressure distribution is nontrivial, but a good approximation is the Hertzian solution for a static point contact. Given the clear dependency of pressure on the slip length, spatial heterogeneities of the velocity profile and the slip velocity in an EHD contact are expected.The slip velocity was measured by photobleached-fluorescence imaging velocimetry at various positions along the centre of the glass–Fusso EHD contact, at two pressures. Measurements were repeated three times. The result and the predicted relative velocity at a peak pressure of 260 MPa are shown in Fig. 6. The variation of relative slip velocity with position in the contact can clearly be observed. The slip velocity is negligible outside the contact, but increases significantly towards the centre where the pressure is larger. At 260 MPa, the relative slip velocity distribution matches the predicted distribution, but is slightly shifted to the right. This is because the prediction is based on a Hertzian point contact pressure distribution. A typical pressure distribution in EHD contacts resemble a Hertzian pressure distribution shifted toward the outlet, hence the discrepancy between predicted and experimental results. At 211 MPa, minimal slip is observed at the inlet as the pressure near the inlet is insufficient to facilitate slip. Significant slip occurs towards the outlet, where pressures are large.
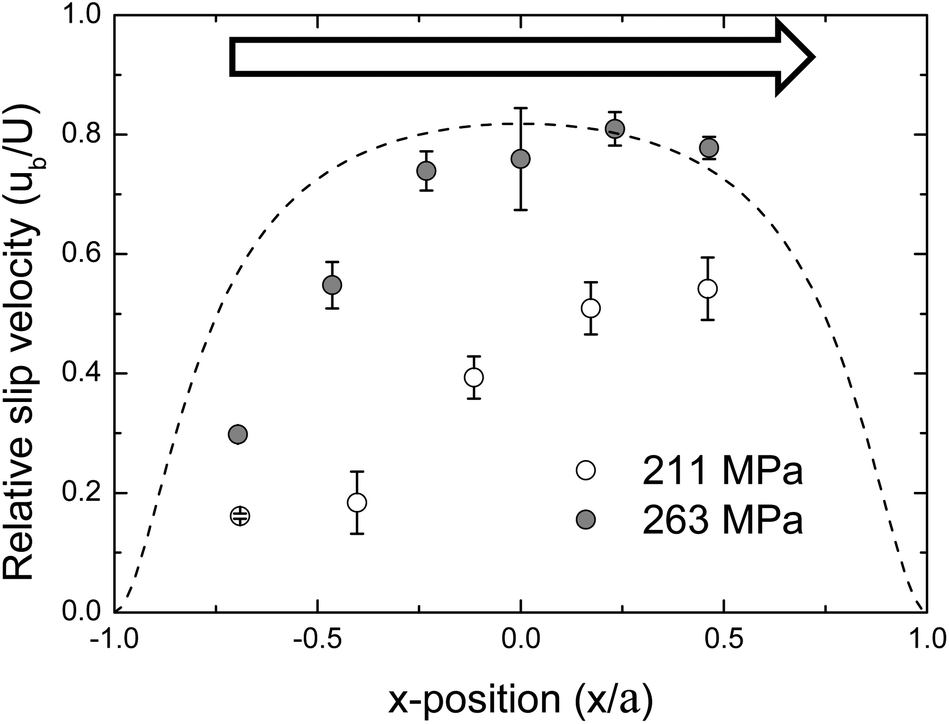 | ||
| Fig. 6 Spatial distributions of the relative slip velocity at two pressures for U = 720 μm s−1x/a = 0 is the centre of the glass–Fusso EHD contact with radius = a. The dash line corresponds to the predicted relative slip velocity based on a Hertzian contact pressure distribution with a peak pressure of 260 MPa. The arrow indicates the flow direction. | ||
The existence of spatial flow heterogeneity complicates the prediction of friction in contacts with significant slip. Since the extent of interfacial slip increases with applied pressure, this complication does not affect hydrodynamic friction calculations, where the lubricant is isoviscous, resulting in mostly homogeneous shear stresses.12 The observed slip length distribution would however apply to studies of systems in the EHD regime,13,25 where numerical and theoretical analyses would be complicated by the unknown relationship between interfacial slip and pressure. This complexity is typically overcome by assuming a constant slip length. The result in Fig. 6 shows that this is not an appropriate assumption.
Relating measured slip with film thickness
The occurrence of interfacial slip will increase the average velocity of the lubricant in the contact, and hence the film thickness will be affected. As shown in Fig. 6, a spatial distribution of the slip velocity exists in the glass–Fusso EHD contact, where interfacial slip increases with local pressure. Hence the film thickness in a glass–Fusso EHD contact is expected to be different to that in a glass–glass EHD contact, especially at high pressure.Film thickness results acquired along the flow direction (x-direction), through the centre of the contact, at a central pressure of 260 MPa (6.4 N) and 137 MPa (0.9 N), and a speed of 720 μm s−1 are shown in Fig. 7 for the glass–Fusso (grey circles) and the glass–glass (open circles) contacts. For the lower pressure (inset in Fig. 7), the presence of the coating does not affect the film thickness significantly, suggesting that there is no interfacial slip. Here, the film thickness is not constant as the contact is operating in the hydrodynamic regime. The lubricant film thickness obtained from the two contacts at 260 MPa, however, show clear differences. For the glass–glass contact, the film thickness appears constant in the centre of contact with a constriction near the outlet, confirming that the contact is operating in the EHD regime. For the glass–Fusso contact, the central film thickness is roughly half of that obtained with glass–glass contact. This can be due to significant interfacial slip (as shown in Fig. 6), leading to a substantial increase in the mean velocity of PB in the glass–Fusso contact. Note that the film thicknesses outside of the contact are identical in both cases. This is because there is insufficient pressure to facilitate slip outside the glass–Fusso contact. Fig. 7 also confirms that the contact is fully flooded by lubricant. Results for central film thickness measured by LIF in the glass–glass contact (no slip observed), hn, and glass–Fusso contact (slip occurs), hs, at a peak pressure of 260 MPa are shown in Fig. 8 as a function of speed. hs is much smaller than hn at all speeds. On the other hand, hn and hs are similar at 137 MPa (not shown). This confirms observations made in Fig. 7 that film thickness reduction due to slip requires high normal pressure.
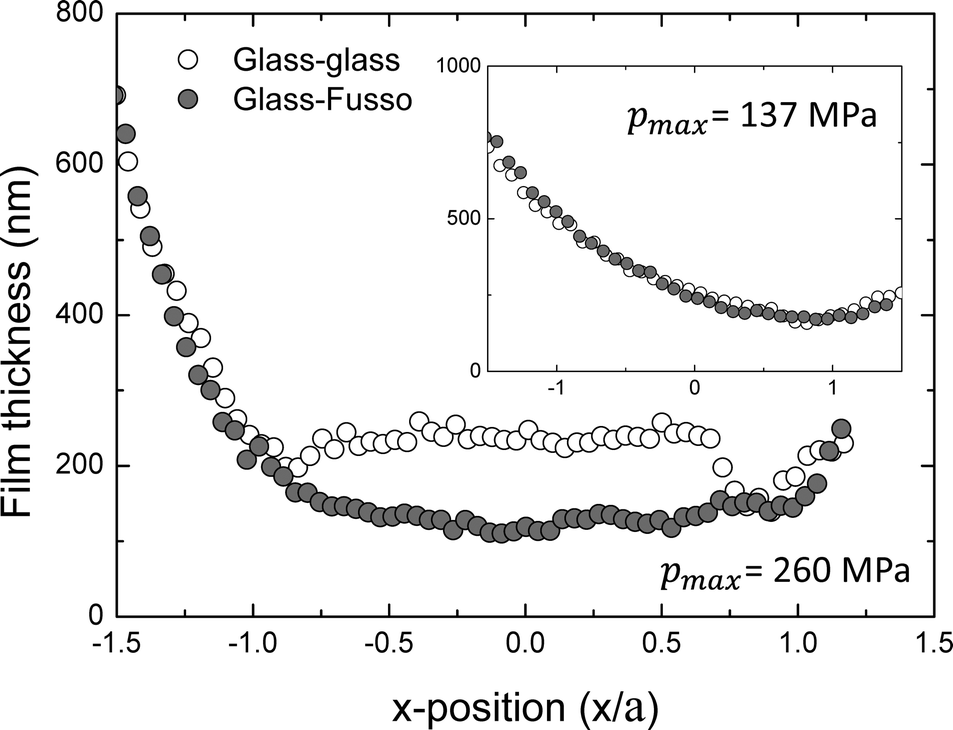 | ||
| Fig. 7 Film thickness distributions at 260 MPa and 137 MPa (inset). U = 720 μm s−1. | ||
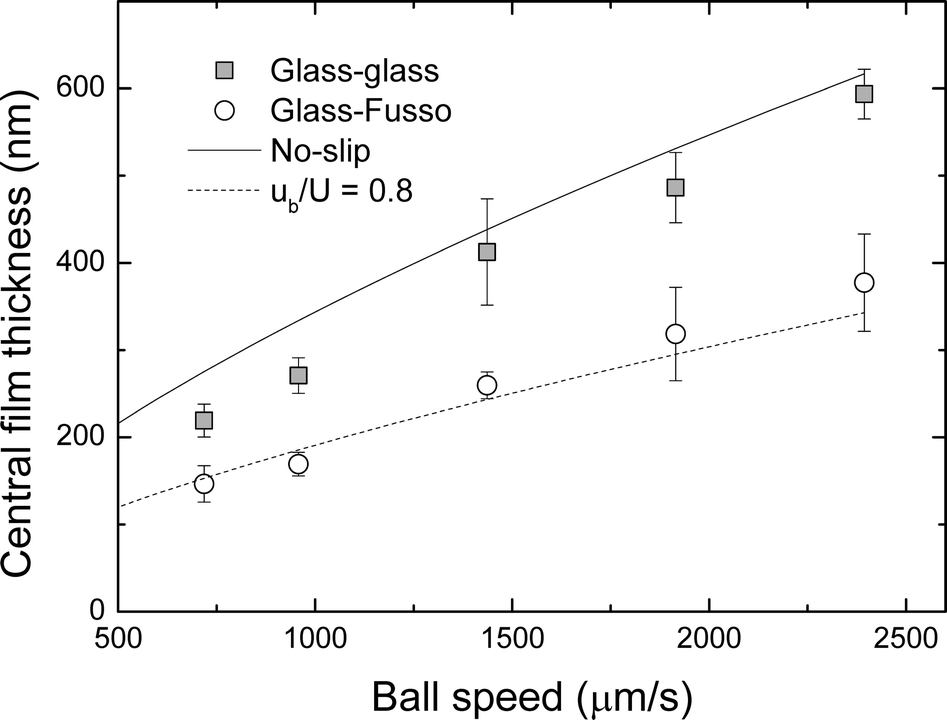 | ||
| Fig. 8 Film thickness as a function of ball speed for the bare and coated glass slides at 260 MPa. | ||
If the interfacial slip is responsible for the difference in hn and hs, information on interfacial slip in the glass–Fusso contact should enable the prediction of such differences. Assuming that the lubricant is incompressible, spatial variations of slip in an EHD contact require the fluid to accelerate or decelerate for mass to be conserved. In the case of a glass–glass contact with no slip, hn is constant throughout the contact and equal to the inlet film thickness, h0. The conservation of mass requires that the flow rate in the x–z plane, dQ = u(z)hdy (see Fig. 3 for axis notation), is constant. This implies that an increase in the local mean velocity of the lubricant, due to a slip velocity, ub, is balanced by a decreased film thickness. Assuming that u(z) is approximately linear, the ratio between hs and hn, obtained for the same experimental conditions, is given by
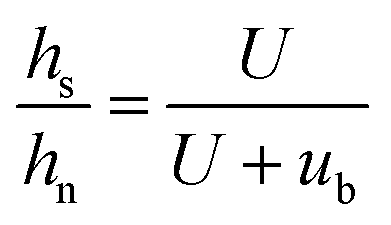 | (1) |
Eqn (1) enables an estimation of the reduced film thickness if the slip velocity is known.
If the pressure–viscosity coefficient, α, of the lubricant is known, the central film thickness, hc, in an EHD contact under no-slip boundary conditions can be estimated using the Dowson–Hamrock equation.31
hc = 1.90Ū0.67Ḡ0.53![[W with combining macron]](https://www.rsc.org/images/entities/i_char_0057_0304.gif) −0.067 −0.067 | (2) |
are non-dimensional parameters for the velocity, materials and load respectively.31α was determined by interferometric measurements of PB in a steel–glass contact18 and was used to estimate film thickness for the glass–glass contact as shown in Fig. 8 (solid line). It generally matches the experimental data for the glass–glass contact (solid square) and hence confirms that no-slip boundary condition indeed applies.
To predict hs due to interfacial slip on Fusso-coated glass, hn = hc, as predicted by eqn (2). Assuming a Hertzian pressure distribution in the EHD contact, the relationship between interfacial slip and pressure for a glass–Fusso contact, i.e. brel = 5 × 10⁻⁹p3.7 as shown in Fig. 5, can be used to estimate the slip length. With a linear u(z), ub can then be calculated from brel. Eqn (1) is then used to calculate hs, shown as dashed line in Fig. 8. It agrees with the data for the glass–Fusso contact (open circle). Hence the interfacial slip is responsible for the reduced film thickness observed in glass–Fusso contact.
This result shows that the mechanism of slip explains the reduction in film thickness caused by the application of the Fusso coating. For the first time, to the best of our knowledge, the slip velocity has been directly measured and correlated with film thickness measurements. This elucidates the effect of slip on film thickness in an EHD contact, showing how film thickness reduces as a consequence of slip.
Relating measured slip with friction
The lower interfacial energy between PB and Fusso, as compared to PB and bare glass, as shown by contact angle measurements, means the former can sustain lower interfacial shear stress than the latter. This reduced shear stress leads to three consequences in an EHD contact: first, the occurrence of interfacial slip; second, a reduction of measured friction; and third, a reduction in apparent shear rate. Hence a reduction in friction in the glass–Fusso contact is expected. Friction measurements were repeated four times for each condition and the dependency of the coefficient of friction (COF) on speed is presented Fig. 9. Similar to the results from the film thickness measurement, high pressure is required for friction reduction to occur. No significant difference in frictional response for glass–glass and glass–Fusso contacts can be discerned at low pressure (123 MPa, 0.5 N) (Fig. 9 inset). At a higher pressure of 242 MPa (5 N), a dramatic reduction in friction is however observed for the glass–Fusso contact which is caused by interfacial slip. The presence of slip in a glass–Fusso contact decreases the actual shear rate sustained by the lubricant, which reduces the shear stress and thus the friction coefficient. The maximum of 60% reduction in friction is observed at the lowest applied speed. This friction reduction is significantly larger than that observed for DLC coated surfaces13 and for hydrodynamic flow on hydrocarbon monolayers.12 The reduction obtained here is also greater than that shown for PB when comparing silica (no slip) and chromium (slip) surfaces.25 This suggests that the Fusso coating requires lower shear stresses than a chromium coating does to produce a pronounced slip effect. | ||
| Fig. 9 Coefficient of friction (COF) as a function of speed for the bare and coated glass sphere at central pressures of 242 MPa (5 N) and 123 MPa (0.5 N (inset)). | ||
The relative friction, FF/FG, as a function of load and sliding speed is shown in Fig. 10a, where FF and FG are frictional forces for the glass–Fusso and glass–glass contacts respectively. At lower loads the uncertainty is relatively large as the resolution of the friction measurement approaches that of the friction force. Therefore the uncertainty reduces at higher loads. In all cases, FF/FG is less than one, i.e. the Fusso coating reduces friction. In addition, the friction reduction increases, i.e. FF/FG decreases, with applied pressure, as well as reduced ball speed, reaching a maximum reduction of 65% (FF/FG = 0.35) at 349 MPa (15 N) and 200 μm s−1. The friction reduction due to an increase in pressure can be explained by the increase in interfacial slip with pressure (as shown in Fig. 5), whereas the effect of shear rate is less straightforward. The condition in the EHD contact is likely to cause PB to be non-Newtonian and to experience shear-thinning. Since the apparent shear rate remains fairly constant with speed in the glass–Fusso contact, while the apparent shear rate increases in glass–glass contact (due to no-slip boundary condition), the effect of shear thinning is more prominent in the latter. Hence the relative friction will increase with the speed.
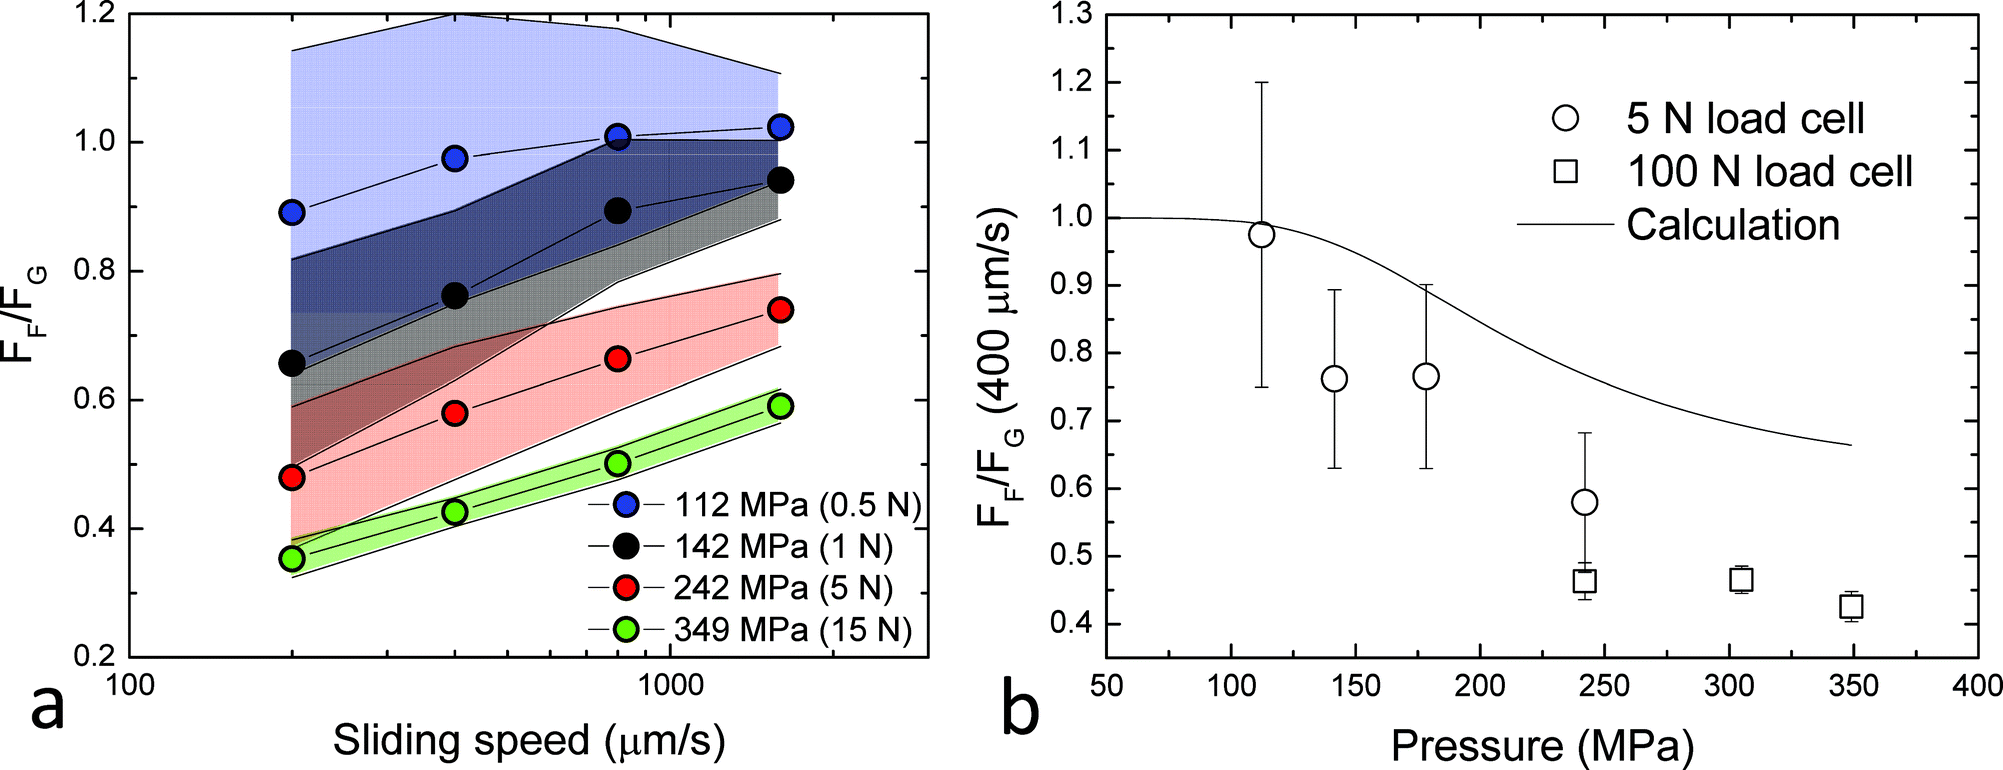 | ||
| Fig. 10 (a) Relative friction of the Fusso (FF) and glass (FG) surfaces as a function of speed and load. (b) Relative friction as a function of pressure at the speed 400 μm s−1. The black line indicates the calculated friction. | ||
If interfacial slip is responsible for the reduction in friction so that FF/FG < 1, the slip length distribution in the EHD contact should enable the prediction of FF/FG. To calculate the friction in a contact, based on the known film thickness and slip length, it is necessary to relate the shear rate to the shear stress as described by the lubricant rheology.8 This is commonly done by measuring the friction as a function of sliding velocity while varying the applied pressure. By considering an average shear stress, ![[small sigma, Greek, macron]](https://www.rsc.org/images/entities/i_char_e0d2.gif) = F/(πa2), where F is the friction force and a is the contact radius, it is then possible to produce a flow curve, which relates the shear stress, σ, to the shear rate,
= F/(πa2), where F is the friction force and a is the contact radius, it is then possible to produce a flow curve, which relates the shear stress, σ, to the shear rate, ![[small gamma, Greek, dot above]](https://www.rsc.org/images/entities/i_char_e0a2.gif) = U/h. The experimental data can then be fitted by a rheological model. A common choice is the model by Evans and Johnson,32 which in the case of negligible elasticity is defined as
= U/h. The experimental data can then be fitted by a rheological model. A common choice is the model by Evans and Johnson,32 which in the case of negligible elasticity is defined as
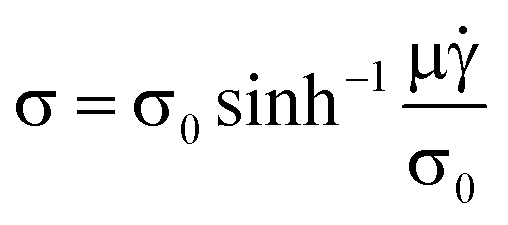 | (3) |
![[thin space (1/6-em)]](https://www.rsc.org/images/entities/char_2009.gif) eαp, where μ0 is the ambient viscosity and α is the pressure–viscosity coefficient.
eαp, where μ0 is the ambient viscosity and α is the pressure–viscosity coefficient.
The parameters in eqn (3) were determined by performing friction measurements for PB in a glass–glass contact at loads between 5–15 N and speeds of 200–1600 μm s−1 (results not shown). The loads were chosen to avoid possible solid plug flow which has been observed above a critical pressure.19 The parameters were evaluated for a Hertzian pressure distribution, since the assumption of average properties used in eqn (3) is unlikely to apply, as shown in Fig. 6. There are issues with this methodology. All measurements were performed in pure sliding conditions; hence the range of accessible shear rates was limited. Despite these limitations, the fitting enables the calculation of a friction coefficient based on the calculated film thickness and slip distribution, detailed below.
The EHD friction of a glass–Fusso contact with a diameter of 2a centred at x = 0 is predicted. Properties in the contact are evaluated over a discrete matrix of size 100 × 100, spanning x = −a → a and y = −a → a. At each discrete cell, the slip velocity, ub, and film thickness, hs are estimated, as detailed in the previous section. Using ub and hs, the shear rate is obtained by assuming a linear u(z). The shear stress can then be evaluated based on eqn (3). Finally, the shear stress for each cell is integrated over the whole EHD contact, resulting in the predicted friction force in a glass–Fusso contact, FF. A similar procedure was applied to obtain predicted friction in glass–glass contact, FG, using hn and eqn (3).
The predicted relative friction (solid line) is compared to experimental data (open symbols) as a function of pressure in Fig. 10b, obtained at the speed of 400 μm s−1. The results for the two load cells do not overlap completely, but the general trend of a decrease in relative friction with increased pressure can be observed. While this trend is described by the calculation, confirming the role of interfacial slip in the reduction of EHD friction, the prediction is consistently above the experimental value. This suggests that either FF has been overestimated, or FG has been underestimated. This discrepancy could be caused by an inaccurate rheological description of the lubricant or uncertainties in the determination of the slip length as well as an incomplete understanding of the effect of slip on friction.
Conclusions
This work clearly shows that the application of an oleophobic coating can introduce interfacial slip in an EHD contact. By comparing results obtained in EHD contacts with and without slip, this work highlights the complex interplay between film thickness, friction and slip in EHD lubrication. The amount of slip is pressure dependent. The slip relates to the pressure by a power law expression. Due to the Hertzian pressure distribution in the point contact, the amount of slip also varies with position in a contact. The general effects of slip on film thickness and friction in an EHD can be explained by directly measuring interfacial slip. It was shown that the film thickness drops due to flow acceleration and that the friction decreases due to a reduction in interfacial shear stress, which leads to interfacial slip and reduced effective shear rate. While the expression for the slip length could be used to predict film thickness in an EHD contact with interfacial slip, prediction of the friction under slip conditions was less successful. This illustrates the need for improved methods of directly evaluating lubricant flow, as well as the necessity of probing the validity of available rheological models and their use in friction estimation.Acknowledgements
This work is supported by EPSRC platform grant no. EP/G026114/1 and EPSRC Grant no. EP/J015385/1. J.W. would like to thank Taiho Kogyo Tribology Research Foundation for financial support for equipment. A.P. was sponsored by EPSRC DTA studentship. The authors would like Hugh Spikes, Daniele Dini and Luca di Mare for fruitful discussions. The authors would also like to thank PL Wong for suggestions on the oleophobic coating.Notes and references
- C. Neto, D. R. Evans, E. Bonaccurso, H. J. Butt and V. S. J. Craig, Rep. Prog. Phys., 2005, 68, 2859 CrossRef CAS.
- Y. Zhu and S. Granick, Phys. Rev. Lett., 2002, 88, 106102 CrossRef.
- E. Bonaccurso, M. Kappl and H.-J. Butt, Phys. Rev. Lett., 2002, 88, 1–4 CrossRef.
- K. Migler, H. Hervet and L. Leger, Phys. Rev. Lett., 1993, 70, 287–290 CrossRef CAS.
- O. I. Vinogradova, K. Koynov, A. Best and F. Feuillebois, Phys. Rev. Lett., 2009, 102, 118302 CrossRef.
- L. Leger, H. Hervet, G. Massey and E. Durliat, J. Phys.: Condens. Matter, 1997, 9, 7719 CrossRef CAS.
- S. G. Hatzikiriakos, Prog. Polym. Sci., 2012, 37, 624–643 CrossRef CAS PubMed.
- A. V Olver and H. A. Spikes, Proc. Inst. Mech. Eng., Part J., 1998, 212, 321–332 CrossRef.
- R. Gohar, Elastohydrodynamics, World Scientific Publishing Company, 2001 Search PubMed.
- P. Joseph, C. Cottin-Bizonne, J.-M. Benoît, C. Ybert, C. Journet, P. Tabeling and L. Bocquet, Phys. Rev. Lett., 2006, 97, 1–4 CrossRef.
- C. Lee and C. J. C. J. Kim, Langmuir, 2009, 25, 12812–12818 CrossRef CAS PubMed.
- J. H. Choo, H. A. Spikes, M. Ratoi, R. Glovnea and A. Forrest, Tribol. Int., 2007, 40, 154–159 CrossRef CAS PubMed.
- M. Kalin, I. Velkavrh and J. Vižintin, Wear, 2009, 267, 1232–1240 CrossRef CAS PubMed.
- P. L. Wong, X. M. Li and F. Guo, Tribol. Int., 2013, 61, 116–119 CrossRef CAS PubMed.
- X. M. Li, F. Guo and P. L. Wong, Tribol. Int., 2013, 59, 147–153 CrossRef CAS PubMed.
- H. A. Spikes, Proc. Inst. Mech. Eng., Part J., 2003, 217, 15–26 CrossRef.
- B. P. Mosier, J. I. Molho and J. G. Santiago, Exp. Fluids, 2002, 33, 545–554 CrossRef CAS PubMed.
- A. Ponjavic, M. Chennaoui and J. S. S. Wong, Tribol. Lett., 2013, 50, 261–277 CrossRef.
- A. Ponjavic, L. di Mare and J. S. S. Wong, J. Polym. Sci., Part B: Polym. Phys., 2014, 52, 708–715 CrossRef CAS.
- M. Osa, F. Abe, T. Yoshizaki, Y. Einaga and H. Yamakawa, Macromolecules, 1996, 29, 2302–2308 CrossRef CAS.
- N. Sarkar, K. Das, D. N. Nath and K. Bhattacharyya, Langmuir, 1994, 10, 326–329 CrossRef CAS.
- S. H. Anastasiadis and S. G. Hatzikiriakos, J. Rheol., 1998, 42, 795 CrossRef CAS.
- C. Myant, T. Reddyhoff and H. A. Spikes, Tribol. Int., 2010, 43, 1960–1969 CrossRef CAS PubMed.
- L. Wedeven, PhD thesis, London University, 1970.
- Z. Fu, P. L. Wong and F. Guo, Tribol. Lett., 2012, 49, 31–38 CrossRef PubMed.
- S. Braun, Mech. Syst. Signal Process, 2011, 25, 1087–1102 CrossRef PubMed.
- C. Garbe, Pattern Recognit., 2007, LNCS 4713, pp. 92–101 Search PubMed.
- F. Guo and P. L. Wong, J. Tribol., 2005, 127, 425 CrossRef.
- K. Yagi, J. Sugimura and P. Vergne, Tribol. Int., 2012, 49, 58–66 CrossRef CAS PubMed.
- F. Koran and J. M. Dealy, J. Rheol., 1999, 43, 1291 CrossRef CAS.
- B. J. Hamrock and D. Dowson, J. Lubr. Technol., 1977, 99, 264 CrossRef CAS.
- C. Evans and K. Johnson, Proc. Inst. Mech. Eng., Part C, 1986, 200, 303–312 CrossRef.
| This journal is © The Royal Society of Chemistry 2014 |