Substituent effect on fluorescence signaling of the cell permeable HSO4− receptors through single point to ratiometric response in green solvent†
Manjira Mukherjeea,
Siddhartha Pala,
Buddhadeb Sena,
Somenath Lohara,
Samya Banerjeeb,
Snehasis Banerjeec and
Pabitra Chattopadhyay*a
aDepartment of Chemistry, Burdwan University, Golapbag, Burdwan-713104, West Bengal, India. E-mail: pabitracc@yahoo.com
bDepartment of Inorganic and Physical Chemistry, Indian Institute of Science, Bangalore, 560012, India
cGovt. College of Engineering and Leather Technology, Salt Lake Sector-III, Kolkata 9, India
First published on 21st May 2014
Abstract
Two new 2-(2-aminophenyl)benzimidazole-based HSO4− ion selective receptors, 6-(4-nitrophenyl)-5,6-dihydrobenzo[4,5]imidazo[1,2-c]quinazoline (L1H) and 6-(4-methoxyphenyl)-5,6-dihydrobenzo[4,5]imidazo[1,2-c]quinazoline (L2H), and their 1![[thin space (1/6-em)]](https://www.rsc.org/images/entities/char_2009.gif) :
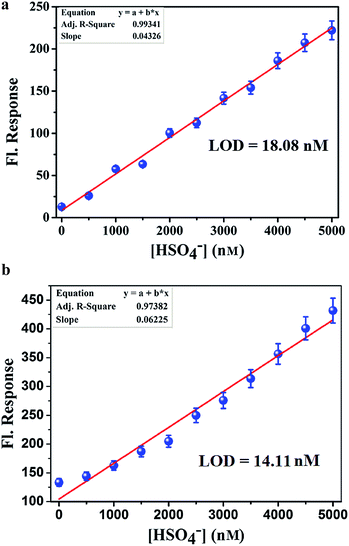
:![[thin space (1/6-em)]](https://www.rsc.org/images/entities/char_2009.gif) 1 molecular complexes with HSO4− were prepared in a facile synthetic method and characterized by physicochemical and spectroscopic techniques along with the detailed structural analysis of L1H by single crystal X-ray crystallography. Both receptors (L1H and L2H) behave as highly selective chemosensor for HSO4− ions at biological pH in ethanol–water HEPES buffer (1/5) (v/v) medium over other anions such as F−, CI−, Br−, I−, AcO−, H2PO4−, N3− and ClO4−. Theoretical and experimental studies showed that the emission efficiency of the receptors (L1H and L2H) was tuned successfully through single point to ratiometric detection by employing the substituent effects. Using 3σ method the LOD for HSO4− ions were found to be 18.08 nM and 14.11 nM for L1H and L2H, respectively, within a very short responsive time (15–20 s) in 100 mM HEPES buffer (ethanol–water: 1/5, v/v). Comparison of the utility of the probes (L1H and L2H) as biomarkers for the detection of intracellular HSO4− ions concentrations under a fluorescence microscope has also been included and both probes showed no cytotoxic effect.
1 molecular complexes with HSO4− were prepared in a facile synthetic method and characterized by physicochemical and spectroscopic techniques along with the detailed structural analysis of L1H by single crystal X-ray crystallography. Both receptors (L1H and L2H) behave as highly selective chemosensor for HSO4− ions at biological pH in ethanol–water HEPES buffer (1/5) (v/v) medium over other anions such as F−, CI−, Br−, I−, AcO−, H2PO4−, N3− and ClO4−. Theoretical and experimental studies showed that the emission efficiency of the receptors (L1H and L2H) was tuned successfully through single point to ratiometric detection by employing the substituent effects. Using 3σ method the LOD for HSO4− ions were found to be 18.08 nM and 14.11 nM for L1H and L2H, respectively, within a very short responsive time (15–20 s) in 100 mM HEPES buffer (ethanol–water: 1/5, v/v). Comparison of the utility of the probes (L1H and L2H) as biomarkers for the detection of intracellular HSO4− ions concentrations under a fluorescence microscope has also been included and both probes showed no cytotoxic effect.
Introduction
The design and development of selective receptors for the anionic analytes have gained considerable attention in recent years because of the biological significance, potential applications in sensors and for the development of phase transfer reagents.1,2 Critical physiological processes are being operated through negative ion gradients across lipid bilayer membranes maintained by anion channels.3 The malfunction of this process leads to severe diseases such as cystic fibrosis, nephrolithiasis, osteopetrosis, Angelman syndrome and Bartter's syndrome type III.4 Among the various anions, hydrogen sulfate (HSO4−) ions dissociate at high pH to generate toxic sulfate (SO42−), which causes irritation of the skin and eyes, and even respiratory paralysis.5 Despite its crucial roles in biological processes, only few examples of cell permeable sensors for HSO4− have been reported.6 Thus, the design of anion sensors for the hydrogen sulfate ion is important and desirable.Sensors based on anion-induced changes in fluorescence are particularly attractive due to their simplicity, high degree of specificity and low detection limits.7 However, from the experimental point of view, it is well known that the ratiometric responses are more attractive because the ratio between the two emission intensities can be used to measure the analyte concentration and to provide a built-in correction for environmental effects and stability under illumination.8 Although there are some reports on single point sensor and ratiometric response, there is no report on the tuning of single point to ratiometric response while keeping the same receptor environment, except for the change in electronic effect, using substituents.
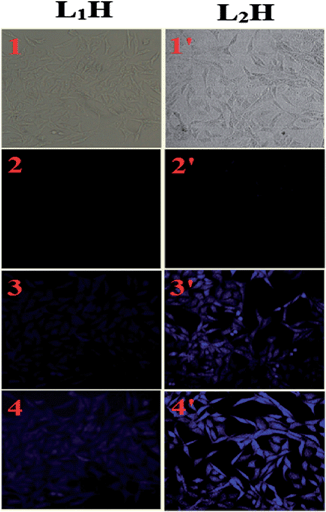
Herein, two newly designed efficient HSO4− ion-selective receptors, 6-(4-nitrophenyl)-5,6-dihydrobenzo[4,5]imidazo[1,2-c]quinazoline (L1H) and 6-(4-methoxyphenyl)-5,6-dihydrobenzo[4,5]imidazo[1,2-c]quinazoline (L2H) from 2-(2-aminophenyl)benzimidazol (viz. Scheme 1) while keeping same receptor environments for the guest (HSO4− ions) have been employed to tune the emission efficiency of these new receptors (L1H and L2H) through single point to ratiometric detection in a green solvent by exploiting the effects of the substituents within the receptors. The organic moieties (L1H and L2H) and the resulting compounds (K[L1H–HSO4] and K[L2H–HSO4]) have been characterized by physicochemical and spectroscopic techniques along with crystallographic analysis of L1H by single crystal X-ray diffraction. Both L1H and L2H behave as highly selective fluorescent and colorimetric sensors for HSO4− ions at biological pH in ethanol–water HEPES buffer (1/5; v/v) compared to other anions such as F−, CI−, Br−, I−, AcO−, H2PO4−, N3− and ClO4−. The receptor L1H behaves as a single point fluorosensor, whereas the receptor L2H behaves as a ratiometric fluorosensor in identical conditions. Both probes (L1H and L2H) were also employed to detect the presence of intracellular bisulphate ions by acquiring the images of HeLa cells under a fluorescence microscope. Comparison of these acquired images showed that the image through ratiometric signaling using L2H is the better one for cell staining, although both probes have no cytotoxic effect.
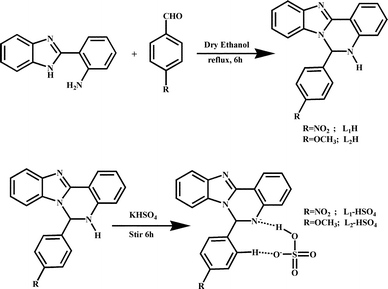 | ||
| Scheme 1 Schematic representation of the synthesis of the probes L1H and L2H, and their corresponding complexes. | ||
Experimental section
Physical measurements
The fluorescence property of the sensor was investigated in water–ethanol (5![[thin space (1/6-em)]](https://www.rsc.org/images/entities/char_2009.gif) :
:![[thin space (1/6-em)]](https://www.rsc.org/images/entities/char_2009.gif) 1, v/v) solvent. The pH study was performed in 100 mM HEPES buffer solution by adjusting pH with HCl or NaOH. The stock solutions (∼10−2 M) for the selectivity study of the receptors (L1H and L2H) towards different anions were prepared with sodium salt of azide, perchlorate, disodium hydrogen arsenate; tetra butyl ammonium salt of chloride, bromide, iodide, acetate, fluoride; dihydrogen phosphate and potassium hydrogen sulphate in water–ethanol (5
1, v/v) solvent. The pH study was performed in 100 mM HEPES buffer solution by adjusting pH with HCl or NaOH. The stock solutions (∼10−2 M) for the selectivity study of the receptors (L1H and L2H) towards different anions were prepared with sodium salt of azide, perchlorate, disodium hydrogen arsenate; tetra butyl ammonium salt of chloride, bromide, iodide, acetate, fluoride; dihydrogen phosphate and potassium hydrogen sulphate in water–ethanol (5![[thin space (1/6-em)]](https://www.rsc.org/images/entities/char_2009.gif) :
:![[thin space (1/6-em)]](https://www.rsc.org/images/entities/char_2009.gif) 1, v/v) solvent. In this selectivity study, the amount of these anions was a hundred times greater than that of the receptor used. Fluorescence titration was performed with potassium hydrogen sulphate in water–ethanol (5
1, v/v) solvent. In this selectivity study, the amount of these anions was a hundred times greater than that of the receptor used. Fluorescence titration was performed with potassium hydrogen sulphate in water–ethanol (5![[thin space (1/6-em)]](https://www.rsc.org/images/entities/char_2009.gif) :
:![[thin space (1/6-em)]](https://www.rsc.org/images/entities/char_2009.gif) 1, v/v) solvent varying the anion concentration from 0 to 100 μM and concentration of the receptors were fixed at 25 μM throughout the experiment.
1, v/v) solvent varying the anion concentration from 0 to 100 μM and concentration of the receptors were fixed at 25 μM throughout the experiment.
Preparation of L1H and L2H
Preparation of two receptors, i.e., L1H and L2H, was carried out following a common procedure. 2-(2-Aminophenyl)-benzimidazole (2.09 g, 10.0 mmol) and 4-nitrobenzaldehyde (1.51 g, 10.0 mmol) (for L1H) or 4-methoxybenzaldehyde (1.36 g, 10.0 mmol) (for L2H) were mixed in dry ethanol (25.0 mL) at room temperature. Then, the reaction mixture was refluxed for 6.0 h. The yellow (L1H) or brown (L2H) precipitate of the compounds were obtained from the solution through slow evaporation of the solvent. The two pure recrystallized compounds were then isolated from methanol.![[double bond, length as m-dash]](https://www.rsc.org/images/entities/char_e001.gif) N = 1612.49; ESI-MS: [M + H]+, m/z, 343.1480 (100%) (calcd: m/z, 342.11; where M = molecular weight of [L1H]); 1H NMR (δ, ppm in DMSO-d6): 8.201 (d–d, 2H, J1 = 7, J2 = 2); 7.986 (d–d, 1H, J1 = 7.75, J2 = 1.5); 7.8 (d, 1H, J = 2.5); 7.7 (d, 1H, J = 8); 7.448 (d–d, 2H, J1 = 7, J2 = 2); 7.361–7.337 (m, 2H); 7.281–7.165 (m, 3H); 6.884–6.856 (m, 2H). Yield: 90%.
N = 1612.49; ESI-MS: [M + H]+, m/z, 343.1480 (100%) (calcd: m/z, 342.11; where M = molecular weight of [L1H]); 1H NMR (δ, ppm in DMSO-d6): 8.201 (d–d, 2H, J1 = 7, J2 = 2); 7.986 (d–d, 1H, J1 = 7.75, J2 = 1.5); 7.8 (d, 1H, J = 2.5); 7.7 (d, 1H, J = 8); 7.448 (d–d, 2H, J1 = 7, J2 = 2); 7.361–7.337 (m, 2H); 7.281–7.165 (m, 3H); 6.884–6.856 (m, 2H). Yield: 90%.![[double bond, length as m-dash]](https://www.rsc.org/images/entities/char_e001.gif) N = 1608.63 1H NMR (δ, ppm in DMSO-d6): 7.96 (d–d, 1H, J1 = 7.6, J2 = 2); 7.651 (d, 1H, J = 8); 7.307–7.077 (m, 7H); 6.866–6.734 (m, 3H); 6.604 (d–d, 1H, J1 = 7.6, J2 = 2); 4.401 (s, 1H); 3.601 (s, 1H). Yield: 90%.
N = 1608.63 1H NMR (δ, ppm in DMSO-d6): 7.96 (d–d, 1H, J1 = 7.6, J2 = 2); 7.651 (d, 1H, J = 8); 7.307–7.077 (m, 7H); 6.866–6.734 (m, 3H); 6.604 (d–d, 1H, J1 = 7.6, J2 = 2); 4.401 (s, 1H); 3.601 (s, 1H). Yield: 90%.Preparation of compounds K[L1H–HSO4] and K[L2H–HSO4]
The preparation of solid complexes was carried out following a common procedure. To a methanolic solution of L1H (342 mg, 1.0 mmol) or L2H (327 mg, 1.0 mmol) (for K[L1H–HSO4] or for K[L2H–HSO4]), solid potassium hydrogen sulphate (136 mg, 1.0 mmol) was added and the reaction mixture was stirred at ambient temperature for 6.0 h. The solution thus obtained was then kept aside for slow evaporation at room temperature. After a few days, deep yellow crystalline complexes were collected by washing with water and methanol, and then dried in vacuo.![[double bond, length as m-dash]](https://www.rsc.org/images/entities/char_e001.gif) O = 1114.86; 1H NMR (δ, ppm in DMSO-d6): 8.201 (d–d, 2H, J1 = 7, J2 = 2); 8.0 (d–d, 1H, J1 = 7.75, J2 = 1.5); 7.82 (d, 1H, J = 2.5); 7.72 (d, 1H, J = 7.5); 7.480–7.458 (m, 2H); 7.39–7.175 (m, 5H); 6.906–6.875 (m, 2H). Yield: 75%.
O = 1114.86; 1H NMR (δ, ppm in DMSO-d6): 8.201 (d–d, 2H, J1 = 7, J2 = 2); 8.0 (d–d, 1H, J1 = 7.75, J2 = 1.5); 7.82 (d, 1H, J = 2.5); 7.72 (d, 1H, J = 7.5); 7.480–7.458 (m, 2H); 7.39–7.175 (m, 5H); 6.906–6.875 (m, 2H). Yield: 75%.![[double bond, length as m-dash]](https://www.rsc.org/images/entities/char_e001.gif) O = 1111.00, 1H NMR (δ, ppm in DMSO-d6): 7.96 (d–d, 1H, J1 = 7.6, J2 = 2); 7.645 (d, 1H, J = 8); 7.306–7.077 (m, 7H); 6.867–6.731 (m, 3H); 6.65 (d–d, 1H, J1 = 7.6, J2 = 1.6); 4.401 (s, 1H); 3.601 (s, 1H). Yield: 75%.
O = 1111.00, 1H NMR (δ, ppm in DMSO-d6): 7.96 (d–d, 1H, J1 = 7.6, J2 = 2); 7.645 (d, 1H, J = 8); 7.306–7.077 (m, 7H); 6.867–6.731 (m, 3H); 6.65 (d–d, 1H, J1 = 7.6, J2 = 1.6); 4.401 (s, 1H); 3.601 (s, 1H). Yield: 75%.X-ray data collection and structural determination
Single crystals suitable for single crystal X-ray crystallography were obtained from the methanolic solution of L1H on slow evaporation at room temperature. X-ray single crystal data were collected using Mo Kα (λ = 0.7107 Å) radiation on a SMART APEX II diffractometer equipped with a CCD area detector. Data collection, data reduction and structure solution/refinement were carried out using the software package of SMART APEX II. The crystallographic data, selected bond lengths and bond angles are tabulated in Tables 1 and 2. A total of 26![[thin space (1/6-em)]](https://www.rsc.org/images/entities/char_2009.gif) 495 reflections were measured, out of which 3542 were independent, and 3202 were observed [I > 2σ(I)]. The structure was solved by direct methods using SHELXS-97,9 and refined by full-matrix least-squares refinement methods based on F2 using SHELXL-97. All non-hydrogen atoms were refined anisotropically, and all calculations were performed using WingX Package.10 The important crystal and refinement parameters are given in Table 1. The resulting crystals were found suitable for structural studies.
495 reflections were measured, out of which 3542 were independent, and 3202 were observed [I > 2σ(I)]. The structure was solved by direct methods using SHELXS-97,9 and refined by full-matrix least-squares refinement methods based on F2 using SHELXL-97. All non-hydrogen atoms were refined anisotropically, and all calculations were performed using WingX Package.10 The important crystal and refinement parameters are given in Table 1. The resulting crystals were found suitable for structural studies.
| Empirical Formula | C20H15N4O2 |
| Formula weight | 343.36 |
| Crystal system | Orthorhombic |
| Space group | Pca21 |
| a (Å) | 12.0792(5) |
| b (Å) | 9.1171(4) |
| c (Å) | 15.1341(7) |
| α = β = γ | 90° |
| Volume (Å3) | 1666.68(13) |
| Temperature (K) | 296(2) |
| Z | 4 |
| ρcalc (g cm−3) | 1.368 |
| μ (mm−1) | 0.092 |
| F(000) | 716 |
| θ range (deg) | 2.80–26.78 |
| Reflections collected | 26495 |
| Reflections independent | 3542 |
| Final R indices [I > 2σ(I)] | 3202 |
| R indices (all data) | 0.0302 |
| Goodness-of-fit on F2 | 1.033 |
| Bond length (Å) | |
|---|---|
| C22–N3 | 1.389(2) |
| C23–N3 | 1.3220(18) |
| C23–N2 | 1.3697(19) |
| N2–C11 | 1.386(2) |
| N2–C4 | 1.4570(17) |
| C7–N1 | 1.471(2) |
| Bond angles (°) | |
|---|---|
| N3–C23–N2 | 112.68(13) |
| N3–C23–C3 | 128.21(13) |
| N2–C23–C3 | 119.10(12) |
| C23–N2–C11 | 107.34(11) |
| C23–N2–C4 | 126.13(13) |
| C11–N2–C4 | 126.27(13) |
| N3–C22–C12 | 130.12(14) |
| N3–C22–C11 | 110.30(13) |
| N4–C4–N2 | 108.20(12) |
| N4–C4–C21 | 112.33(12) |
| N2–C4–C21 | 111.87(11) |
Cell preparation and in vitro cellular imaging
Human cervical cancer cells, i.e., HeLa cell lines, were used throughout the study. Cells were cultured in Dulbecco's modified Eagle's medium (DMEM, Gibco BRL) supplemented with 10% FBS (Gibco BRL) and 1% antibiotic mixture containing penicillin, streptomycin and neomycin (PSN, Gibco BRL) at 37 °C in a humidified incubator with 5% CO2. For the experimental study, cells were grown to 80–90% confluence, harvested with 0.025% trypsin (Gibco BRL) and 0.52 mM EDTA (Gibco BRL) in PBS (phosphate-buffered saline, Sigma Diagnostics) and then plated at the desire cell concentration and allowed to re-equilibrate for 24 h before any treatment. Cells were rinsed with PBS and incubated with DMEM-containing L1H or L2H (10 μM, 1% DMSO) for 15 min at 37 °C. All experiments were conducted in DMEM containing 10% FBS and 1% PSN antibiotic mixture. The imaging system was composed of a fluorescence microscope (ZEISS Axioskop 2 plus) with an objective lens [10×].Cell cytotoxicity assay
To test the cytotoxicity of L1H and L2H, MTT [3-(4,5-dimethylthiazol-2-yl)-2,S-diphenyl tetrazolium bromide] assay was performed as per a previously reported procedure.11 After treatments of the probe (5, 10, 25, 50, and 100 μM), 10 μl of MTT solution (10 mg mL−1 PBS) was added in each well of a 96-well culture plate, and incubated at 37 °C for 8 h. All of the mediums were removed from the wells and replaced with 100 μl of acidic isopropanol. The intracellular formazan crystals (blue-violet) formed were solubilized with 0.04 N acidic isopropanol, and the absorbance of the solution was measured at 595 nm with a microplate reader. The data obtained are shown as means ± S.D. of three independent experiments. The cell cytotoxicity was calculated based on a cell viability of 100%.Theoretical calculation
The gradient-corrected DFT level, involving the hybrid 3-parameter fit of exchange and correlation functionals of Becke (B3LYP), which includes the correlation functional of Lee, Yang, and Parr (LYP), was used. The standard split valence basis sets 6-31G(d) and 6-31G(d) were applied for other atoms. Natural population analysis (NPA) (implemented in Gaussian 09 program) at B3LYP/6-31G(d) level was carried out to compute the charge on each atom.Results and discussion
Synthesis and characterization
The organic moieties (L1H and L2H) were synthesized by condensing an ethanolic solution of 2-(2-aminophenyl)-benzimidazole with benzaldehyde derivatives (for L1H, 4-nitrobenzaldehyde and for L2H, 4-methoxybenzaldehyde) in 1![[thin space (1/6-em)]](https://www.rsc.org/images/entities/char_2009.gif) :
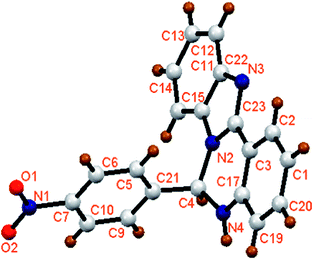
:![[thin space (1/6-em)]](https://www.rsc.org/images/entities/char_2009.gif) 1 mole ratio (Scheme 1). They were characterized by physicochemical and spectroscopic techniques. In addition, the solid state structure of L1H was confirmed by single crystal X-ray crystallography after collecting the single crystals of L1H from the methanolic solution. The molecular view of L1H with atom labeling scheme is shown in Fig. 1, which shows that L1H crystallizes in the orthorhombic space group Pca21. The crystallographic data and bond parameters are tabulated in Tables 1 and 2. The bond distance of C23–N2 (1.3697 Å) is longer than that of C23–N3 (1.3220 Å); however, both these values are significantly shorter than that of C4–N2 (1.4570 Å) or C4–N4 (1.4530 Å).
1 mole ratio (Scheme 1). They were characterized by physicochemical and spectroscopic techniques. In addition, the solid state structure of L1H was confirmed by single crystal X-ray crystallography after collecting the single crystals of L1H from the methanolic solution. The molecular view of L1H with atom labeling scheme is shown in Fig. 1, which shows that L1H crystallizes in the orthorhombic space group Pca21. The crystallographic data and bond parameters are tabulated in Tables 1 and 2. The bond distance of C23–N2 (1.3697 Å) is longer than that of C23–N3 (1.3220 Å); however, both these values are significantly shorter than that of C4–N2 (1.4570 Å) or C4–N4 (1.4530 Å).
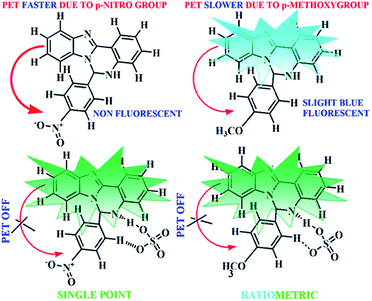
The peaks obtained in 1H NMR spectrum of L1H and L2H have been identified, and they are in accordance with the structural formula of L1H and L2H in the solution state (Fig. S1 and S2†). The ESI mass spectrum of the compound L1H in methanol shows a peak at m/z 443.1480 with 100% abundance, which is assignable to [M + H]+ (calculated value at m/z, 443.12), where M is the molecular weight of L1H (Fig. S3†). The ESI mass spectrum of the compound L2H in methanol shows a peak at m/z 328.1246 with 100% abundance, which is assignable to [M + H]+ (calculated value at m/z, 328.14), where M is the molecular weight of L2H (Fig. S4,†). The IR spectra of L1H and L2H show the characteristic stretching of the N–H and C![[double bond, length as m-dash]](https://www.rsc.org/images/entities/char_e001.gif) N bonds (Fig. S5 and S6†). L1H and L2H undergo non-covalent hydrogen bonding interaction with HSO4− ions, which results in enhancement of the fluorescence intensity (Scheme 2). To establish the mechanism of the formation of the adduct with HSO4− ions, the species, formulated as K[L1H–HSO4] and K[L2H–HSO4], were isolated in solid state from the reaction of one mole potassium hydrogen sulphate with one mole of the organic moiety (L1H or L2H) in methanol under stirring condition. The complexes are soluble in methanol, DMSO, and acetonitrile. The peaks obtained in 1H NMR spectrum of K[L1H–HSO4] and K[L2H–HSO4] have been identified, and they are in accordance with the structural formula of L1H and L2H in the solution state (Fig. S7 and S8†). The ESI mass spectrum of the compound K[L1H–HSO4] in methanol shows a peak at m/z 463.16 and 505.0080 (Fig. S9†), which is assignable to [I2− + 2H + Na]+ and [I2− + K + Na + H]+, respectively, where I2− = L1− + HSO4−. The ESI mass spectrum of the K[L2H–HSO4] in methanol shows a peak at m/z, 447.9254 and 486.2086 (Fig. S10†), which is assignable to [I2 + 2H + Na]+ and [I2− + K + Na + H]+, respectively, where I2− = L2− + HSO4−. The IR spectra of K[L1H–HSO4] and K[L2H–HSO4] show the characteristic stretching of S
N bonds (Fig. S5 and S6†). L1H and L2H undergo non-covalent hydrogen bonding interaction with HSO4− ions, which results in enhancement of the fluorescence intensity (Scheme 2). To establish the mechanism of the formation of the adduct with HSO4− ions, the species, formulated as K[L1H–HSO4] and K[L2H–HSO4], were isolated in solid state from the reaction of one mole potassium hydrogen sulphate with one mole of the organic moiety (L1H or L2H) in methanol under stirring condition. The complexes are soluble in methanol, DMSO, and acetonitrile. The peaks obtained in 1H NMR spectrum of K[L1H–HSO4] and K[L2H–HSO4] have been identified, and they are in accordance with the structural formula of L1H and L2H in the solution state (Fig. S7 and S8†). The ESI mass spectrum of the compound K[L1H–HSO4] in methanol shows a peak at m/z 463.16 and 505.0080 (Fig. S9†), which is assignable to [I2− + 2H + Na]+ and [I2− + K + Na + H]+, respectively, where I2− = L1− + HSO4−. The ESI mass spectrum of the K[L2H–HSO4] in methanol shows a peak at m/z, 447.9254 and 486.2086 (Fig. S10†), which is assignable to [I2 + 2H + Na]+ and [I2− + K + Na + H]+, respectively, where I2− = L2− + HSO4−. The IR spectra of K[L1H–HSO4] and K[L2H–HSO4] show the characteristic stretching of S![[double bond, length as m-dash]](https://www.rsc.org/images/entities/char_e001.gif) O at 1114 and 1111 cm−1, respectively (Fig. S11 and S12†). All these data confirm the composition of K[L1H–HSO4] and K[L2H–HSO4].
O at 1114 and 1111 cm−1, respectively (Fig. S11 and S12†). All these data confirm the composition of K[L1H–HSO4] and K[L2H–HSO4].
1H NMR titration
In order to strengthen the above pathway of bonding of HSO4− ions with the receptors, 1H NMR titration was performed by concomitant addition of HSO4− ions to the DMSO-d6 solution of L1H and L2H (Fig. S13 and S14, ESI†). Significant spectral changes for L1H and L2H were observed upon addition of HSO4− ions. In case of L1H, 5 min after the addition of HSO4− ions, the peaks due to the proton in N–Hi appeared with the peak of Hh proton at δ = 6.884–6.856 ppm (2H, m). It is noteworthy that they were remarkably affected and became equivalent to one hydrogen of Hh due to the disappearance of Hi from N–Hi. Moreover, the multiplet peaks appeared at δ = 7.361–7.337 ppm (2H, m), which is assignable to split up of He and He' protons, as the peak for He shifted downfield due to the bonding of HSO4− ions with He. In case of L2H titration, the peak at 4.401 ppm, due to the proton of N–H, disappeared after HSO4− addition. All other protons of L1H and L2H remained unaffected after interaction with HSO4− ions (Tables S1 and S2, ESI†).Spectral characteristics
![[thin space (1/6-em)]](https://www.rsc.org/images/entities/char_2009.gif) :
:![[thin space (1/6-em)]](https://www.rsc.org/images/entities/char_2009.gif) 1) solvent mixture (Fig. S15 and S16†). Fluorescence quantum yields (F) were estimated by integrating the area under the fluorescence curves with the equation:
1) solvent mixture (Fig. S15 and S16†). Fluorescence quantum yields (F) were estimated by integrating the area under the fluorescence curves with the equation:where A is the area under the fluorescence spectral curve and OD is the optical density of the compound at the excitation wavelength. The standard used for the measurement of fluorescence quantum yield was anthracene (ϕ = 0.29 in ethanol). The emission intensities of the organic molecule in the presence of various concentrations of HSO4− ions were measured. The fluorescence spectrum properties of L1H (25 μM) and L2H (25 μM) were investigated in ethanol–water (1
![[thin space (1/6-em)]](https://www.rsc.org/images/entities/char_2009.gif) :
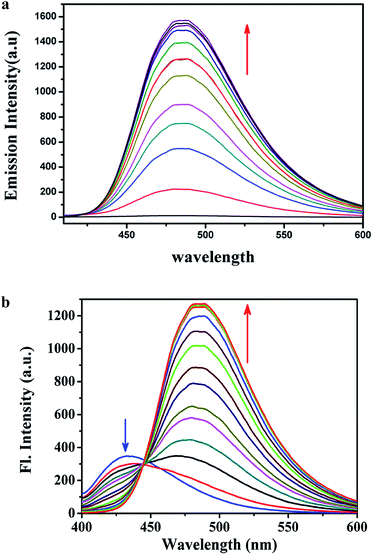
:![[thin space (1/6-em)]](https://www.rsc.org/images/entities/char_2009.gif) 5, v/v) HEPES buffer (0.1 M, pH = 7.4) at 25 °C as a function of added [HSO4−] (Fig. 2a and b). L2H showed a fluorescence of higher intensity at 430 nm. After addition of HSO4− the fluorescence intensity band shows a ratiometric enhancement at 485 nm (Fig. 2b). The ratiometric signaling of fluorescence output at two different wavelengths plotted as a function of concentration of HSO4− indicates that the fluorescence intensity ratio at wavelengths 485 nm and 430 nm (I485/I430) gradually increases with increase in the concentration of HSO4− ions (Fig. S17†), and after a certain time it levels up to produce a sigmoidal curve. Note that the fluorescence emission band of L1H at 485 nm is very weak at room temperature. Addition of HSO4− (25 μM) to L1H (25 μM) in HEPES buffer solution at pH 7.4 afforded a 120 times single point enhancement in fluorescence intensity (Fig. 2a). In the absence of HSO4− anion, the fluorescence intensity of L1H is very low. However, in presence of HSO4−, fluorescence intensity greatly increased due to bonding interaction between the deprotonated N− atom (as pKa of NH ≈ 6.9, resulting experimental pH of the medium) of imidazole moiety with the proton of the added HSO4− ion. This is also supported by the computational study of the probes (L1H and L2H) and their corresponding adducts with HSO4− (Fig. S18 and S19†). The computational study indicates that the closeness of the HSO4− ion with L1H is to a great extent comparable to that of the HSO4− ion with L2H as the theoretical bond distances of CH⋯O (of HSO4−) (2.258 Å) and N⋯H (of HSO4−) (1.898 Å) in [L1H–HSO4]− adducts are shorter than those of CH⋯O (of HSO4−) (2.371 Å) and N⋯H (of HSO4) (1.958 Å) in [L2H–HSO4]− adducts. The electronic effect of the substituents (–NO2 in L1H and –OMe in L2H) present in the para-position of the phenyl ring plays the key role in the tuning of the fluorescence signaling from single point response to ratiometric response.
5, v/v) HEPES buffer (0.1 M, pH = 7.4) at 25 °C as a function of added [HSO4−] (Fig. 2a and b). L2H showed a fluorescence of higher intensity at 430 nm. After addition of HSO4− the fluorescence intensity band shows a ratiometric enhancement at 485 nm (Fig. 2b). The ratiometric signaling of fluorescence output at two different wavelengths plotted as a function of concentration of HSO4− indicates that the fluorescence intensity ratio at wavelengths 485 nm and 430 nm (I485/I430) gradually increases with increase in the concentration of HSO4− ions (Fig. S17†), and after a certain time it levels up to produce a sigmoidal curve. Note that the fluorescence emission band of L1H at 485 nm is very weak at room temperature. Addition of HSO4− (25 μM) to L1H (25 μM) in HEPES buffer solution at pH 7.4 afforded a 120 times single point enhancement in fluorescence intensity (Fig. 2a). In the absence of HSO4− anion, the fluorescence intensity of L1H is very low. However, in presence of HSO4−, fluorescence intensity greatly increased due to bonding interaction between the deprotonated N− atom (as pKa of NH ≈ 6.9, resulting experimental pH of the medium) of imidazole moiety with the proton of the added HSO4− ion. This is also supported by the computational study of the probes (L1H and L2H) and their corresponding adducts with HSO4− (Fig. S18 and S19†). The computational study indicates that the closeness of the HSO4− ion with L1H is to a great extent comparable to that of the HSO4− ion with L2H as the theoretical bond distances of CH⋯O (of HSO4−) (2.258 Å) and N⋯H (of HSO4−) (1.898 Å) in [L1H–HSO4]− adducts are shorter than those of CH⋯O (of HSO4−) (2.371 Å) and N⋯H (of HSO4) (1.958 Å) in [L2H–HSO4]− adducts. The electronic effect of the substituents (–NO2 in L1H and –OMe in L2H) present in the para-position of the phenyl ring plays the key role in the tuning of the fluorescence signaling from single point response to ratiometric response.
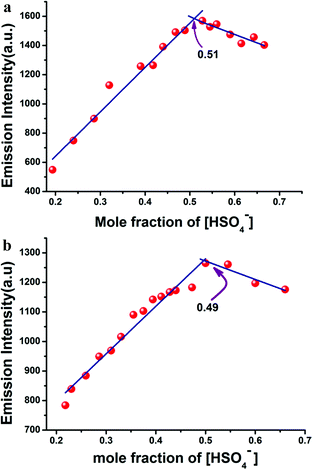
There was almost no interference for the detection of HSO4− in the presence of 100 equivalents of tetrabutylammonium salt of chloride, bromide, iodide and acetate; sodium salt of azide, sulphide, and cyanide; dihydrogen phosphate; dihydrogen arsenate; and potassium salt of nitrate and sulphate. Job's plot analysis (Fig. 3a and b) revealed that L1H and L2H both bonded with HSO4− ions to form the adducts in 1![[thin space (1/6-em)]](https://www.rsc.org/images/entities/char_2009.gif) :
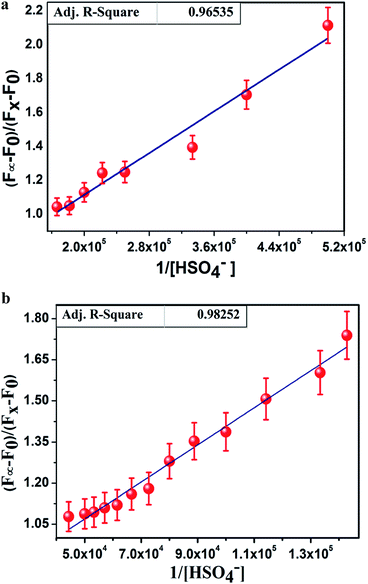
:![[thin space (1/6-em)]](https://www.rsc.org/images/entities/char_2009.gif) 1 molar ratio. The binding constant values, calculated from the emission intensity data, were found to be 3.25 × 10⁵ M−1/2 for L1H and 1.48 × 10⁵ for L2H (Fig. 4a and b) using the modified Benesi–Hildebrand equation:12,13
1 molar ratio. The binding constant values, calculated from the emission intensity data, were found to be 3.25 × 10⁵ M−1/2 for L1H and 1.48 × 10⁵ for L2H (Fig. 4a and b) using the modified Benesi–Hildebrand equation:12,13
| 1/(Fx − F0) = 1/(Fmax − F0) + (1/K[C])(1/(Fmax − F0) |
![[thin space (1/6-em)]](https://www.rsc.org/images/entities/char_2009.gif) :
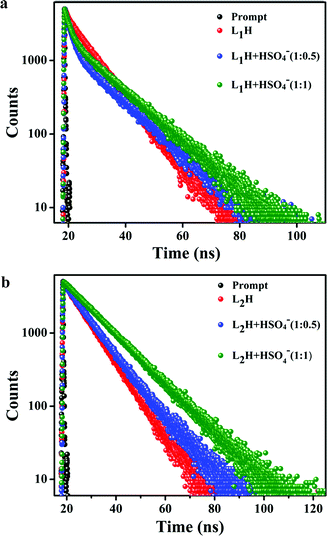
:![[thin space (1/6-em)]](https://www.rsc.org/images/entities/char_2009.gif) 1) medium indicates the gradual increase with increase in [HSO4−] (Fig. 5a and b). The average lifetimes are calculated to be 8.32 ns for L1H, 9.42 ns for the mixture of L1H
1) medium indicates the gradual increase with increase in [HSO4−] (Fig. 5a and b). The average lifetimes are calculated to be 8.32 ns for L1H, 9.42 ns for the mixture of L1H![[thin space (1/6-em)]](https://www.rsc.org/images/entities/char_2009.gif) :
:![[thin space (1/6-em)]](https://www.rsc.org/images/entities/char_2009.gif) HSO4− (1
HSO4− (1![[thin space (1/6-em)]](https://www.rsc.org/images/entities/char_2009.gif) :
:![[thin space (1/6-em)]](https://www.rsc.org/images/entities/char_2009.gif) 0.5) and 10.75 ns for the mixture of L1H
0.5) and 10.75 ns for the mixture of L1H![[thin space (1/6-em)]](https://www.rsc.org/images/entities/char_2009.gif) :
:![[thin space (1/6-em)]](https://www.rsc.org/images/entities/char_2009.gif) HSO4− in 1
HSO4− in 1![[thin space (1/6-em)]](https://www.rsc.org/images/entities/char_2009.gif) :
:![[thin space (1/6-em)]](https://www.rsc.org/images/entities/char_2009.gif) 1 molar ratio. The average lifetime for L2H is 8.26 ns for L2H
1 molar ratio. The average lifetime for L2H is 8.26 ns for L2H![[thin space (1/6-em)]](https://www.rsc.org/images/entities/char_2009.gif) :
:![[thin space (1/6-em)]](https://www.rsc.org/images/entities/char_2009.gif) HSO4− (1
HSO4− (1![[thin space (1/6-em)]](https://www.rsc.org/images/entities/char_2009.gif) :
:![[thin space (1/6-em)]](https://www.rsc.org/images/entities/char_2009.gif) 0.5) is 8.58 ns and in case of L2H
0.5) is 8.58 ns and in case of L2H![[thin space (1/6-em)]](https://www.rsc.org/images/entities/char_2009.gif) :
:![[thin space (1/6-em)]](https://www.rsc.org/images/entities/char_2009.gif) HSO4− (1
HSO4− (1![[thin space (1/6-em)]](https://www.rsc.org/images/entities/char_2009.gif) :
:![[thin space (1/6-em)]](https://www.rsc.org/images/entities/char_2009.gif) 1), is 11.79 ns. The strong binding of HSO4− ions with organic moiety is also due to the binding constant value. According to the equations: τ −1 = kr + knr and kr = Φf/τ,14 the radiative rate constant kr and total non-radiative rate constant knr of the organic moieties (L1H, L2H), K[L1H–HSO4], and K[L2H–HSO4] were listed in Tables S3 and S4.† The data suggest that the fluorescent enhancement is ascribed to the decrease in ratio of knr/kr from 181.40 for L1H to 1.8 for K[L1H–HSO4], and from 14.4 for L2H to 1.0839 for K[L2H–HSO4].
1), is 11.79 ns. The strong binding of HSO4− ions with organic moiety is also due to the binding constant value. According to the equations: τ −1 = kr + knr and kr = Φf/τ,14 the radiative rate constant kr and total non-radiative rate constant knr of the organic moieties (L1H, L2H), K[L1H–HSO4], and K[L2H–HSO4] were listed in Tables S3 and S4.† The data suggest that the fluorescent enhancement is ascribed to the decrease in ratio of knr/kr from 181.40 for L1H to 1.8 for K[L1H–HSO4], and from 14.4 for L2H to 1.0839 for K[L2H–HSO4].
![[thin space (1/6-em)]](https://www.rsc.org/images/entities/char_2009.gif) :
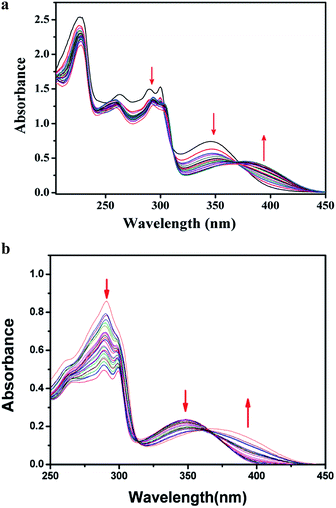
:![[thin space (1/6-em)]](https://www.rsc.org/images/entities/char_2009.gif) 5, v/v) in HEPES buffer (0.1 M, pH 7.4) at 25 °C, the peak at 346 nm gradually decreased, and a new peak around 390 nm was generated through an isosbestic point at 364 nm (Fig. 6a) due to the formation of a complex of the receptor with HSO4− ion in the solution state. Similarly, UV-Vis spectrum of L2H showed the characteristic absorption bands at 225 nm, 291 nm, and 350 nm. In a similar type of titration, by addition of the solution of HSO4− ion to the colourless solution of L2H in ethanol–water (1
5, v/v) in HEPES buffer (0.1 M, pH 7.4) at 25 °C, the peak at 346 nm gradually decreased, and a new peak around 390 nm was generated through an isosbestic point at 364 nm (Fig. 6a) due to the formation of a complex of the receptor with HSO4− ion in the solution state. Similarly, UV-Vis spectrum of L2H showed the characteristic absorption bands at 225 nm, 291 nm, and 350 nm. In a similar type of titration, by addition of the solution of HSO4− ion to the colourless solution of L2H in ethanol–water (1![[thin space (1/6-em)]](https://www.rsc.org/images/entities/char_2009.gif) :
:![[thin space (1/6-em)]](https://www.rsc.org/images/entities/char_2009.gif) 5, v/v) in HEPES buffer (0.1 M, pH 7.4) at 25 °C, the peak at 350 nm was red-shifted to a new peak at 390 nm (Fig. 6b) through an isosbestic point at 365 nm due to the formation of an adduct of [L2H–HSO4]− in the solution state.
5, v/v) in HEPES buffer (0.1 M, pH 7.4) at 25 °C, the peak at 350 nm was red-shifted to a new peak at 390 nm (Fig. 6b) through an isosbestic point at 365 nm due to the formation of an adduct of [L2H–HSO4]− in the solution state.
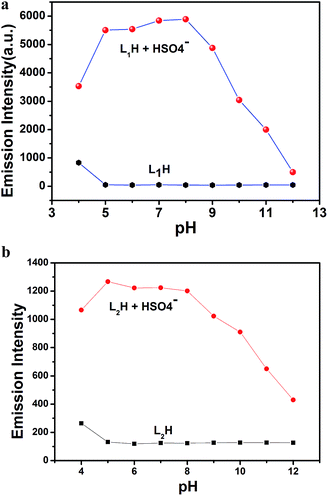
![[thin space (1/6-em)]](https://www.rsc.org/images/entities/char_2009.gif) :
:![[thin space (1/6-em)]](https://www.rsc.org/images/entities/char_2009.gif) 5, v/v) HEPES buffer (0.1 M) at 25 °C.
5, v/v) HEPES buffer (0.1 M) at 25 °C.
Conclusion
In conclusion, two new 2-(2-aminophenyl)benzimidazol-based HSO4− ion-selective receptors (L1H and L2H), and their 1![[thin space (1/6-em)]](https://www.rsc.org/images/entities/char_2009.gif) :
:![[thin space (1/6-em)]](https://www.rsc.org/images/entities/char_2009.gif) 1 molecular adducts with HSO4− were synthesized and characterized using physicochemical and spectroscopic techniques along with single crystal X-ray crystallography of L1H for detailed structural analysis. Both receptors (L1H and L2H) behave as highly selective fluorescent sensor for HSO4− ions at biological pH in green solvent than other anions by the naked eye. Here, the new receptors (L1H and L2H) have the same environments to accept the guest (HSO4− ions), but the emission efficiency of the receptors has been tuned successfully through single point to ratiometric detection in green solvent by exploiting substituent effects (−R effect of –NO2 group, and +R effect of OMe group) within the receptors. The limit of detection for HSO4− ions (by 3σ method) were calculated to be 18.08 nM and 14.11 nM for L1H and L2H, respectively. Both probes could be used as biomarkers for the detection of intracellular HSO4− ions in HeLa cells as they are both non-cytotoxic agents. However, L2H is a better candidate compared to L1H for acquiring the fluorescence image (Fig. 9), although they have the same receptor environments for the HSO4− ions. From this study, it may be concluded that substituents present in the appropriate position of the receptor control the mode of signaling (ratiometric or single point) of the sensor, and the ratiometric signaling is better than the single point signaling as expected.
1 molecular adducts with HSO4− were synthesized and characterized using physicochemical and spectroscopic techniques along with single crystal X-ray crystallography of L1H for detailed structural analysis. Both receptors (L1H and L2H) behave as highly selective fluorescent sensor for HSO4− ions at biological pH in green solvent than other anions by the naked eye. Here, the new receptors (L1H and L2H) have the same environments to accept the guest (HSO4− ions), but the emission efficiency of the receptors has been tuned successfully through single point to ratiometric detection in green solvent by exploiting substituent effects (−R effect of –NO2 group, and +R effect of OMe group) within the receptors. The limit of detection for HSO4− ions (by 3σ method) were calculated to be 18.08 nM and 14.11 nM for L1H and L2H, respectively. Both probes could be used as biomarkers for the detection of intracellular HSO4− ions in HeLa cells as they are both non-cytotoxic agents. However, L2H is a better candidate compared to L1H for acquiring the fluorescence image (Fig. 9), although they have the same receptor environments for the HSO4− ions. From this study, it may be concluded that substituents present in the appropriate position of the receptor control the mode of signaling (ratiometric or single point) of the sensor, and the ratiometric signaling is better than the single point signaling as expected.
Acknowledgements
Financial assistance from CSIR, New Delhi, India is gratefully acknowledged. M. Mukherjee wishes to thank to UGC, New Delhi, India for offering the fellowship. The authors are grateful to USIC, The University of Burdwan, for the single crystal X-ray diffractometer facility under PURSE program. We sincerely acknowledge Prof. Samita Basu and Mr Ajay Das, Chemical Science Division, SINP, Kolkata for enabling TCSPC instrument and Prof. B. Mukhopadhyay, IISER, Kolkata to record some 1H NMR spectra and ESI Mass Spectra.Notes and references
- (a) F. P. Schmidtchen and M. Berger, Chem. Rev., 1997, 97, 1609 CrossRef CAS PubMed; (b) P. D. Beer, A. R. Graydon, A. O. M. Johnson and D. K. Smith, Inorg. Chem., 1997, 36, 2112 CrossRef CAS PubMed; (c) P. A. Gale, Coord. Chem. Rev., 2003, 240, 191 CrossRef CAS; (d) M. M. G. Antonisse and D. N. Reinhoudt, Chem. Commun., 1998, 443 RSC; (e) E. V. Anslyn and T. S. Snowden, Curr. Opin. Chem. Biol., 1999, 3, 740 CrossRef; (f) P. D. Beer and P. A. Gale, Angew. Chem., Int. Ed., 2001, 40, 486 CrossRef CAS; (g) S. Y. Kim and J. I. Hong, Org. Lett., 2007, 9, 3109 CrossRef CAS PubMed; (h) M. J. Chmielewski and J. Jurczak, Chem.–Eur. J., 2005, 11, 6080 CrossRef CAS PubMed; (i) T. Gunnlaugsson, M. Glynn, G. M. Tocci, P. E. Kruger and F. M. Pfeffer, Coord. Chem. Rev., 2006, 250, 3094 CrossRef CAS PubMed; (j) P. D. Beer and P. A. Gale, Angew. Chem., 2001, 113, 502 (Angew. Chem., Int. Ed., 2001, 40, 486) CrossRef; (k) L. Fabbrizzi, M. Licchelli, G. Rabaioli and A. Taglietti, Coord. Chem. Rev., 2000, 205, 85 CrossRef CAS; (l) E. J. O'Neil and B. D. Smith, Coord. Chem. Rev., 2006, 250, 3068 CrossRef PubMed; (m) M. E. Moragues, R. Martınez-Manez and F. Sancenon, Chem. Soc. Rev., 2011, 40, 2593 RSC; (n) A. F. Li, J. H. Wang, F. Wang and Y. B. Jiang, Chem. Soc. Rev., 2010, 39, 3729 RSC; (o) R. M. Duke, E. B. Veale, F. M. Pfeffer, P. E. Kruger and T. Gunnlaugsson, Chem. Soc. Rev., 2010, 39, 3936 RSC; (p) P. A. Gale, Chem. Soc. Rev., 2010, 39, 3746 RSC; (q) P. A. Gale, Acc. Chem. Res., 2006, 39, 465 CrossRef CAS PubMed; (r) J. L. Sessler, P. A. Gale and W. S. Cho, in Anion Receptor Chemistry (Monographs in Supramolecular Chemistry), ed. J. F. Stoddart, RSC, Cambridge, 2006 Search PubMed.
- (a) S. E. Matthews and P. D. Beer, Supramol. Chem., 2005, 27917, 411 CrossRef; (b) Y. Michigami, Y. Kuroda, K. Ueda and Y. Yamamoto, Anal. Chim. Acta, 1993, 274, 299 CrossRef CAS; (c) T. Y. Joo, N. Singh, G. W. Lee and D. O. Jiang, Tetrahedron Lett., 2007, 48, 8846 CrossRef CAS PubMed; (d) P. Chakrabarti, J. Mol. Biol., 1993, 234, 463 CrossRef CAS PubMed; (e) C. Tan, Q. Wang and L. Ma, Photochem. Photobiol., 2010, 86, 1191 CrossRef CAS PubMed; (f) L. Basabe-Desmonts, D. N. Reinhoudt and M. Crego-Calama, Integrated Analytical Systems, 2009, vol. 2, p. 81 Search PubMed; (g) R. A. Potyrailo and V. M. Mirsky, Combinatorial Methods for Chemical and Biological Sensors, Springer, 2009 Search PubMed.
- (a) A. P. Davis, D. N. Sheppard and B. D. Smith, Chem. Soc. Rev., 2007, 36, 348 RSC; (b) V. Gorteau, G. Bollot, J. Mareda, A. Perez-Velasco and S. Matile, J. Am. Chem. Soc., 2006, 128, 14788 CrossRef CAS PubMed; (c) F. M. Ashcroft, Ion Channels and Disease Channelopathies, Academic Press, San Diego, 2000 Search PubMed.
- (a) M. J. Welsh, B. W. Ramsey, F. Accurso, G. R. Cutting, Cystic fibrosis, in The Metabolic and Molecular Bases of Inherited Disease, ed. C. R. Scriver, A. L. Beaudet, W. S. Sly and D. Valle, McGraw-Hill, New York, 8th edn, 2001, pp. 5121–5241 Search PubMed; (b) T. J. Jentsch, C. A. Hubner and J. C. Fuhrmann, Nat. Cell Biol., 2004, 6, 1039 CrossRef CAS PubMed; (c) T. J. Jentsch, T. Maritzen and A. A. Zdebik, J. Clin. Invest., 2005, 115, 2039 CrossRef CAS PubMed.
- (a) B. A. Moyer, L. H. Delmau, C. J. Fowler, A. Ruas, D. A. Bostick, J. L. Sessler, E. Katayeu, G. D. Pantos, J. M. Llinares, M. A. Hossain, S. O. Kang and K. Bowman-James, in Advances in Inorganic Chemistry, ed. R. V. Eldik and K. Bowman-James, Academic Press, New York, 2006, p. 175 Search PubMed; (b) P. I. Jalava, R. O. Salonen, A. S. Pennanen, M. S. Happo, P. Penttinen, A. I. Halinen, M. Sillanpaa, R. Hillamo and M. R. Hirvonen, Toxicol. Appl. Pharmacol., 2008, 229, 146 CrossRef CAS PubMed.
- B. Sen, M. Mukherjee, S. Pal, S. K. Mandal, M. S. Hundal, A. R. Khuda-Bukhsh and P. Chattopadhyay, RSC Adv., 2014, 4, 15356 RSC and references therein.
- (a) E. B. Veale and T. Gunnlaugsson, Annu. Rep. Prog. Chem., Sect. B: Org. Chem., 2010, 106, 376 RSC; (b) M. E. Moragues, R. Martinez-Manez and F. Sancenon, Chem. Soc. Rev., 2011, 40, 2593 RSC; (c) C. H. Lee, H. Miyaji, D. W. Yoon and J. L. Sessler, Chem. Commun., 2008, 24 RSC; (d) T. Gunnlaugsson, M. Glynn, G. M. Tocci, P. E. Kruger and F. M. Pfeffer, Coord. Chem. Rev., 2006, 250, 3094 CrossRef CAS PubMed; (e) R. Martinez-Manez and F. Sancanon, Chem. Rev., 2003, 103, 4419 CrossRef CAS PubMed; (f) J. F. Callan, A. P. de Silva and D. C. Magri, Tetrahedron, 2005, 61, 8551 CrossRef CAS PubMed; (g) J. Zhao, T. M. Fyles and T. D. James, Angew. Chem., Int. Ed., 2004, 43, 3461 CrossRef CAS PubMed; (h) P. A. Gale, Acc. Chem. Res., 2006, 39, 465 CrossRef CAS PubMed; (i) S. K. Kim, D. H. Lee, J. I. Hong and J. Yoon, Acc. Chem. Res., 2009, 42, 23 CrossRef CAS PubMed; (j) X. Huang, Z. Guo, W. Zhu, Y. Xie and H. Tian, Chem. Commun., 2008, 5143 RSC; (k) Z. Yang, K. Zhang, F. Gong, S. Li, J. Chen, J. S. Ma, L. N. Sobenina, A. I. Mikhaleva, G. Yang and B. A. Trofimov, Beilstein J. Org. Chem., 2011, 7, 46 CrossRef CAS PubMed.
- (a) Z. Xu, Y. Xiao, X. Qian, J. Cui and D. Cui, Org. Lett., 2005, 7, 889 CrossRef CAS PubMed; (b) B. Valeur and I. Leray, Coord. Chem. Rev., 2000, 205, 3 CrossRef CAS; (c) S. Sen, S. Sarkar, B. Chattopadhyay, A. Moirangthem, A. Basu, K. Dhara and P. Chattopadhyay, Analyst, 2012, 137, 3335 RSC.
- A. Altomare, G. Cascarano, C. Giacovazzo and A. Guagliardi, J. Appl. Crystallogr., 1993, 26, 343 CrossRef.
- L. J. Farrugia, J. Appl. Crystallogr., 1999, 32, 837 CrossRef CAS.
- (a) S. Banerjee, P. Prasad, A. Hussain, I. Khan, P. Kondaiah and A. R. Chakravarty, Chem. Commun., 2012, 48, 7702 RSC; (b) T. Mosmann, J. Immunol. Methods, 1983, 65, 55 CrossRef CAS.
- A. Mallick and N. Chattopadhyay, Photochem. Photobiol., 2005, 81, 419 CrossRef CAS.
- H. A. Benesi and J. H. Hildebrand, J. Am. Chem. Soc., 1949, 71, 2703 CrossRef CAS.
- N. J. Turro, Modern Molecular Photochemistry, Benjamin/Cummings Publishing Co., Inc., Menlo Park, CA, 1978, p. 246 Search PubMed.
- (a) A. Hakonen, Anal. Chem., 2009, 81, 4555 CrossRef CAS PubMed; (b) S. Pal, B. Sen, M. Mukherjee, K. Dhara, E. Zangrando, S. K. Mandal, A. R. Khuda-Bukhsh and P. Chattopadhyay, Analyst, 2014, 139, 1628 RSC.
Footnote |
| † Electronic supplementary information (ESI) available. CCDC 968396. For ESI and crystallographic data in CIF or other electronic format see DOI: 10.1039/c4ra03551h |
| This journal is © The Royal Society of Chemistry 2014 |

