Extended petroleum hydrocarbon bioremediation in saline soil using Pt-free multianodes microbial fuel cells†
Xiaojing Li,
Xin Wang*,
Yueyong Zhang,
Lijuan Cheng,
Jie Liu,
Fan Li,
Bingli Gao and
Qixing Zhou*
MOE Key Laboratory of Pollution Processes and Environmental Criteria, Tianjin Key Laboratory of Environmental Remediation and Pollution Control, College of Environmental Science and Engineering, Nankai University, No. 94 Weijin Road, Nankai District, Tianjin 300071, China. E-mail: zhouqx@nankai.edu.cn; xinwang1@nankai.edu.cn; Fax: +86 22 23501117; Tel: +86 22 23507800
First published on 3rd November 2014
Abstract
Bioelectrochemical remediation is an emerging technology for in situ removal of petroleum hydrocarbons in soil. Here we demonstrated that the remediation can be extended to a larger range by adding multilayer anodes in contaminated soils. Using a three anodes system with activated carbon as the cathodic catalyst, 918 C of charge transferred during 180 days in aged saline soil. The degradation of both polycyclic aromatic hydrocarbons (PAHs) and n-alkanes were accelerated in each layer compared to the disconnected control. The net degradation rates of total petroleum hydrocarbons, 16 priority PAHs and total n-alkanes (C8–C40) were 18%, 36% and 29%, respectively. Popular exoelectrogens (such as Geobacteraceae sp.) and Escherichia were identified, which possibly played an important role in this bioelectrochemical process.
Introduction
Petroleum is one of the dominant energy sources promoting the economic and social development of a country. However, large amounts of petroleum hydrocarbons have leaked into the environment during the exploration, extraction, refining, transportation and processing.1 Many countries and regions are suffering from the ecological risk from soil contamination by petroleum hydrocarbons.2,3 The regular remediation approaches for petroleum contamination in soil mainly include physical, chemical and biological technologies.4 Since the physical and chemical remediations are usually expensive and might cause secondary pollution,5 bioremediation, including bioaugmentation and biostimulation, is a green and cost-effective technology.Different from the common biotechnologies, the microbial fuel cell (MFC) is a new technology that can be used to remove organic pollutants through the bio-generated current to remediate water,6–8 sediment9–11 or soil.12,13 Since the electron acceptor is non-exhaustible and passively applied, the air-cathode MFC has its advantage in potential use in real remediation. Our early studies showed that the degradation rate of total petroleum hydrocarbon (TPH) had been enhanced by 120% in soil close to the anode (<1 cm) at water saturated conditions (33% moisture content).13 The maximum degradation rates of C8–C40 and 16 polycyclic aromatic hydrocarbons (PAHs) reached 79% and 42% respectively, with charge output of 125 ± 7 C at the end of the experiment (25 days, with additional nutrient amendment).13
Previous reports indicated that the degradation rates of hydrocarbons decreased with the increase in distance to the anode using sandwiched anode–separator–cathode systems and 1 cm of distance was optimal.13,14 In these systems, the areas of anode and cathode are nearly the same. It should be noted that the maximum current density of soil MFCs (∼80 mA m−2, 1000 Ω) was 10 times lower than those of MFCs (∼800 mA m−2, 1000 Ω) used in water,15 indicating that the cathode with a fixed area can afford a much larger anode in soil than in water. To extend the anode in soil and test the possibility of long range bioremediation, in this study, anodes were inserted in parallel with different distances from the air-cathode in petroleum hydrocarbon contaminated soil. The characteristics and the degradation rates of C8–C40 and 16 PAHs as well as bacterial communities in soils were investigated. Furthermore, Pt was substituted by activated carbon (AC) as the cathodic catalyst in soil MFCs for bioremediation.
Results and discussion
Performance of SMFC
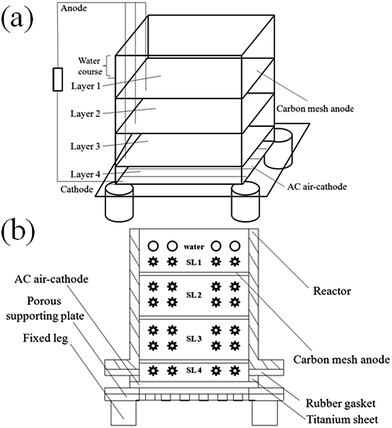
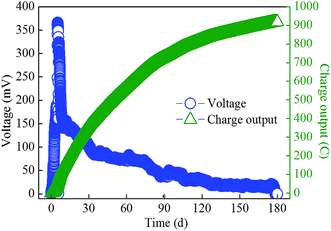
For each SMFC (Fig. 1), three anodes were inserted in parallel with distances of 1, 3 and 5 cm to the cathode since the degradation of hydrocarbons in soils less than 1 cm to the anode can be accelerated.13 After filling soil into the SMFC with multilayer anodes, the voltage initially increased and then decreased throughout the experimental period (Fig. 2). The maximum power density of 37 mW m−2 (366 mV, 102 mA m−2, across 1000 Ω resistor) was achieved on day 5, with a comparable value to that previously reported (39 mW m−2, across 100 Ω resistor using Pt/C cathode).14 The voltage exhibited a sharp decline during 6–10 days, probably due to the depletion of easily degraded substrate.16 The voltage then slowly decreased until the end of the experiment, which can be attributed to the degradation of relatively recalcitrant compounds (such as PAHs). Over the tested period (about 180 days), the accumulated charge reached 918 C (Fig. 2), with a value 7 times higher than our previous result, indicating that the extension of the anode enabled the SMFC to collect electrons from a larger area of soil. The average charge output rate during 180 days was 5.1 C per day, which was consistent with that (5 C per day, using Pt catalyst) previously reported by us in a much shorter period (25 days).13Changes in characteristics of soils
In the connected SMFC, the soil pH gradually increased with the decrease in distance to the air-cathode (Fig. S1a†). The highest pH of 9.28 ± 0.01 was observed in the SL4, which was 12% higher than 8.26 ± 0.12 in the disconnected control (here we marked it as natural attenuation, NA). In the connected SMFC, the pH of SL3 (9.02 ± 0), SL2 (9.02 ± 0.04) and SL1 (8.92 ± 0.07) were 9%, 9% and 8% higher than that of the NA. The pH of mixed soil from four layers (mixed) also increased by 0.85 unit compared to NA. The increase of pH can be attributed to the accumulation of hydroxyl close to the air-cathode17 or bicarbonate accumulation resulting from biodegradation of hydrocarbon.14 Such alkaline conditions could enhance the bioavailability of hydrocarbon and thus facilitate electricity generation with simultaneous pollutant removal.18The increase of soil pH may incur a precipitation of some metal ions (such as Ca2+ and Mg2+) and restrict the transport of ions. As evidence, the soil conductivity, a parameter showing the soluble ions that can be freely transferred in soil cracks, decreased from SL1 to SL3 except for SL4 (Fig. S1b†). The obvious increase in conductivity at SL4 can result from the water evaporation through the air-cathode so that the supplementary downward flow carries ions so that these ions accumulated at the bottom of the reactor (SL4). Compared to the NA, the conductivity of mixed soils from all layers decreased by 16%, probably due to the increase in soil pH as interpreted above.
Degradation of petroleum hydrocarbons
The concentrations of TPHs in each layer were analyzed after 180 days. As shown in Fig. S2,† the net degradation rates of TPH decreased as follows: SL4 (18 ± 0.4%) > SL1 (13 ± 0.2%) > SL2 (10 ± 0.0%) > SL3 (8 ± 0.2%). The net degradation rate of TPH in mixed soil (SL1 to SL4) was only 12 ± 0.0% because we used an aged petroleum hydrocarbon contaminated soil (see below)19 with a high salinity.20The dominant PAHs were phenanthrene (Phe, C14), fluoranthene (Flu, C16), pyrene (Pyr, C16) and chrysene (Chr, C18), accounting for 72% of total PAHs in NA (Fig. 3a). The net degradation rates of PAHs ranged from 20% to 72% except Chr at 7%, fluorene (Fln, C13) at 4%, dibenz[a,h]anthracene (DahA, C22) at −10% and benzo[g,h,i]perylene (BghiP, C22) at −3%. The net degradation rate of total PAHs (sum of 16 PAHs) in mixed soil was 27 ± 4% with the values decreased from 5653 to 4146 ng g−1, where the degradation of three dominant PAHs accounted for 70%. The total PAHs net degradation rates in each layer decreased as: SL4 (36 ± 9%) > SL1 (27 ± 7%) > SL2 (19 ± 5%) > SL3 (14 ± 4%), following a similar trend as the net degradation rates of TPHs (Fig. 3b).
 | ||
| Fig. 3 Contents and net degradation rates of PAHs in soils from natural attenuation (NA, disconnected control) and the closed circuit (CC) reactors (a) and contents of PAHs in each layer of CC (b). | ||
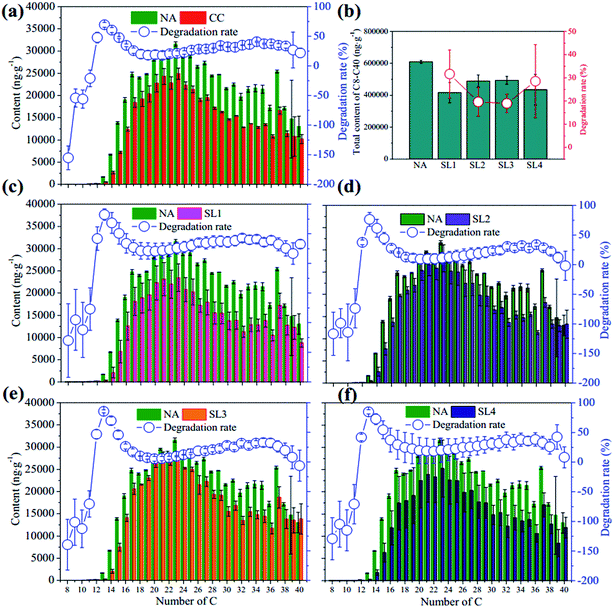
Dominant components of n-alkanes (C8–C40) dropped in the range of C16–C38 (Fig. 4), suggesting that the petroleum hydrocarbons in this soil were well aged, which was also demonstrated by the considerable contents of pristane (30 μg g−1) and phytane (169 μg g−1) in NA. The concentration of total n-alkanes (sum of C8–C40) in mixed soils decreased by 29 ± 5% from 609 to 434 μg g−1. The highest degradation rates were all obtained on C13 (the first peak in Fig. 4) in both mixed and layered soils, with the highest value of 85 ± 3% observed in SL3. The other peak of net degradation rate reached 33–41% on C34–C36 (Fig. 4). The net degradation rates of C8–C40 in layered soils were SL1 (32 ± 10%) > SL4 (29 ± 15%) > SL2 (20 ± 6%) > SL3 (19 ± 3%), showing a partly similar trend as those of TPHs. Differently, the highest degradation rate was observed in the layer close to the air-cathode (SL4), probably due to the increased bioavailability of n-alkanes with the high pH.
 | ||
| Fig. 4 Contents and net degradation rates of n-alkanes in NA and closed circuit reactors (a) and each layer of CC (b–f). | ||
Microbial communities
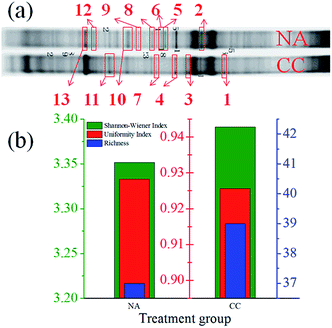
As showed by DGGE profiles of the disconnected control (NA) and SMFC operated at 1000 Ω (CC) over 180 days, the internal and outside charge transfer in SMFCs affected the microbial community (Fig. 5). Bands 1, 3 and 12 were present in CC but poorly visible in NA, while bands 5 and 6 were only noticed in NA. Moreover, both the Shannon–Wiener index (H) and richness (S) of CC (3.39 and 39) were higher than those of NA (3.35 and 37, Fig. 5b), indicating the microbial community in soil was indeed stimulated by the current. However, the uniformity index (EH) of CC showed a slightly low value of 0.926 compared to 0.928 of NA, indicating a selective enrichment of specific communities.14 The results of clone sequencing exhibited that the majority of the amplified clones derived from the SMFC belong to γ-Proteobacteria14,21 (Table 1). Alcanivorax sp. was detected in band 13 as a hydrocarbon degradation bacteria, which was obviously enhanced in SMFC by the stimulation of bio-generated current, indicating that the bioelectricity has a solid contribution on stimulating the growth of hydrocarbon degradation bacteria. Furthermore, two species of Firmicutes (band 3 and 4) that are potentially associated with hydrocarbon degradation were also observed in both NA and CC.14 Uncultured Geobacteraceae sp. in band 2 was the possible exoelectrogenic bacteria in this system.22 Several species of Escherichia sp. were found in soil samples. These bacteria could play an important role in electron transfer between the electrode and the microbial community in soil (such as producing soluble excretions).23,24 The real functions of these bacteria should be confirmed by defined binary culture in the future.| Band | Accession | Name | Organism | Similarity |
|---|---|---|---|---|
| 1 | CP007391 | Escherichia coli | Proteobacteria, Gammaproteobacteria, Enterobacteriales, Enterobacteriaceae | 100% |
| 2 | EF668606 | Geobacteraceae sp. | Proteobacteria, Deltaproteobacteria, Desulfuromonadales | 98% |
| 3 | FJ440032 | UF-1 | Uncultured bacterium (Firmicutes, environmental sample) | 98% |
| 4 | FN548084 | UF-2 | Uncultured bacterium (Firmicutes, environmental sample) | 97% |
| 5 | JN221495 | Escherichia sp. | Proteobacteria, Gammaproteobacteria, Enterobacteriales, Enterobacteriaceae | 100% |
| 6 | CP001383 | Shigella | Proteobacteria, Gammaproteobacteria, Enterobacteriales, Enterobacteriaceae | 99% |
| 7 | JF344166 | UG-1 | Proteobacteria, Gammaproteobacteria | 96% |
| 8 | KF767890 | Escherichia sp. | Proteobacteria, Gammaproteobacteria, Enterobacteriales, Enterobacteriaceae | 99% |
| 9 | GU477928 | UR-1 | Uncultured bacterium (RDX degrading microorganisms) | 94% |
| 10 | KF851241 | Escherichia sp. | Proteobacteria, Gammaproteobacteria, Enterobacteriales, Enterobacteriaceae | 100% |
| 11 | HQ857728 | Salinimicrobium | Bacteroidetes, Flavobacteriia, Flavobacteriales, Flavobacteriaceae | 92% |
| 12 | KF851241 | Escherichia sp. | Proteobacteria, Gammaproteobacteria, Enterobacteriales, Enterobacteriaceae | 100% |
| 13 | DQ768632 | Alcanivorax | Proteobacteria, Gammaproteobacteria, Oceanospirillales, Alcanivoracaceae | 100% |
Conclusions
It had been demonstrated in this study that the bioelectrochemical remediation of petroleum hydrocarbons in soil can be extended to a larger range using multilayer anodes. Using activated carbon as the cathodic catalyst, the charge output reached 918 C at 1000 Ω. Soil pH was increased during the remediation, especially the soil close to the cathode. The degradation of both PAHs and n-alkanes were accelerated by the bioelectrochemical process. The Geobacteraceae sp. and Escherichia sp. found in this system possibly played a key role in electricity generation and petroleum hydrocarbons degradation.Experimental
Saline soil
Saline soil contaminated by petroleum hydrocarbons was excavated from the ground surface (<10 cm in depth) around beam balanced pumping units in Dagang Oilfield (Tianjin, China). The soil was partially air-dried and passed through a 2 mm sieve. After mixing, the sieved soil was analyzed for properties (Table S1†).According to our earlier studies, the saturated water content in soil substantially enhanced the degradation of hydrocarbons and the number of hydrocarbon degradation bacteria.13 Thus, all the experiments here were employed under a water layer (waterlogged) to facilitate the diffusion of proton/hydroxide and keep a good anaerobic environment.
MFC configuration and operation
A soil MFC (SMFC, 6 cm × 6 cm × 9 cm) was designed with three layers of anodes inserted in parallel in the soil and an AC air-cathode at the bottom as illustrated in Fig. 1a. Anodes were made of carbon meshes (6 × 6 cm, Jilin Carbon Factory, Jilin, China). Carbon meshes were soaked in acetone overnight and rinsed in water three times before use.25 AC air-cathodes (6 × 6 cm, 60 × 60 stainless steel mesh) were made by the rolling-press method according to previous descriptions.26,27 The catalyst layer was directly in contact with the soil, while the gas diffusion layer on the opposite side was exposed to the air. The cathode was fixed by a porous Plexiglas plate (pore diameter of 0.5 cm, with a spacing of 1 cm between two pores, Fig. 1b) at the bottom of SMFC.340 g of contaminated dry soil was equably mixed with 90 mL distilled water and filled into two identical SMFCs. For each SMFC, three anodes were inserted in parallel with distances of 1 cm (layer 3), 3 cm (layer 2) and 5 cm (layer 1) to the cathode before the reactor was sealed with distilled water. A titanium sheet 1 cm in width and 1 mm in thickness was firmly fixed at the edges of each electrode as the current collector (Fig. 1b). One SMFC was operated at open circuit conditions as the control, and the other SMFC was operated with all anodes connected together to the cathode through a 1000 Ω external resistance in a 30 °C constant temperature incubator. At the end of the test, soil samples between electrodes were obtained and marked as SL1, SL2, SL3, SL4 for analysis (Fig. 1b).
Chemical and electrochemical analysis
TPH, n-alkanes and 16 priority PAHs were measured according to the procedures described previously.13 The net degradation rate was calculated as η = (CNA − C)/CNA, where CNA is the pollutant (such as PAH) concentration in the disconnected control reactor and C is the concentration of the same pollutant in the connected SMFC. The overall net degradation rate of PAHs (or 33 n-alkanes) was calculated by summing the concentrations of 16 PAHs (or 33 n-alkanes). Soil samples taken from each layer and the uniform mixture of all soils (mixed) were prepared to measure concentrations of TPHs, PAHs and n-alkanes.The pH and conductivity of soil were measured in a mixture of soil and distilled water with a weight (2 g)![[thin space (1/6-em)]](https://www.rsc.org/images/entities/char_2009.gif) :
:![[thin space (1/6-em)]](https://www.rsc.org/images/entities/char_2009.gif) volume (10 mL) ratio of 1
volume (10 mL) ratio of 1![[thin space (1/6-em)]](https://www.rsc.org/images/entities/char_2009.gif) :
:![[thin space (1/6-em)]](https://www.rsc.org/images/entities/char_2009.gif) 5. Available nitrogen, available phosphorus, available potassium and organic matter was determined by conventional methods.28 The contents of Zn, Cu, Ni, Mn, Fe, Pb, Cr, Cd were extracted by the microwave digestion method and measured using ICP-OES (Vista MPX Varian, US).29
5. Available nitrogen, available phosphorus, available potassium and organic matter was determined by conventional methods.28 The contents of Zn, Cu, Ni, Mn, Fe, Pb, Cr, Cd were extracted by the microwave digestion method and measured using ICP-OES (Vista MPX Varian, US).29
Voltages (U, mV) across 1000 Ω external resistance (R, Ω) were recorded every 1800 s (t) using a data acquisition system (PISO-813, ICP DAS Co., Ltd, Shanghai, China). The power densities (P, mW m−2) were normalized to the cathodic projected area (A = 0.0036 m−2) and calculated as P = U2/(RA).30 Total charge output was obtained by  , where T (s) is the cycle time.
Biological analysis
Bacterial genomic DNA was extracted from the soil sample using the DNA Gel Extraction Kit (OMEGA, US) according to the instructions of the manufacturer. The universal primer set GC-338F (5′-CGC CCG GGG CGC GCC CCG GGG CGG GGC GGG GGC GCG GGG GG CCT ACG GGA GGC AGC AG-3′) and 518R (5′-ATT ACC GCG GCT GCT GG-3′) was used to amplify the V3 region of bacterial 16S rDNA. PCR amplification was performed in T-gradient (Biometra, GER) under the following conditions: initial denaturation at 94 °C for 5 min, denaturation at 94 °C for 1 min, renaturation at 55 °C for 45 s, extension at 72 °C for 1 min, followed by 30 cycles and finally at 72 °C for 10 min.Denaturing gradient gel electrophoresis (DGGE) was performed using the Gel-Doc 2000 (Bio-Rad, US). PCR products (10 μL) were loaded onto 8% polyacrylamide gels containing a gradient of denaturant ranging from 35% to 55% (100% corresponded to 7 M urea and 40% wt% acrylamide). DGGE was run in 1 × TAE buffer at 150 V for 5 h (60 °C). After electrophoresis, the gels were stained using the process of argentation dyeing (15 min) before being photographed. Bands of interest were excised and recovered using the Poly-Gel DNA Extraction Kit (OMEGA, US).
The PCR products were verified using a 1.2% agarose gel and then sent for sequencing after re-amplified PCR (Genia Biological Technology Co., Ltd., Beijing, China). The sequences were compared with those of the NCBI BLAST GenBank nucleotide sequence databases and the BLAST program (http://www.ncbi.nlm.nih.gov/BLAST/).
Quantity One was used to analyze the DGGE pattern, and Shannon–Wiener index (H), uniformity index (EH) and richness (S) were calculated by Origin. H = −∑(Ni/N![[thin space (1/6-em)]](https://www.rsc.org/images/entities/char_2009.gif) ln(Ni/N)), where Ni is the optical density of the band i and N is the sum of the optical densities of all bands. EH = H/ln
ln(Ni/N)), where Ni is the optical density of the band i and N is the sum of the optical densities of all bands. EH = H/ln![[thin space (1/6-em)]](https://www.rsc.org/images/entities/char_2009.gif) S, where S is the number of the band.31
S, where S is the number of the band.31
Acknowledgements
The authors thank Dr Yuan Lu for help with the GC-MS analysis. This research work was financially supported by MOE Innovative Research Team in University (IRT13024), the Ministry of Science and Technology as an 863 major project (grant no. 2013AA06A205), the National Natural Science Foundation of China as a young scholar project (no. 21107053) and as a key project (no. 21037002), the Fundamental Research Funds for the Central Universities and the Ph.D. Candidate Research Innovation Fund of Nankai University (no. 68140001).References
- M. Ayotamuno, R. Kogbara, S. Ogaji and S. Probert, Appl. Energy, 2006, 83, 1249–1257 CrossRef CAS PubMed.
- C. Hall, P. Tharakan, J. Hallock, C. Cleveland and M. Jefferson, Nature, 2003, 426, 318–322 CrossRef CAS PubMed.
- Q. Zhou, F. Sun and R. Liu, Environ. Int., 2005, 31, 835–839 CrossRef PubMed.
- Q. Zhou and Y. Song, Principles and methods of contaminated soil remediation, Science Press, Beijing, China, 2004 Search PubMed.
- E. Riser-Roberts, Remediation of petroleum contaminated soils: biological, physical, and chemical processes, CRC Press, 1998 Search PubMed.
- J. M. Morris and S. Jin, J. Environ. Sci. Health, Part A: Toxic/Hazard. Subst. Environ. Eng., 2008, 43, 18–23 CrossRef CAS PubMed.
- J. M. Morris, S. Jin, B. Crimi and A. Pruden, Chem. Eng. J., 2009, 146, 161–167 CrossRef CAS PubMed.
- P. Liang, J. Wei, M. Li and X. Huang, Front. Environ. Sci. Eng., 2013, 7, 913–919 CrossRef CAS.
- J. M. Morris and S. Jin, J. Hazard. Mater., 2012, 213, 474–477 CrossRef PubMed.
- Y. Yuan, S. Zhou and L. Zhuang, J. Soils Sediments, 2010, 10, 1427–1433 CrossRef CAS.
- A. Wang, H. Cheng, N. Ren, D. Cui, N. Lin and W. Wu, Front. Environ. Sci. Eng., 2012, 6, 569–574 CrossRef CAS.
- D. Huang, S. Zhou, Q. Chen, B. Zhao, Y. Yuan and L. Zhuang, Chem. Eng. J., 2011, 172, 647–653 CrossRef CAS PubMed.
- X. Wang, Z. Cai, Q. Zhou, Z. Zhang and C. Chen, Biotechnol. Bioeng., 2012, 109, 426–433 CrossRef CAS PubMed.
- L. Lu, T. Huggins, S. Jin, Y. Zuo and Z. J. Ren, Environ. Sci. Technol., 2014, 48, 4021–4029 CrossRef CAS PubMed.
- X. Liu, W. Li and H. Yu, Chem. Soc. Rev., 2014, 43, 7718–7745 RSC.
- L. Lu, H. Yazdi, S. Jin, Y. Zuo, P. H. Fallgren and Z. J. Ren, J. Hazard. Mater., 2014, 274, 8–15 CrossRef CAS PubMed.
- X. Wang, C. Feng, N. Ding, Q. Zhang, N. Li, X. Li, Y. Zhang and Q. Zhou, Environ. Sci. Technol., 2014, 48, 4191–4198 CrossRef CAS PubMed.
- Y. Yuan, Q. Chen, S. Zhou, L. Zhuang and P. Hu, J. Chem. Technol. Biotechnol., 2012, 87, 80–86 CrossRef CAS.
- J. Tang, X. Lu, Q. Sun and W. Zhu, Agric., Ecosyst. Environ., 2012, 149, 109–117 CrossRef CAS PubMed.
- X. Qin, D. Li, J. Tang, Q. Zhang and J. Gao, Lett. Appl. Microbiol., 2012, 55, 210–217 CrossRef CAS PubMed.
- B. E. Logan, Nat. Rev. Microbiol., 2009, 7, 375–381 CrossRef CAS PubMed.
- D. R. Lovley, Nat. Rev. Microbiol., 2006, 4, 497–508 CrossRef CAS PubMed.
- Y. Wang, S. Tsujimura, S. Cheng and K. Kano, Appl. Microbiol. Biotechnol., 2007, 76, 1439–1446 CrossRef CAS PubMed.
- T. Zhang, C. Cui, S. Chen, H. Yang and P. Shen, Electrochem. Commun., 2008, 10, 293–297 CrossRef CAS PubMed.
- X. Wang, S. Cheng, Y. Feng, M. D. Merrill, T. Saito and B. E. Logan, Environ. Sci. Technol., 2009, 43, 6870–6874 CrossRef CAS.
- H. Dong, H. Yu, H. Yu, N. Gao and X. Wang, J. Power Sources, 2013, 232, 132–138 CrossRef CAS PubMed.
- X. Li, X. Wang, Y. Zhang, N. Ding and Q. Zhou, Appl. Energy, 2014, 123, 13–18 CrossRef CAS PubMed.
- G. Liu, Soil physical and chemical analysis and description of soil profiles, China Standard Press, Beijing, China, 1996 Search PubMed.
- Y. Sun, Q. Zhou, X. Xie and R. Liu, J. Hazard. Mater., 2010, 174, 455–462 CrossRef CAS PubMed.
- Y. Zhang, X. Wang, X. Li, N. Gao, L. Wan, C. Feng and Q. Zhou, RSC Adv., 2014, 4, 42577–42580 RSC.
- Z. Jin, Acta Bot. Yunnanica, 1999, 21, 296–302 Search PubMed.
Footnote |
| † Electronic supplementary information (ESI) available. See DOI: 10.1039/c4ra10673c |
| This journal is © The Royal Society of Chemistry 2014 |


